Download presentation
Presentation is loading. Please wait.

2
OPEC – a cartel of countries that join together to make decisions regarding the supply of oil in the world market GDP – the dollar market value of all the goods and services produced in a given economy in a given time period (a barometer of a country’s economic health) Value of the dollar – the international value of the U.S. currency Oil is refined and processed into gasoline. The gasoline market has demand and supply

3
Production Weather Wars Politics Exploration

4
OPEC, supplier of more than 40 percent of the world’s oil, lowered its forecast for 2009 oil demand to 87.66 million barrels a day due to the global economic slowdown. The OPEC governor said that OPEC needs to study the effects of its production cuts before considering an emergency meeting by at least reviewing the data from September and October. OPEC agreed to a limit for 11 members of 28.8 million barrels a day, 500,000 barrels lower than their July output. They meet again on Dec. 17.

6
1 Saudi Arabia :9,475,000 Saudi Arabia 2 Russia :9,400,000 Russia 3 United States :7,610,000 United States 4 Iran :3,979,000 Iran 5 China :3,631,000 China 6 Mexico :3,420,000 Mexico 7 Norway :3,220,000 Norway 8 Canada :3,135,000 Canada 9 Venezuela :3,081,000 Venezuela 10 United Arab Emirates :2,540,000 United Arab Emirates 11 Nigeria :2,451,000 Nigeria 12 Kuwait :2,418,000 Kuwait 13 Iraq :2,130,000 Iraq 14 United Kingdom :2,075,000 United Kingdom 15 Libya :1,720,000 Libya 16 Angola :1,600,000 Angola 17 Brazil :1,590,000 bbl/day Brazil

7
Total U.S. marketed natural gas production is expected to increase by 7.8 percent in 2008 and by 3.8 percent in 2009. Strong year- over-year production growth has been led by the development of onshore fields, particularly in Texas and Wyoming, where production increased by 16 and 12 percent, respectively, during the first 6 months of 2008 relative to year-ago levels.

8
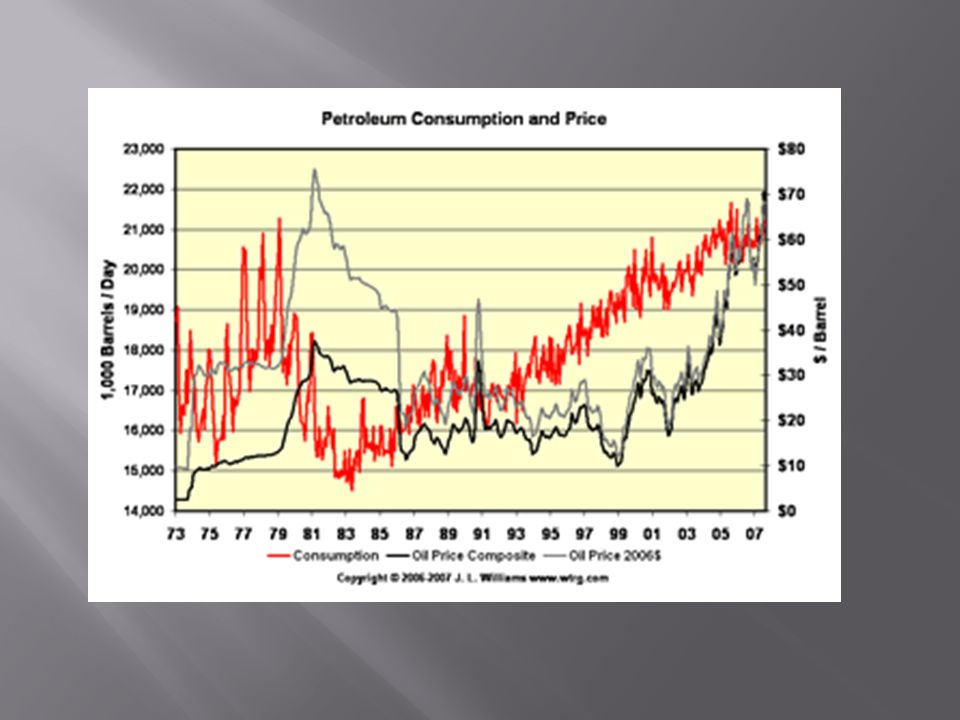
How much oil does the U.S. consume each day? 20.7 million barrels How much oil does the U.S. produce each day? 7.6 million barrels How much oil does the U.S. import each day? 9.7 million barrels How much does the U.S. import each day in other petroleum products? 3.4 million barrels Petroleum products include unfinished oils, liquefied petroleum gases, pentanes plus, aviation gasoline, motor gasoline, etc.

9
Country YTD 2008 YTD 2007 CANADA 2,459 2,458 SAUDI ARABIA 1,558 1,435 VENEZUELA 1,196 1,363 MEXICO 1,302 1,593 NIGERIA 1,052 1,054 IRAQ 677 473 ANGOLA 527 554 RUSSIA 486 419 ALGERIA 524 722 VIRGIN ISLANDS 329 327 BRAZIL 250 204

11
Alternative fuels Worldwide Economic Growth China Conservation Income Changing taste and preference

12
Total U.S. petroleum and other liquids consumption is projected to decline by 610,000 bbl/d, or about 3 percent, in 2008

14
World 80,290,000 World United States 20,800,000 United States European Union 14,550,000 European Union China 6,930,000 China Japan 5,353,000 Japan Russia 2,916,000 Russia Germany 2,618,000 Germany India 2,438,000 India Canada 2,290,000 Canada Korea, South 2,130,000 Korea, South

15
Total natural gas consumption is expected to increase by 2.7 percent in 2008 and by 2.2 percent in 2009

16
Price Quantity supplied (QS) $2.30 300 million gallons per day $2.90 340 $3.20 380 $3.50 400 $4.10 500 Price Quantity demanded by all U.S. consumers of gasoline (QD) $4.70 300 million gallons per day $4.10 350 $3.50 400 $2.90 425 $2.30 470
 $ million gallons per day $ $ $ $")
21
Is the market efficient? Price gouging – pricing above the market price when no alternative retailer is available

22
YearJanFebMarAprMayJunJulAugSepOctNovDec 1998 1.1311.0821.0411.0521.0921.0941.0791.0521.0331.0421.0280.986 1999 0.9720.9550.9911.1771.1781.1481.1891.2551.281.2741.2641.298 2000 1.3011.3691.5411.5061.4981.6171.5931.511.5821.5591.5551.489 2001 1.4721.4841.4471.5641.7291.641.4821.4271.5311.3621.2631.131 2002 1.1391.131.2411.4071.4211.4041.4121.4231.4221.4491.4481.394 2003 1.4731.6411.7481.6591.5421.5141.5241.6281.7281.6031.5351.494 2004 1.5921.6721.7661.8332.0092.0411.9391.8981.8912.0292.011.882 2005 1.8231.9182.0652.2832.2162.1762.3162.5062.9272.7852.3432.186 2006 2.3152.312.4012.7572.9472.9172.9992.9852.5892.2722.2412.334 2007 2.2742.2852.5922.863.133.0522.9612.7822.7892.7933.0693.02 2008 3.0473.0333.2583.4413.7644.0654.093.786

Similar presentations