Download presentation
Presentation is loading. Please wait.

1
Geology and Geography of Oil

2
Outline Energy resource overview The geology of oil
Origin of oil How to find oil The geography of oil: resource, production and consumption

3
Hydropower, geothermal,
Energy Resources World Nuclear power 6% Hydropower, geothermal, solar, wind 7% Natural Gas 23% Biomass 11% Oil 32% Coal 21% United States 8% Hydropower geothermal 4% 39% 22%

4
Oil equivalent (millions of metric tons)
Coal Natural gas Year 1950 1960 1970 1980 1990 2000 2010 3,500 3,000 2,500 2,000 1,500 1,000 500 Global Consumption of Fossil Fuels

6
Daily Energy Use Per Person in Different Stages of Development
Society Kilocalories per Person per Day Modern industrial (United States) 260,000 Modern industrial (other developed nations) 130,000 Early industrial 60,000 Advanced agricultural 20,000 Early agricultural Daily Energy Use Per Person in Different Stages of Development 12,000 Hunter– gatherer 5,000 Primitive 2,000
 260,000. Modern industrial. (other developed. nations) 130,000. Early. industrial. 60,000. Advanced. agricultural. 20,000. Early. agricultural. Daily Energy Use Per Person in Different Stages of Development. 12,000. Hunter– gatherer. 5,000. Primitive. 2,000.")
7
Per Capita Energy Use and GNP

8
The Story of Petroleum

9
Chemical composition of Oil Hydrocarbons
Gas – C1-C4 Liquid – C5-C15 Solid – above C15

10
Petroleum forms from oceanic micro-organisms

11
Natural “traps” keep oil and gas from oozing out at the surface

12
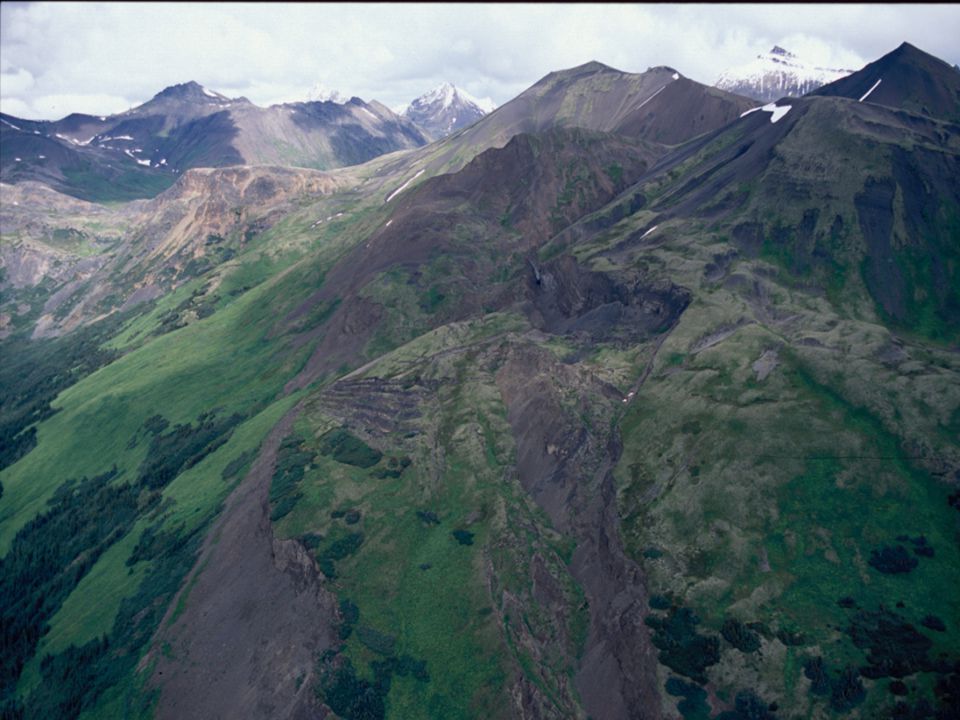
How to find oil: Source rock, reservoir rock, structural traps

13
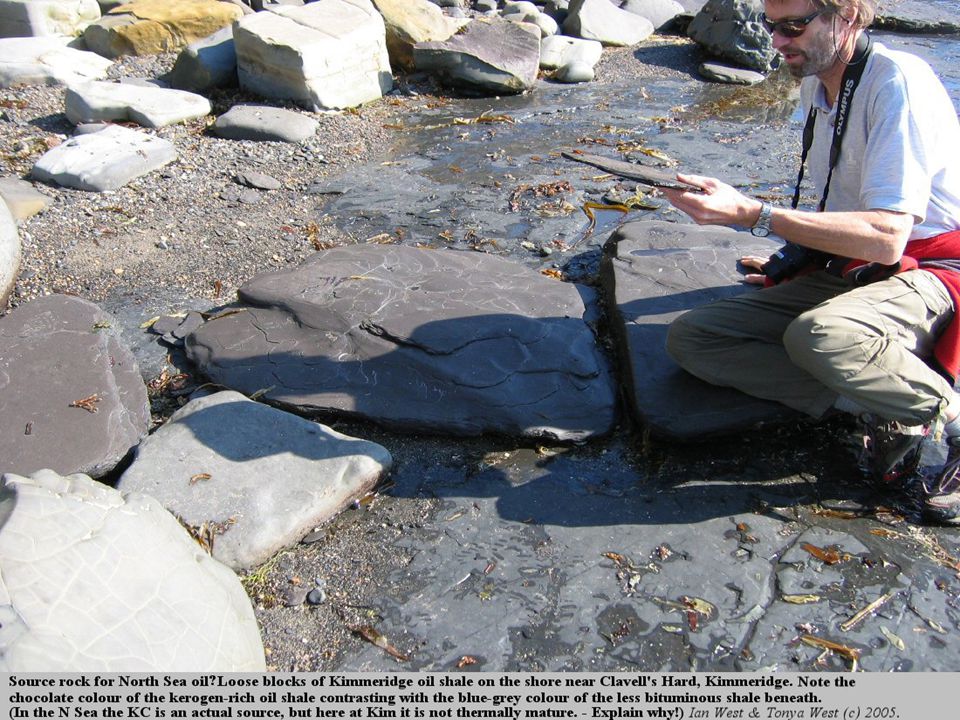
Source Rock Organic rich shale Oil window Late Cretaceous (90 Ma)
Late Jurassic (150 Ma) Oil window Thermal history oC meter
 Oil window. Thermal history oC meter.")
14
Reservoir Rock Porosity and permeability Sandstone and limestone

15
Oil Traps

16
How to find oil Surface exploration Subsurface exploration
Seismic reflection Drilling

18
Oil seep

19
Source rock analysis

21
Exploration Wells - Wildcats

22
Location of world petroleum deposits

23
Regional Shares of Proved Oil Reserves
Middle East 67.9% Western Europe 2% North America 6.7% Africa 5% Latin America 6.5% Eastern Europe and Russia 8% Far East and Oceania 5.9%

24
Oil Reserve by Country

25
Countries with most oil reserve
# Country Reserve (109 barrels) 1 Saudi Arabia 262.7 2 Canada 178.9 3 Iran 133.3 4 Iraq 112.5 5 United Arab Emirates 97.8 6 Kuwait 96.5 7 Venezuela 75.6 8 Russia 69.0 9 Libya 40.0 10 Nigeria 36.0 11 Mexico 33.3 12 Kazakhstan 26.0 13 Angola 25.0 14 United States 22.5
 1. Saudi Arabia Canada Iran Iraq United Arab Emirates Kuwait Venezuela Russia Libya Nigeria Mexico Kazakhstan Angola United States")
26
Oil Production by Country

27
Top Oil producing countries
# Producing Nation for 2004 (×106bbl/d) (×103m³/d) 1 Saudi Arabia (OPEC) 10.37 1,649 2 Russia 9.27 1,474 3 United States 8.69 1,382 4 Iran (OPEC) 4.09 650 5 Mexico 3.83 609 6 China 3.62 576 7 Norway 3.18 506 8 Canada 3.14 499 9 Venezuela (OPEC) 2.86 455 10 United Arab Emirates (OPEC) 2.76 439 11 Kuwait (OPEC) 2.51 399 12 Nigeria (OPEC) 13 United Kingdom 2.08 331 14 Iraq (OPEC) 2.03 323
 (×103m³/d) 1. Saudi Arabia (OPEC) , Russia , United States , Iran (OPEC) Mexico China Norway Canada Venezuela (OPEC) United Arab Emirates (OPEC) Kuwait (OPEC) Nigeria (OPEC) 13. United Kingdom Iraq (OPEC)")
28
Oil Export by Country

29
Top petroleum-exporting countries
In order of amount exported in 2003: Saudi Arabia (OPEC) Russia Norway Iran (OPEC) United Arab Emirates (OPEC) Venezuela (OPEC) Kuwait (OPEC) Nigeria (OPEC) Mexico Algeria (OPEC) Libya (OPEC)
 Russia. Norway. Iran (OPEC) United Arab Emirates (OPEC) Venezuela (OPEC) Kuwait (OPEC) Nigeria (OPEC) Mexico. Algeria (OPEC) Libya (OPEC)")
30
Consumption by Country

31
Top petroleum-consuming countries
# Consuming Nation (bbl/day) (m³/day) 1 United States 20,030,000 3,184,516 2 China 6,391,000 1,016,088 3 Japan 5,578,000 886,831 4 Russia 2,800,000 445,164 5 Germany 2,677,000 425,609 6 India 2,320,000 368,851 7 Canada 2,300,000 365,671 8 South Korea 2,061,000 327,673 9 France 2,060,000 327,514 10 Italy 1,874,000 297,942 11 Saudi Arabia 1,775,000 282,202 12 Mexico 1,752,000 278,546 13 United Kingdom 1,722,000 273,776 14 Brazil 1,610,000 255,970
 (m³/day) 1. United States. 20,030,000. 3,184, China. 6,391,000. 1,016, Japan. 5,578, , Russia. 2,800, , Germany. 2,677, , India. 2,320, , Canada. 2,300, , South Korea. 2,061, , France. 2,060, , Italy. 1,874, , Saudi Arabia. 1,775, , Mexico. 1,752, , United Kingdom. 1,722, , Brazil. 1,610, ,970.")
32
Oil Import by Country

33
Top petroleum-importing countries
# Importing Nation (bbl/day) (m³/day) 1 United States 13,150,000 2,790,683 2 Japan 5,449,000 866,322 3 China 3,226,000 512,893 4 Netherlands 2,284,000 363,127 5 France 2,281,000 362,650 6 South Korea 2,263,000 359,788 7 Italy 2,158,000 343,095 8 Germany 2,135,000 339,438 9 India 2,090,000 332,283 10 Spain 1,582,000 251,518 11 United Kingdom 1,084,000 172,342 12 Belgium 1,042,000 165,665 13 Canada 963,000 153,105 14 Turkey 616,500 98,016
 (m³/day) 1. United States. 13,150,000. 2,790, Japan. 5,449, , China. 3,226, , Netherlands. 2,284, , France. 2,281, , South Korea. 2,263, , Italy. 2,158, , Germany. 2,135, , India. 2,090, , Spain. 1,582, , United Kingdom. 1,084, , Belgium. 1,042, , Canada. 963, , Turkey. 616, ,016.")
34
International Crude Oil Flow by Sea

35
Future of Oil – Peak Oil?

36
US Oil Discovery and Production

37
Oil Discovery (3 year average - past and projected) 1930-2050
")
38
The number of exploratory wells - wildcats - drilled by the Shell oil company are plotted on the horizontal axis and the cumulative amount of oil they discovered is shown in billions of barrels (Gb, or giga-barrels) on the vertical one. The graph makes it clear that recent drilling has discovered much less oil per wildcat than in the early days.

40
Petroleum depletion

41
Oil Use in US 62% of energy comes from oil and natural gas
95% of energy used for transportation comes from oil 1.7% of world oil reserve Use 30% of global oil production 70% for transportation Import 60% of oil supplies

Similar presentations