Download presentation
Presentation is loading. Please wait.

1
What factors contribute to a region’s climate?
Directions: - Click “Slide Show” then “View Show” to view the power point. Record all notes and complete all tasks in your notebook. If a page doesn’t have a directions box like this, just get the notes. Climate Lesson What factors contribute to a region’s climate?

2
Table of Contents Date Title Lesson # 8/28 The 5 A’s 3 8/31
Geographer’s Tools 4 9/1 Internal Forces 5 9/3 External Forces 6 9/8 Climographs 7 1. Draw a line underneath wherever you left off yesterday. 2. Write the title “Climographs”

3
Number in your notebook 1-8.
Major Climate Regions 1. Tropical Wet: Always hot and rainy (Amazon Rainforest) 2. Desert: Less than 10 inches of rain per year (Phoenix, AZ) 3. Semiarid: Receives between 10 and 16 inches of rain per year (West Texas) 3
 2. Desert: Less than 10 inches of rain per year (Phoenix, AZ) 3. Semiarid: Receives between 10 and 16 inches of rain per year (West Texas) 3.")
4
Major Climate Regions 4. Mediterranean: Dry and hot summers, cool and rainy winters (Los Angeles, CA) 5. Humid Subtropical: Hot and humid summers, mild to cool winters (Houston, TX) 6. Marine West Coast: Warm ocean currents bring mild temperatures and constant rainfall (Seattle, WA).
 6. Marine West Coast: Warm ocean currents bring mild temperatures and constant rainfall (Seattle, WA).")
5
Major Climate Regions 7. Humid Continental: Hot summers, cold winters. Located in the interior, far away from oceans. Four distinct seasons (St. Louis, MO). 8. Tundra: Always cold. Flat, treeless lands around the Arctic Ocean. Very little rain. Land has permafrost. (Greenland)
. 8. Tundra: Always cold. Flat, treeless lands around the Arctic Ocean. Very little rain. Land has permafrost. (Greenland)")
6
Climographs Definition Climographs are a graphic representation of the climate in a given area. 5 Themes of Geography – Place What is it like there? You could use a climograph to tell you COPY WHAT IS IN THE BOX

7
Hilo, Hawaii – Tropical Wet
COPY WHAT IS IN THE BOX Climographs include… a line graph measuring average temperature and… a bar graph measuring average rainfall for each month. Temperature Rainfall 7

8
Houston Climograph - Humid Subtropic

9
Las Vegas Climograph - Desert
Task complete the questions below in your notebook… How are the climates of Houston and Las Vegas different? How do you know?

10
Task complete the questions below in your notebook…
How are the climates of Houston and Las Vegas different? How do you know? Houston – Humid Subtropical Las Vegas - Desert

11
Climograph Help How to read a climograph Use the key
Task Complete the questions below in your notebook… How would a farmer use a climograph? How would a tourist use a climograph? What is another profession in which people would find a climograph useful? How to read a climograph Use the key Line graph = temperature Bar graph = precipitation Does what you’re thinking make sense? Check your axises COPY WHAT IS IN THE BOX

12
Climograph Assignment – K/H
You have been hired by the US military to analyze the climate of two cities, Baghdad and Houston. Major decisions will be made based on your analysis of the climate of both cities. He wants you to determine when is the best month to launch the attack. To do so you must analyze the climates of both cities and determine which month is the best time to launch the attack from Houston that will blow up a bunker in Baghdad. Your commander will present you with the following directions…

13
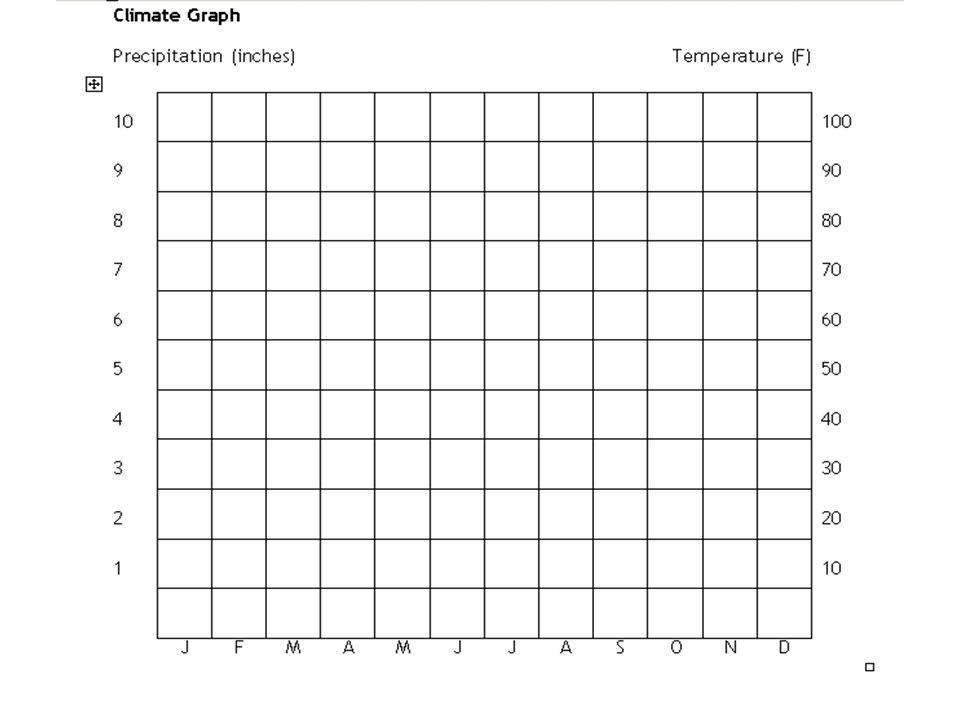
How to Make a Climate Graph:
1. Plot the data on RAIN (precipitation, shown in inches) as a bar graph by month. 2. Plot the data on TEMP (temperature in degrees Fahrenheit [F]) as a line graph by month. 3. Analyze the two graphs to describe the climates in these two locations? - What are the seasons like? When is it hot? When is it cooler? - When is it wet? When is it dry? - You may wish to use Handout 3 “Describing a Climate Graph” to help.
 as a bar graph by month. 2. Plot the data on TEMP (temperature in degrees Fahrenheit [F]) as a line graph by month. 3. Analyze the two graphs to describe the climates in these two locations - What are the seasons like When is it hot When is it cooler - When is it wet When is it dry - You may wish to use Handout 3 Describing a Climate Graph to help.")
Similar presentations
 Which is closest to the equator?>")


>")


