Download presentation
Presentation is loading. Please wait.

2
Population Distribution & Growth

3
Population density - is a measure of how compact or concentrated a population is. It takes an area of land into account as well as population. - For example, Canada as a whole, has a much larger population than St. John's alone. Population Density & Global Patterns

8
⋅ Population Density = population per unit area (unit area is usually measured in Km 2 or miles 2 ) Calculating and Determining Population Density
 Calculating and Determining Population Density")
11
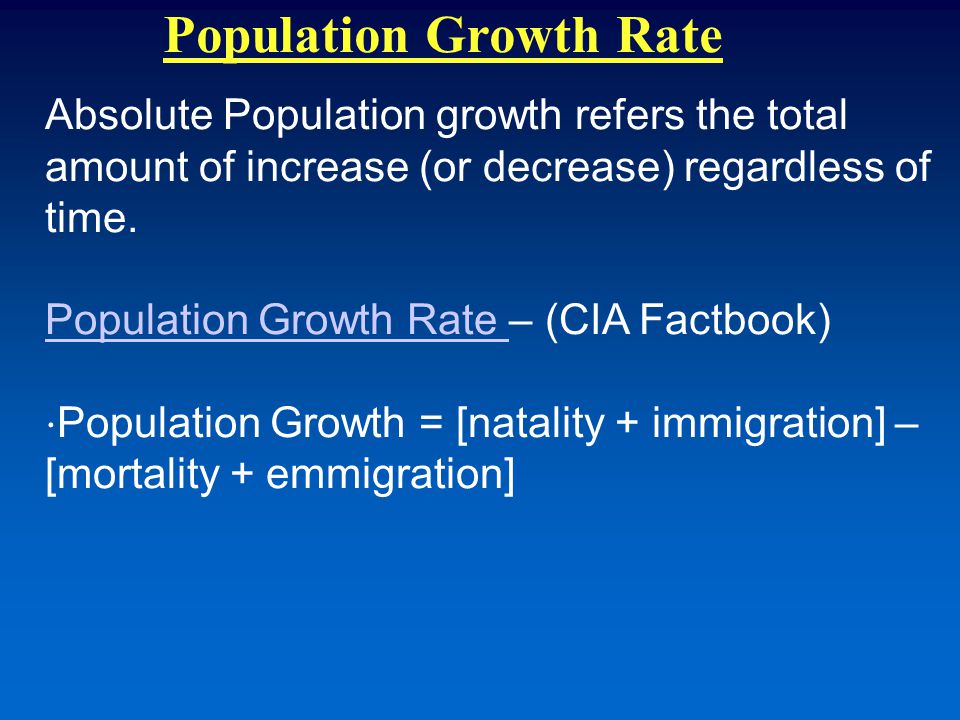
Absolute Population growth refers the total amount of increase (or decrease) regardless of time. Population Growth Rate Population Growth Rate – (CIA Factbook) ⋅ Population Growth = [natality + immigration] – [mortality + emmigration] Population Growth Rate
 ⋅ Population Growth = [natality + immigration] – [mortality + emmigration] Population Growth Rate.")
12
Sweden Sweden's population changed from 7.9 million to 8.3 million between the years 1971 & 1981 AGR = 8.3 – 7.9 x 100% ÷ 10 = 0.5% (very low) 7.9 Mexico Mexico's population changed from 49 million to 72 million between the years 1971 & 1981 AGR = 72 – 49 x 100% ÷ 10 = 4.7% (very high) 49
 7.9 Mexico Mexico s population changed from 49 million to 72 million between the years 1971 & 1981 AGR = 72 – 49 x 100% ÷ 10 = 4.7% (very high) 49")
15
Birth and Death Rates Birth/Death rates is calculated based on the number of occurances per 1,000 people per year.

16
Factors Affecting Birth Rates Pro-natalist policies and Antinatalist policies from government Pro-natalistAntinatalist Abortion rates Existing age-sex structure Social and religious beliefs - especially in relation to contraception Female literacy levels Economic prosperity (although in theory when the economy is doing well families can afford to have more children in practice the higher the economic prosperity the lower the birth rate).
.")
17
Factors Affecting Birth Rates Poverty levels – children can be seen as an economic resource in developing countries as they can earn money.they can earn money Infant Mortality Rate – a family may have more children if a country's IMR is high as it is likely some of those children will die. Urbanization Typical age of marriage Pension availability Conflict

18
Factors Affecting Death Rates Age of country's population Nutrition levels Standards of diet and housing Access to clean drinking Hygiene levels Levels of infectious diseases Levels of violent crime Conflicts Number of doctors

19
The "Demographic Transition" is a model that describes population change over time. It is based on an interpretation begun in 1929 by the American demographer Warren Thompson, of the observed changes, or transitions, in birth and death rates in industrialized societies over the past two hundred years or so. Demographic Transitions Model Controlling Population Growth

21
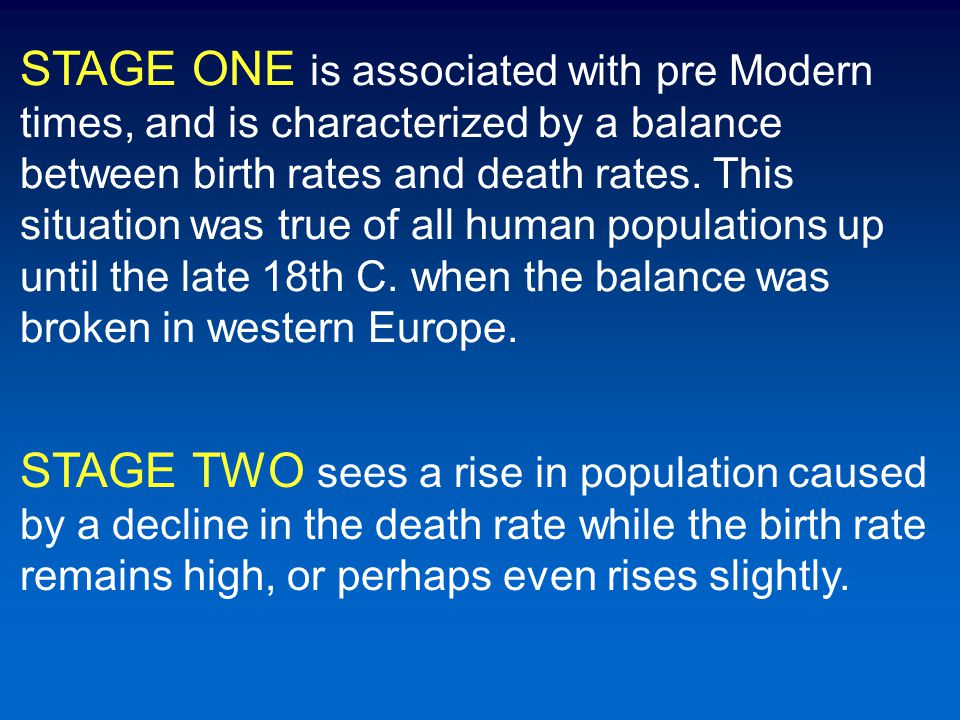
STAGE ONE is associated with pre Modern times, and is characterized by a balance between birth rates and death rates. This situation was true of all human populations up until the late 18th C. when the balance was broken in western Europe. STAGE TWO sees a rise in population caused by a decline in the death rate while the birth rate remains high, or perhaps even rises slightly.

22
STAGE THREE moves the population towards stability through a decline in the birth rate. This would be the case in developing countries and those that have recently become developed nations. STAGE FOUR is characterized by stability. In this stage the population age structure has become older.

23
Population structures The rates of natural increase, births, deaths, infant mortality and life expectancy all affect the population structure of a country. The population structure of a country can be shown by a population or age-sex pyramid.

24
Population pyramids show The total population divided into five- year age groups the percentage of people in each of those age groups the percentage of males and females in each age group

25
Population pyramids are useful because they show: Trends in the birth/death rate, infant mortality rate and life expectancy - these trends can help a country to plan its future services, e.g. more homes for the elderly if there is an ageing population or fewer schools if there is a declining birth rate. The effects of people migrating into or out of a region or country. The proportion of the population who are economically active and the proportion who are dependent upon them (dependency ratio).
..")
26
Population pyramids

27
Notice the following points about population pyramids: ⋅ normally Males are on the left and females are on the right; ⋅ age categories are in 5 year increasing intervals labelled up the center axis; ⋅ the horizontal axis is measured in millions.

29
Classifying Population Pyramids Expansive or expanding population pyramids have this classic triangular/pyramid shape. The wide base of this population pyramid indicates a high birth rate & the narrow top indicates a high death rate.

Similar presentations


 Absolute Population Growth refers the.>")


 Mr Elliott SSOT.>")


>")
