Download presentation
Presentation is loading. Please wait.

1
Energy Blowing in the Wind N. Keith Tovey, M.A., Phd. CEng, MICE Acknowledgement: Dr Jean Palutikof for use of some of her slides Hard Choices Ahead Thorpe St Andrews Rotary Club 8 th August 2003

2
Early Wind Power Devices C 700 AD in Persia used for grinding corn pumping water evidence suggests that dry valleys were “Dammed” to harvest wind

3
Traditional Windmills American Homestead Windmill for pumping water Traditional English Windmill Spanish Windmills Note 7 in a cluster of 11

4
Development of Modern Turbines 1.25 MW Turbine in Vermont (1941) Gedser Wind Turbine, Denmark (1957)
 Gedser Wind Turbine, Denmark (1957)")
5
Vertical Axis Machines Musgrove Rotor Carmarthen Bay 1985 - 1994 Darrieus Rotor - machines up to 4 MW have been built.

6
Other Wind Machines Savonius Rotors - good for pumping water - 3rd World applications Modern Multi-bladed water pumping HAWT.

7
What’s a modern wind turbine look like? Based on slide by Dr J. Palutikof The Ecotech Turbine avoids having a high speed gear box in the nacelle

8
Ecotech wind turbine Electricity per annum 3.9 GWh Annual homes equivalent ~1000 Displacement pa: CO 2 3000 tonnes SO 2 39 tonnes NO x 3 tonnes 67m 66m Dr J. Palutikof

9
Options for Electricity Generation in 2020 - Non-Renewable Methods

10
Options for Electricity Generation in 2020 - Renewable

11
How are we going to meet these demands for electricity in the future? The Energy Review indicates 10% by renewables by 2010 and 20% by 2020. “In order to get more than 10% of electricity from renewables by 2010 and 20% by 2020, build rates for the leading options would need to be at levels never before seen in the UK. Onshore and offshore wind would need to be installed at a rate of between 1-2 GW per year “(i.e. 1000 - 1500 turbines the size of Swaffham every year). “However, 1.5 GW and 1.6 GW of onshore wind was built in Germany in 1999 and 2000 respectively, and a further 1.2 GW was installed in 2001. Build rates of 1 GW per year were also seen Spain in 2000, and 600MW in Denmark in the same year.”
. However, 1.5 GW and 1.6 GW of onshore wind was built in Germany in 1999 and 2000 respectively, and a further 1.2 GW was installed in Build rates of 1 GW per year were also seen Spain in 2000, and 600MW in Denmark in the same year. .")
12
Wind Energy in Europe Currently 13,000 MW from wind energy Overall EU target of 12% of energy (22% electricity) from renewables by 2010 - UK 10%
 from renewables by UK 10%")
13
Wind Map of Western Europe: wind resource at 50m above surface Sheltered Open Coast Open sea Hills Dr J. Palutikof

14
Distraction to drivers Danger to birds Radio/Television/Radar Interference Noise - mechanical, aerodynamic, …..infra-sound? Flickering - only relevant within buildings and then only in a precise orientation at selected times of the year. Danger of ice throw - not really a problem as other constraints will mean that a sufficient exclusion zone is present anyway Blade failure Aesthetics - Key Environmental Issues - some of main issues against

15
Ice can form Planning Regulations Denmark Noise

16
How many blades?

17
Visual intrusion Some designs look better than others

18
Offshore wind energy - A solution? BUT Wind speeds are high Resource is enormous Visual intrusion is less than for onshore It’s expensive Maintenance is problematic

19
Examples of Offshore Wind

21
Future Global Warming Rates

22
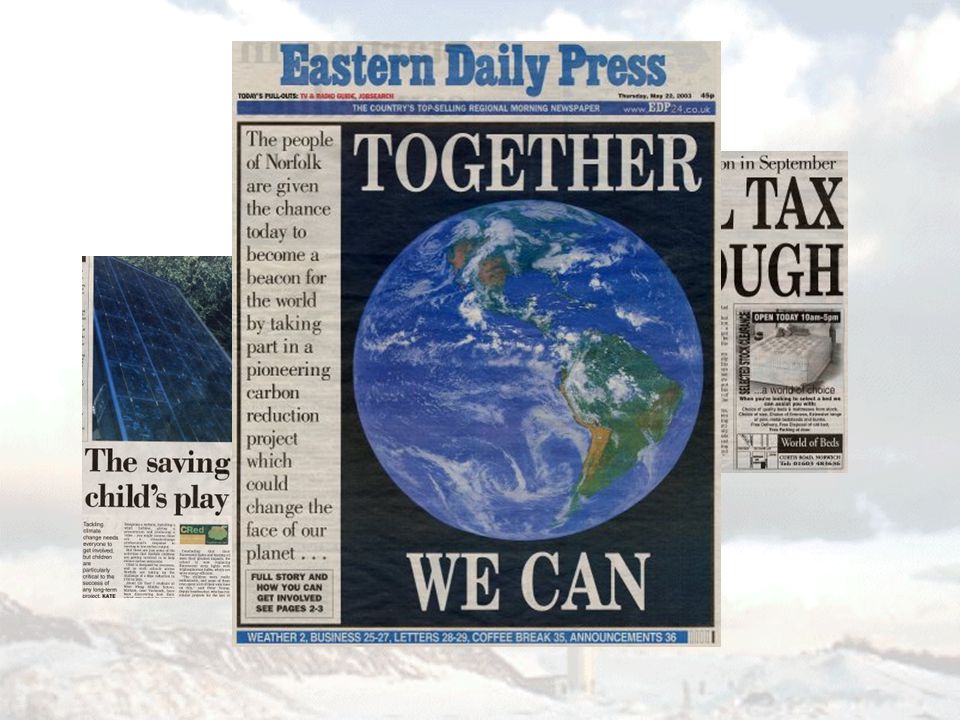
Government Response Energy White Paper – aspiration for 60% cut in CO 2 emissions by 2050 Will require unprecedented partnership activity in local communities to ensure on track by 2020s (– but no indication of how this will be undertaken) “ There will be much more local generation, in part from medium to small local/community power plant, fuelled by locally grown biomass, from locally generated waste, and from local wind sources. These will feed local distributed networks, which can sell excess capacity into the grid.’’ - Energy White Paper: February 2003

23
The right language? 5 hot air balloons full of CO 2 per person per year (4 million per year over Norfolk)
.")
25
Our Choices: They are difficult Do we want to exploit available renewables i.e onshore/offshore wind and biomass. If our answer is NO Do we want to see a renewal of nuclear power Are we happy on this and the other attendant risks? If our answer is NO Do we want to return to using coal? then carbon dioxide emissions will rise significantly unless we can develop carbon sequestration within 10 years which is unlikely If our answer to coal is NO Do we want to leave things are they are and see continued exploitation of gas for both heating and electricity generation? >>>>>>

26
Our Choices: They are difficult If our answer is YES By 2020 we will be dependent on around 70% of our heating and electricity from GAS which will have to be imported from countries like Russia, Iran, Iraq, Libya, Algeria Are we happy with this prospect? >>>>>> If not: We need even more substantial cuts in energy use which could affect both industry and our ability to heat an light our homes in the future. Unless we are prepared to sacrifice our future to effects of Global Warming Do we wish to reconsider our stance on renewables? Inaction or delays in decision making will lead us down the GAS option route and all the attendant Security issues that raises.

27
WEBSITE www.cred-uk.org/

Similar presentations
 M.A., PhD, CEng, MICE, CEnv Н.К.Тови М.А., д-р технических наук Energy Science Director: Low Carbon.>")


 Н.К.Тови M.A., PhD, CEng, MICE, CEnv Energy Science Director: Low Carbon Innovation Centre School of Environmental.>")

 - Rated Power 160 MW – Water Depth 10-15m.>")