Download presentation
Presentation is loading. Please wait.

1
DEVELOPMENT

2
The syllabus says:

3
Concept of development
Understand that development is not only concerned with economic growth, but includes other aspects such as providing for people’s basic needs, equity and social justice, sustainability and interdependence. Understand also that development applies not only at the global/international level but also at the local and national level. Appreciate that the cause of poverty and inequality are fundamental to understanding the concept of development.

4
Issues of development As an intelligent IB geographer you should also be aware of some of the issues surrounding these indicators. All of these indicators come from a very Western point of view. The most frequently used (GDP) is directly linked to money. Is it fair to value all societies by this? On the discovery of Aboriginals in Australia Captain Cooks men offered them gold in return for their digging sticks – potential souvenirs! No matter how much gold was offered the Aborigines would not part with their sticks. For them gold has no value. Is money held in such high regard around the world?
 is directly linked to money. Is it fair to value all societies by this On the discovery of Aboriginals in Australia Captain Cooks men offered them gold in return for their digging sticks – potential souvenirs! No matter how much gold was offered the Aborigines would not part with their sticks. For them gold has no value. Is money held in such high regard around the world")
6
You must also remember that a high GDP does not necessarily mean there is fair distribution throughout the country. With economic development comes stress. Cancer and heart disease is very rare in the developing world yet are the biggest killers in the Western World. Development leads to destruction and pollution of the natural environment. In the last two centuries development has done more damage to our world than the thousands of years before. You must use your own opinion on several matters especially when answering extended questions.

7
Indicators of development
Be aware of the various indicators used to measure development, their validity and their limitation. These indicators range from the simple component indices, that usually measure only economic development (GNP per capita or energy consumption per capita), to the multiple component indices that are more inclusive and attempt to measure the quality of life (Human Development Index).
, to the multiple component indices that are more inclusive and attempt to measure the quality of life (Human Development Index).")
8
Patterns of development
Draw broad conclusions about the spatial pattern of development at the global scale using a variety of measures. Recognize patterns within a country (core – periphery) and comment on changes over time in these spatial patterns.
 and comment on changes over time in these spatial patterns.")
9
Measuring differences in development
Indicators of development Indicators of development have several uses: They allow us to use a figure for comparing different countries. Countries can be ranked in an attempt to fairly allocate aid payments. Indicators give us an idea about what the country is like economically, socially, even environmentally. They do however have limitations that you should be aware of. These are discussed later. You need to be able to define the main indicators, explain what they mean and discuss their strengths and weaknesses. You should be aware that this is not a complete list of all indicators as that would be impossible.

11
The main indicators Gross Domestic Product (GDP) - this is the value of all goods and services produced within a country. It is usually measured in US$ and calculated per capita. This makes comparisons between different countries easier. Alternatively you could be faced with Gross National Product (GNP). The difference is that GNP also includes goods and services produced by that country overseas. GDP is probably the most widely used indicator. It implies a lot about the country. If the figure is high it suggests they have a large number of productive industries producing goods. It also suggests that the service industry is well developed. (Services include things such as hospital and schools. If the figure is low it suggests that the country has few industries and few services so therefore a poor standard of living.)
. The difference is that GNP also includes goods and services produced by that country overseas. GDP is probably the most widely used indicator. It implies a lot about the country. If the figure is high it suggests they have a large number of productive industries producing goods. It also suggests that the service industry is well developed. (Services include things such as hospital and schools. If the figure is low it suggests that the country has few industries and few services so therefore a poor standard of living.).")
13
Infant mortality This is the number of infants that die prematurely
Infant mortality This is the number of infants that die prematurely. You need to check the figures because it could be the numbers that die before they are one or five. It could be as a percentage of the births or a per thousand figure. Just check carefully before using. This will tell us the state of the countries health service, food provision and water quality:

15
Birth rate A simple one, the number of people born per thousand people per year. A high birth rate indicates a low level of development due to a lack of contraception or the need for large families. (See The Demographic Transition Model in the Population section). A low birth rate indicates a high level of development.
. A low birth rate indicates a high level of development.")
17
Death rate This is number of people who die per thousand people per year. It will be a clear indicator of the level of health care, quality of water, sanitation, accommodation, and food supply.

19
Literacy rates This is the percentage of people that can read and write. Clear indication of the availability of education and also the extent to which people can get into education – for example in India many children cannot get in to school as they have to work to help support their families.

21
There are of course other indicators but these are the main ones
There are of course other indicators but these are the main ones. If you come across another just think about what it shows and why. As you have seen each of these indicators have advantages and disadvantages. In an attempt to minimise these disadvantages composite indicators have been developed. Examples of these include the "Human suffering index" and the "Human development index". Each of these uses several indicators to try and avoid the disadvantages of one.

22
Human suffering index The country is ranked from 0 to 10 for each of the following indicators (0 is very good, 10 very bad): Life expectancy Daily calorie supply Access to clean water Per capital income Civil rights Political freedom Inflation Communications Percentage in secondary school Immunisation of infants

23
The countries scores are totalled and then ranked accordingly
The countries scores are totalled and then ranked accordingly. The worst a country could have is 100, the best 0. Using this score the worst countries would be Mozambique, Somalia and Afghanistan whilst the best would be Denmark, The Netherlands and Belgium.

24
Human Development Index
This uses fewer indicators than the above. It simply uses wealth, health and education. It is calculated each year. The best country get “1” the worst “0”. This score is compared to GDP tables. If a country is higher up the HDI table than the GDP table then it must be successfully investing in health and education. If it is below then there is room for improvement. Currently, several countries including Pakistan, Vietnam and Cuba are doing well whilst Namibia, Morocco and Algeria poorly.

25
Global inequalities A divided world
We can use a variety of these indicators to show us the general pattern of development around the world. You need to be able to explain why these differences exist:

26
There are three significant historical factors:
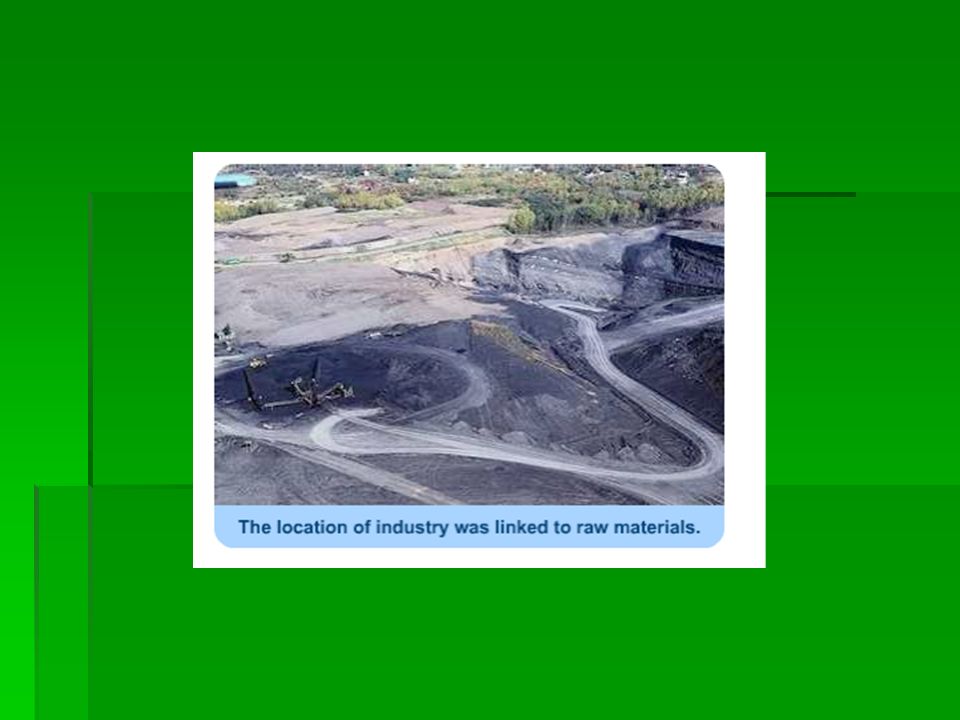
1. The UK was particularly fortunate to discover large quantities of high quality coal: This coal was used in early industries such as iron smelting. This led to wealth that could then be spent on: Education: meaning a more skilled and able workforce. Experimentation: meaning innovating new technology. This included guns that could be used to secure new colonies. There was also significant investment in the armed forces. Exploration: exploring the world and colonising much of it looking for new raw materials and markets to exploit.

27
2. Colonialism: This is the policy of obtaining and maintaining colonies. Basically, country A goes into country B and says we are now in charge! - Nice! Many European countries with greater armies and firepower were able to do this over most of Africa. If you look at the historic reasons for colonialism you should start to appreciate how this hinders the development of some countries but promotes others. In the nineteenth century many countries from Europe went across to Africa to colonise them. They wanted their raw materials to feed the industrial revolution that was taking place in their countries. This means that the materials from Africa were used to increase the wealth of the countries in Europe but obviously hindered the African countries chances of generating great wealth.

29
3. The Slave Trade: This took the strongest men and women from many African countries to work for European countries in strengthening their economies. Basically providing an incredibly cheap labour force to make them money. This again increased the wealth of the European countries and reduced the chance for African countries to develop.

30
Economic 1. Debt: One of the greatest problems faced by less developing world countries is their level of foreign debt. By struggling to pay debt countries cannot invest in education, medical care, transport route and are often giving up more of their raw materials as pay off. Many countries particularly in Africa owe staggering amounts of money. Ethiopia owes more than $10 billion. This is more than 13 times its foreign earnings. Ethiopia pays 4 times as much on debt repayment as it does on home expenditure. In the mean time children die each year from diarrhoea. You may have read about president Clinton put a system in place to write off debt. This is a good start and will be discussed in the reducing inequalities section.

31
2. The trade game: Less developed countries are disadvantaged by the world-trading pattern. They primarily produce raw materials, which are sold to developed countries that manufacture a product. The profits on the raw material are very low whilst those on the manufacturing good are high. Profits on the raw materials are kept low because so many countries are producing it. It is not unknown for that manufactured good to be sold back to the country that produced the raw material!

33
Coffee is a good example:
The UK imports 90% of its coffee as beans that it processes. On this it makes considerable profit. It prevents the developing world from setting up their own coffee processing plants by putting such a heavy tax on imported coffee that it would be unprofitable for them – i.e. It would be so highly priced because of the tax that no one would buy it.

34
3. Within the developing world the problems they face have often been made worse by political corruption: In Zaire for example the late President Mobuto is reputed to have had a personal fortune of over £5 billion, much of which was money siphoned of loans from the World Bank. In the time it took him to accrue this fortune the development of his country went into reverse. It was not even able to maintain the existing road networks.

35
4. When looking at the development of countries around the world it
is always worthwhile considering the multiplier effect: The simple principal is that if you have any investment in an area it will stimulate further investment. For example a new car plant in an area is likely to encourage linked industries to set up. This could simply be the local catering van for the workers or textile industries making seat covers, engineering companies making shock absorbers or a new tyre plant. This gives more people work and therefore a wage that they will be inclined to spend so creating more jobs. The economy continues to grow. Countries in the developed world have benefited significantly from this whilst those in the developing world have not.

36
Environmental 1. Many less developed countries are located on or about the tropics. This means that they are in a situation where they will be prone to hurricanes: These can have a devastating effect on a countrys attempt to develop. Hurricane, which recently hit Central America, put back the development of Honduras by approximately 30 years. Their economy was left in ruin, as it was almost entirely dependent on single crop agriculture – bananas – for the export market. These were destroyed by high winds and flooding.

38
2. The discovery of coal as discussed earlier would also fall into this category.

39
Successes in the developing world
It would be wrong to class the entire developing world as being exactly the same. Differences exist within the countries and between the countries. Two of the significant groups are discussed below:

40
Oil rich nations The 1970’s saw huge increases in the price of oil as Arab countries withheld supply. This meant that any developing country with oil suddenly had a source of great wealth.

42
Those without faced a major disadvantage as they too had to pay the inflated price for fuel.
The consequence for countries with oil was that they could now invest money in trying to alleviate poverty and promote education and health. Many also invested in industries that refined oil adding great value to their export. Additional profits were invested in overseas ventures or loaned to other countries. As a consequence many of these countries found great wealth. The average wage of a person in Kuwait is the highest in the world! (The sheik who controls the country´s oil is one of the richest people in the world taking 50% of all oil profits – this will obviously have some effect on the average income calculations). Kuwait has about 699 people per doctor – the UK has 619. It also has 100% access to clean water and 94% primary school enrolment. (Figure for 1989, from Collins Longman Atlas).
. Kuwait has about 699 people per doctor – the UK has 619. It also has 100% access to clean water and 94% primary school enrolment. (Figure for 1989, from Collins Longman Atlas).")
43
Newly industrialised countries
Newly industrialised countries are those that have recently had substantial growth in their manufacturing output and consequently exports. They include South Korea, Singapore, Taiwan and Hong Kong.

45
Many have followed a similar system
Many have followed a similar system. Firstly the country invests in industries that can produce goods they would normally import and supports these new industries by putting extra taxes on imported goods to make them un-competitive. Then when these industries are established they look to replicate many of the products in the world export market. They concentrate on high technology industries, first mimicking existing products then improving them. Their economy typically grows by about 6-8% a year. South Korea, for example, took advantage of its links with the USA. The USA, Japan and Europe provided the country with significant aid payments that it invested in iron, steel, shipbuilding, textiles and chemicals so it no longer had to import these. It also imported raw cotton and developed a textile industry. Once these were all established it invested in industries that would export products such as computers, televisions and microwaves. As a consequence, South Korea has full primary school enrolment and a growing GDP. In 1989, it was $4081 per person. (Collins Longman Atlas).
.")
Similar presentations


 GNP- Refers to the total value of all goods and services produced by a country.>")
 / Emerging Market Economies / Third World countries.>")


 World Bank Currency: Renminbi Gross domestic product:>")


