Download presentation
Presentation is loading. Please wait.

1
What’s a Concept map?

2
Example: Photosynthesis Terms: solar energy, food energy, CO 2, H 2 O, O 2, green plants solar energy green plants CO 2 H2OH2O glucose + O 2 food energy

3
Concept Map: Objective: to help see the link between terms and ideas learned in class Terms: simple carb, fiber, fructose, added sugar, glucose, complex carb, natural sugar, sucrose, glycogen, lactose, starch, grains, honey, plain yogurt, pears, liver and muscle stores. Practice: Draw a diagram logically linking all of the terms. carbohydrates

4
Concept Map: Objective: to help see the link between terms and ideas learned in class Terms: simple carb, fiber, fructose, added sugar, glucose, complex carb, natural sugar, sucrose, glycogen, lactose, starch, grains, honey, plain yogurt, pears, liver and muscle stores. NOW add blood sugar Practice: Draw a diagram logically linking all of the terms. carbohydrates

5
Blood Sugar Lows and Highs

6
Tools for Control-Overview Insulin (I) Protein based, pancreas produced hormone Attaches to cells-Allows glucose inside cell Result blood glucose (sugar) level decreases Glucagon (G) raises blood sugar level (BSL) Goal BSL ~80-100 mg % Too high or too low= TROUBLE
 Protein based, pancreas produced hormone Attaches to cells-Allows glucose inside cell Result blood glucose (sugar) level decreases Glucagon (G) raises blood sugar level (BSL) Goal BSL ~ mg % Too high or too low= TROUBLE")
7
dizzy, confused sweaty, rapid heart rate grouchy, anxious To: TREAT ACUTE SYMPTOMS: simple carb (sugars) To: PREVENT SYPTOMS: restrict simple carb (sugars) Low blood sugar
 To: PREVENT SYPTOMS: restrict simple carb (sugars) Low blood sugar")
8
Hypoglycemia (Low BSL) Acute danger but uncommon condition RBC’s and brain need glucose 24/7 Basic Cause: I:G out of balance low BSL Prevention (different than treatment) No meal skipping Include healthy complex carb/protein at meals Limit simple and avoid ‘added’ sugar Focus naturally high fiber foods
 Acute danger but uncommon condition RBC’s and brain need glucose 24/7 Basic Cause: I:G out of balance low BSL Prevention (different than treatment) No meal skipping Include healthy complex carb/protein at meals Limit simple and avoid ‘added’ sugar Focus naturally high fiber foods")
9
What happens….??? >126 mg%

10
Diabetes Projections: 2000 to 2030

11
Diabetes Mellitus (DM) Hyperglycemia (high fasting BSL) Cause: not enough or ineffective Insulin Not caused by consuming too much sugar! Result: too much sugar in blood-not enough in cell Consequence: cells/tissues are glucose starved chronic inflammation occurs blood lipids, blood pressure rise, arteries harden tissue/cell function declines

12
DM: A chronic, progressive disease Common consequences Vascular disease (#1 cause-diabetic deaths) Blindness Amputations Kidney disease
 Blindness Amputations Kidney disease")
13
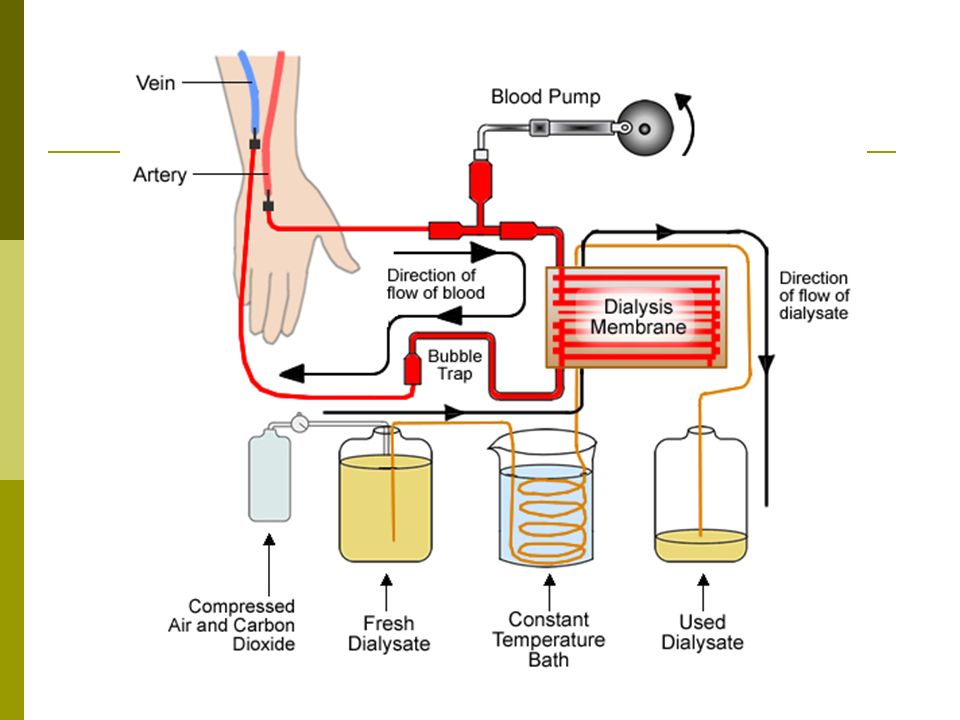
Renal Dialysis

15
Classifications of Diabetes Type I pancreas fails to make insulin early onset in life Rx: requires insulin. Monitor diet, regular exercise.

16
Classifications of Diabetes Type 2 90-95% of all cases Insulin is ineffective Most adult DM Increasingly common in kids Treatment: Medical pills/injections Lifestyle diet/exercise/stress mgt.

17
Self-Check BSL Helps gauge day to day management success Fasting BSL ✓ morning, bedtime and/or exercise Long term ✓ of BSL = hemoglobin A1C

18
Achieve a healthy weight Quit smoking Daily exercise Trickle in healthy carbs over the day No meal skipping Foods/beverages without added sugar Replace saturated (animal) with unsat (plant) fats Monitor BSL Check List: Managing BSL
 with unsat (plant) fats Monitor BSL Check List: Managing BSL")
19
Concept Map: Terms: blood sugar (glucose), hyperglycemia, hypoglycemia, glucagon, insulin, type 1 diabetes, type 2 diabetes, ineffective insulin, inadequate insulin Draw a diagram logically linking all of the terms. Blood Sugar Level

20
Optional slides

21
Blood Sugar Level Hyperglycemia Hypoglycemia Glucagon released Inadequate Insulin Ineffective insulin DM Type 1DM Type 2 Release liver glycogen Blood glucose Concept Map: Controlling BSL Insulin released Blood glucose

22
insulin deficiency Too much sugar in blood vessels (hyperglycemia) vessel damage heart nerves retina blindnes s heart attack gangrene amputation kidneys can’t handle excess sugar kidney failure kidney transplant dialysis cells can’t absorb sugar ketones build up blood becomes acidic glycosuria polyuria polydipsia dehydration shock coma death Concept Map of Diabetes cells no longer sensitive to insulin No insulin (not enough) cells burn fat and protein only 1 Not enough sugar IN cells kidneys heart disease retinal damage Neuro- pathy numbness 2 3 4 5 6 1 2
 vessel damage heart nerves retina blindnes s heart attack gangrene amputation kidneys can’t handle excess sugar kidney failure kidney transplant dialysis cells can’t absorb sugar ketones build up blood becomes acidic glycosuria polyuria polydipsia dehydration shock coma death Concept Map of Diabetes cells no longer sensitive to insulin No insulin (not enough) cells burn fat and protein only 1 Not enough sugar IN cells kidneys heart disease retinal damage Neuro- pathy numbness")
23
Key Terms Hemoglobin A1c (A1c) Measures percentage of hemoglobin proteins in red blood cells that are attached to glucose. Higher blood glucose levels are, the more glucose attaches to hemoglobin. Once glucose binds with hemoglobin, molecule has 120 day lifespan of hemoglobin A1c represents blood glucose levels over 2-3 months.

24
Reduce Risk Type 2 Diabetes People with prediabetes reduced their risk of type 2 diabetes by: Weight loss (~7% of body weight) Exercise (150 minutes/week) Diet rich in whole-grains and fiber Coffee (1-4 cups/day) and moderate alcohol (1-2 drinks/day) Adequate vitamin D status supports insulin production by the pancreas
 Exercise (150 minutes/week) Diet rich in whole-grains and fiber Coffee (1-4 cups/day) and moderate alcohol (1-2 drinks/day) Adequate vitamin D status supports insulin production by the pancreas")
25
Type 1 Diabetes Type 1 diabetes is an autoimmune disease that produces an insulin deficiency 5 – 10% of diabetes Develops when the immune system destroys insulin-producing beta cells in the pancreas Triggered by medications or viral infection in genetically susceptible people

26
Correlation Cause and Effect A and B often happen together when the doorbell rings the cat hides maybe the cat hides because the loud bell makes the dog bark and this makes the cat hide A B A causes B to happen when my dog hears a loud bell, she barks

27
Vitamin D Status and DM 1 ??? Vit D intake and risk of DM1: a birth cohort study Lancet 2001 Nov 3:358 12055 infants followed from 1966-1996 Infants given 2000 IU Vit D regularly decreased incidence of DM 78% at 30 yr marker Study only suggests Vit D prevents DM 1

28
Vitamin D Status and DM 2 ??? Insulin Sensitivity measured in 126 college students Low Vit D (<20ng/ml) poor beta cell function Increase Vit D (to 30ng/ml) 60% improved Insulin sensitivity (decrease DM risk) Am Jour Clin Nutrition 2004 Study only suggests Vit D prevents DM2
 poor beta cell function Increase Vit D (to 30ng/ml) 60% improved Insulin sensitivity (decrease DM risk) Am Jour Clin Nutrition 2004 Study only suggests Vit D prevents DM2.")
Similar presentations

 vessel damage heart nerves retina blindness heart attack gangrene amputation kidneys.>")


 bring them back to life on this planet! Scientists.>")


