Download presentation
Presentation is loading. Please wait.

1
Prediabetes Carol H. Wysham, MD

4
What is Diabetes? Normally, blood sugar (glucose) levels are kept in the normal range by the release of insulin from the islet cells of the pancreas Insulin helps glucose enter the cells. Diabetes occurs when the body doesn’t produce enough insulin or the body can’t use it properly. This results in sugar (glucose) building up within the bloodstream Diagnosed by blood test Fasting glucose > 125mg/dl Random blood glucose > 200mg/dl
 building up within the bloodstream. Diagnosed by blood test. Fasting glucose > 125mg/dl. Random blood glucose > 200mg/dl.")
5
Body lacks insulin or is unable to use insulin effectively
Diabetes Body lacks insulin or is unable to use insulin effectively With diabetes the body either does not produce enough insulin and/or it cannot use insulin effectively. As a result, sugar cannot get into the cells. This, in turn, causes blood glucose levels to rise, which can lead to immediate and long-term complications. Pancreas Cannot Produce Enough Insulin Muscle and Fat Cells Cannot Use Insulin Effectively

6
How Food is Digested 1. Food enters stomach
5. Insulin unlocks receptors 4. Pancreas releases insulin 2. Food is converted into glucose 3. Glucose enters bloodstream 6. Glucose enters cell

7
What Causes Diabetes Type 1 Diabetes is caused by an activation of the immune system that causes destruction of the insulin producing cells (islet cells) in the pancreas. Type 2 Diabetes is caused by two conditions: Insulin resistance: an inherited problem where the body needs more insulin to process sugar. Insulin resistance worsens with increased weight. Insulin deficiency: the islet cells of the pancreas are unable to make enough insulin to overcome the resistance.
 in the pancreas. Type 2 Diabetes is caused by two conditions: Insulin resistance: an inherited problem where the body needs more insulin to process sugar. Insulin resistance worsens with increased weight. Insulin deficiency: the islet cells of the pancreas are unable to make enough insulin to overcome the resistance.")
8
Diabetes: 17 Million and Climbing
Estimated 11 million diagnosed million undiagnosed Type 2 diabetes accounts for 95% of cases Over 2,200 new cases are diagnosed each day 12 +60% +17% 8 Diagnosed Cases (Millions) The American Diabetes Association estimates that nearly 16 million Americans — or 5.9% of the population — have diabetes. It is estimated that approximately 10.3 million people have been diagnosed with this disease, while another 5.4 million remain unaware of their disease. Each year, almost 800,000 new cases are diagnosed. Of these, the vast majority (90-95%) have type 2 diabetes. According to the American Diabetes Association, “Type 2 diabetes is nearing epidemic proportions, due to an increased number of older Americans, and a greater prevalence of obesity and sedentary lifestyles.” As might be expected from the sheer numbers of people with diabetes, the direct and indirect costs of diabetes are staggering. In 1997, the annual economic burden of diabetes was estimated at $98 billion. American Diabetes Association. Diabetes Facts and Figures American Diabetes Association. From Centers for Disease Control and Prevention, Diabetes: a serious public health problem. At-a-glance Atlanta, GA: Centers for Disease Control and Prevention; 2000. 4 1980 1990 2000 (Estimated) From Centers for Disease Control and Prevention, 2000.
 The American Diabetes Association estimates that nearly 16 million Americans — or 5.9% of the population — have diabetes. It is estimated that approximately 10.3 million people have been diagnosed with this disease, while another 5.4 million remain unaware of their disease. Each year, almost 800,000 new cases are diagnosed. Of these, the vast majority (90-95%) have type 2 diabetes. According to the American Diabetes Association, Type 2 diabetes is nearing epidemic proportions, due to an increased number of older Americans, and a greater prevalence of obesity and sedentary lifestyles. As might be expected from the sheer numbers of people with diabetes, the direct and indirect costs of diabetes are staggering. In 1997, the annual economic burden of diabetes was estimated at $98 billion. American Diabetes Association. Diabetes Facts and Figures American Diabetes. Association. From Centers for Disease Control and Prevention, Diabetes: a serious public health problem. At-a-glance Atlanta, GA: Centers for Disease Control and Prevention; (Estimated) From Centers for Disease Control and Prevention,")
9
Residual Lifetime Risk of Diabetes (%)
Baseline Age, y Male Female 32.8 38.5 10 32.1 37.9 20 31.9 37.3 30 31.3 35.7 40 29.5 32.6 50 25.5 28.2 60 18.9 22.4 70 11.2 14.6 80 5.2 6.9 Narayan KMV et al JAMA 290: 1884, 2003

10
NHANES: Diabetes Prevalence by Age
% Age, in years Source: CDC

11
The Prevalence of Diabetes and Obesity
Prevalence of obesity, increased by 61% since 1991 65% of US adults are overweight BMI and weight gain major risk factors for diabetes Mean body weight $ spent on fast food (110) Prevalence (%) kg The Behavioral Risk Factor Surveillance System (BRFSS) is a cross-sectional random-digit telephone survey conducted by the CDC and state health departments. In 2000, 184,450 adults (age 18 years and older) were surveyed. According to the BRFSS data, the prevalence of diabetes increased by 49% in the period from 1990 through 2000, from 4.9%-7.3%. During the same period, the average self-reported weight increased from kg. The prevalence of obesity (BMI >30 kg/m2, calculated from self-reported weight and height) increased from 12% in 1991 to 19.8% in 2000. BMI is one of the strongest predictors of diabetes. In a national sample of adults, every 1-kg increase in measured weight was associated with a 4.5% increase in risk for diabetes. According to analyses from BRFSS, in which weight was self-reported, every 1-kg increase in average weight is associated with a 9% increase in the prevalence of diabetes. Both diabetes and obesity are preventable through improved diet and increased physical activity. Despite proven benefits of weight loss and previous appeals to physicians to become more involved in weight counseling, only 43% of obese adults were advised to lose weight during regular checkups. In 2000, most BRFSS participants (74%) were trying to lose or maintain weight. However, only 17.5% of those were following the recommendations to eat fewer calories and increase physical activity. The prevalence of obesity and diabetes has been increasing over the past decade despite calls to action. Weight loss, increased activity, and healthy eating can prevent onset of diabetes, but seem to be difficult to achieve in general population. More aggressive public education or alternative approaches are needed to stem the epidemic of diabetes. Mokdad AH, Ford ES, Bowman BA, et al. Diabetes trends in the U.S.: Diabetes Care. 2000;23: Mokdad AH, Serdula MK, Dietz WH, et al. The spread of the obesity epidemic in the United States, JAMA. 1999;282: Mokdad AH, Bowman BA, Ford ES, et al. The continuing epidemics of obesity and diabetes in the United States. JAMA. 2001;286: (70) Year
 Prevalence (%) kg. The Behavioral Risk Factor Surveillance System (BRFSS) is a cross-sectional random-digit telephone survey conducted by the CDC and state health departments. In 2000, 184,450 adults (age 18 years and older) were surveyed. According to the BRFSS data, the prevalence of diabetes increased by 49% in the period from 1990 through 2000, from 4.9%-7.3%. During the same period, the average self-reported weight increased from kg. The prevalence of obesity (BMI >30 kg/m2, calculated from self-reported weight and height) increased from 12% in 1991 to 19.8% in BMI is one of the strongest predictors of diabetes. In a national sample of adults, every 1-kg increase in measured weight was associated with a 4.5% increase in risk for diabetes. According to analyses from BRFSS, in which weight was self-reported, every 1-kg increase in average weight is associated with a 9% increase in the prevalence of diabetes. Both diabetes and obesity are preventable through improved diet and increased physical activity. Despite proven benefits of weight loss and previous appeals to physicians to become more involved in weight counseling, only 43% of obese adults were advised to lose weight during regular checkups. In 2000, most BRFSS participants (74%) were trying to lose or maintain weight. However, only 17.5% of those were following the recommendations to eat fewer calories and increase physical activity. The prevalence of obesity and diabetes has been increasing over the past decade despite calls to action. Weight loss, increased activity, and healthy eating can prevent onset of diabetes, but seem to be difficult to achieve in general population. More aggressive public education or alternative approaches are needed to stem the epidemic of diabetes. Mokdad AH, Ford ES, Bowman BA, et al. Diabetes trends in the U.S.: Diabetes Care. 2000;23: Mokdad AH, Serdula MK, Dietz WH, et al. The spread of the obesity epidemic in the United States, JAMA. 1999;282: Mokdad AH, Bowman BA, Ford ES, et al. The continuing epidemics of obesity and diabetes in the United States. JAMA. 2001;286: (70) Year.")
12
Quartiles of MET - hours per week
The Less You Exercise and the More You Watch TV, the Chances of Getting Diabetes Will Be Significantly Increased! 3.0 2.5 2.0 RR 1.5 1.0 <10.0 0.5 >15.0 Quartiles of MET - hours per week 46.0 Quartiles of no. of hours watching TV per week 3.5 Hu et al. Arch Intern Med. 2001;161:1542.

13
The Evolution of Man: The Thrifty Gene Hypothesis
Not too long ago we were hunters and gatherers doing physical labor for our daily existence

14
Why is Diabetes More Common?
+ + = Childhood obesity doubled from 1980 to 1994, reaching 24% in overweight and 11% in the obese category. Over the past 20 years, fast food consumption has increased to acount for >40% of income spent on food, with 25% of daily calorie intake among children being from snacks. The size of a typical coca cola and french fry serving has tripled over the past 20 yrs. Annual per capital consumption of soft drinks increased from 27 gallons in l972 to 44 gallons in l992. In the Netherlands, 30% of all trips are made by bicycle, whereas in the US, 1% are made by bicycle. Daily participation in PE decreased from 45 to 33% in HS boys and 38 to 30% in girls. TV viewing increased from 2 h/d in 1970 to 4.8 h/d in 1990 with 34% watching > 5 h.

16
You would not believe the increase in diabetes in Japan and other developed countries around the world

17
Risk Factors for the Development of Type 2 Diabetes
Family history of diabetes Obesity Especially central Hypertension High triglycerides Low HDL-C Elevated glucose Ethnicity other than Caucasian Vascular disease History of gestational diabetes History of baby weighing > 9 lbs Sedentary lifestyle Schizophrenia

18
Type 1 and Type 2 Diabetes: Heredity
4%-8% in offspring 30%-50% in offspring

20
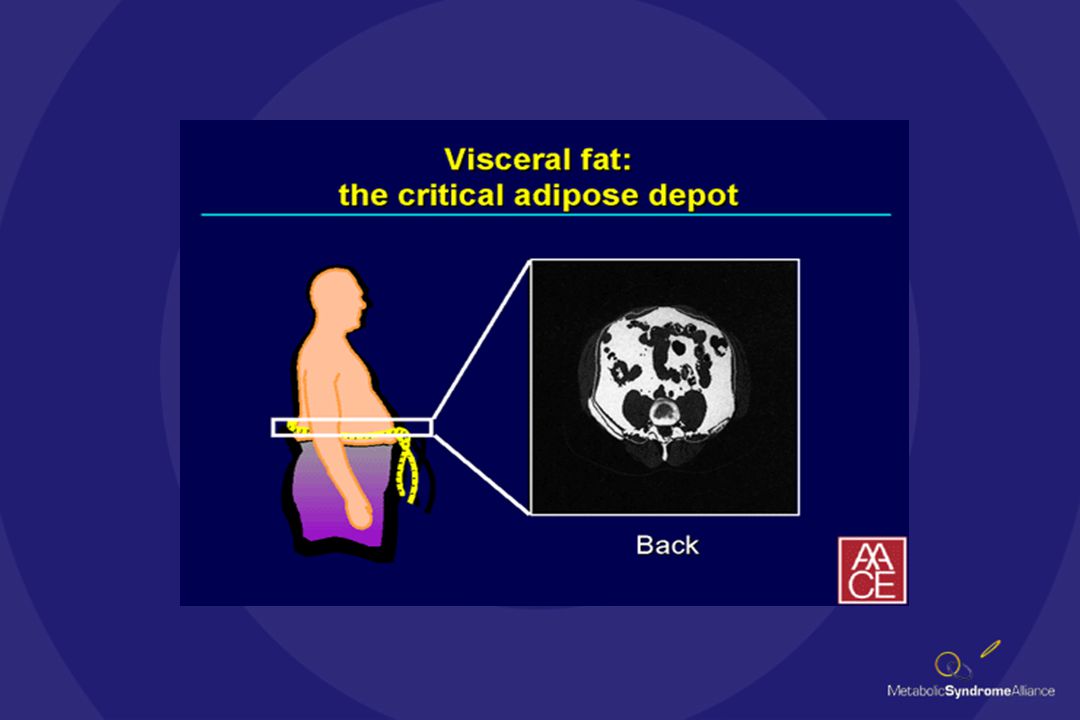
Patterns of Body Fat Distribution
Abdominal Lower body (android) (gynoid) Just a few words about obesity. There are basically two varieties, gynecoid or female pattern obesity in the lower body and arms and male pattern or android obesity. They have dramatically different effects on the metabolic syndrome and the predisposition to it.
 (gynoid) Just a few words about obesity. There are basically two varieties, gynecoid or female pattern obesity in the lower body and arms and male pattern or android obesity. They have dramatically different effects on the metabolic syndrome and the predisposition to it.")
21
Acanthosis Nigricans

22
Why Do We Worry About Diabetes?
Association with debilitating complications Preventable with aggressive treatment High cost of care Mostly due to costs of caring for complications Diabetes can be prevented

23
Complications of Diabetes
Stroke: 2-6x End-Stage Kidney Disease: 17x Retinopathy: 25x With both type 1 and type 2 diabetes, high blood sugar levels can cause complications over time. Heart Disease and Stroke. People with diabetes are 2 to 4 times more likely to have heart disease which is present in 75 percent of diabetes-related deaths (more than 77,000 deaths due to heart disease annually). They are 2 to 4 times more likely to suffer a stroke. Blindness. Diabetes is the leading cause of new cases of blindness in people ages Each year, from 12,000 to 24,000 people lose their sight because of diabetes. Kidney Disease. Diabetes is the leading cause of end-stage renal disease, accounting for about 40% of new cases. Nerve Disease and Amputations. 60-70 percent of people with diabetes have mild to severe forms of diabetic nerve damage, which, in severe forms, can lead to lower limb amputations. Diabetes is the most frequent cause of non-traumatic lower limb amputations. The risk of a leg amputation is times greater for a person with diabetes. Each year, more than 56,000 amputations are performed among people with diabetes. So whether you have type 1 or type 2 diabetes, it`s vital for patients to control their blood sugar. Tighter control with newer medications and therapies can reduce these conditions. Heart Disease: 2-4x Foot/Leg Amputations: 5x
. They are 2 to 4 times more likely to suffer a stroke. Blindness. Diabetes is the leading cause of new cases of blindness in people ages Each year, from 12,000 to 24,000 people lose their sight because of diabetes. Kidney Disease. Diabetes is the leading cause of end-stage renal disease, accounting for about 40% of new cases. Nerve Disease and Amputations percent of people with diabetes have mild to severe forms of diabetic nerve damage, which, in severe forms, can lead to lower limb amputations. Diabetes is the most frequent cause of non-traumatic lower limb amputations. The risk of a leg amputation is times greater for a person with diabetes. Each year, more than 56,000 amputations are performed among people with diabetes. So whether you have type 1 or type 2 diabetes, it`s vital for patients to control their blood sugar. Tighter control with newer medications and therapies can reduce these conditions. Heart Disease: 2-4x. Foot/Leg Amputations: 5x.")
24
United Kingdom Prospective Diabetes Study (UKPDS)
Change in HbA1C Microvascular Complications -1 -2 -3 -4 -5 - 5 -10 -15 -20 -25 At the end of the study, researchers found that for every 1 point reduction in Hemoglobin A1c, patients had a 25 percent reduction in their risk for developing microvascular complications such as eye disease, kidney disease and nerve damage. The UKPDS proved that good diabetes control matters! Achieving good control requires patients to learn some very important numbers that relate to their level of diabetes management. - 0.9% % Change in Rate of Complications - 25% Change in HbA1c 1% Decrease in HbA1c = 25% Decrease in Microvascular Risk!

25
Glucose Metabolism Normal Glucose Metabolism Prediabetes Diabetes

26
Glucose Levels in Normal, Prediabetic and Diabetic Subjects
220 200 180 Diabetes IGT Normoglycaemia 1 2 3 Time following meal (hrs) Harris MI. Diabetes Care 1993, 16: 160 Plasma glucose (mg/dl) 140 120 100
 Harris MI. Diabetes Care 1993, 16: Plasma glucose (mg/dl)")
27
What is Prediabetes?

28
Prevalence of Prediabetes in US Adults aged 45 - 74
All races 22.6% (11.9 million) Non-Hispanic Whites 22.2% (8.9) Non-Hispanic Blacks 18.9% (1.0) Mexican-Americans 27.3% (0.7)
 Non-Hispanic Whites. 22.2% (8.9) Non-Hispanic Blacks. 18.9% (1.0) Mexican-Americans. 27.3% (0.7)")
29
Why Worry About Prediabetes?
Predicts high risk for development of diabetes Predicts high risk for development of atherosclerotic vascular disease Both are largely preventable through lifestyle and pharmacologic interventions

30
Risk of Cardiovascular Disease Is Elevated Prior to Diagnosis of T2DM
% with CVD These are data from the Nurses’ Health Study (NHS), which has followed 121,700 female registered nurses aged 30–55 years since The women received questionnaires every two years. When someone in the study reported a new diagnosis of T2DM, the study looked to see what other medical problems the women had.1 The study found a significantly elevated risk of MI and stroke before the clinical diagnosis of T2DM, as compared with women who remained non-diabetic throughout the study.1 The risk for CVD began to increase at least 15 years before diabetes diagnosis.1 This raises the idea that there is a good chance that when a patient is finally diagnosed with T2DM they may already have extensive CVD. 1. Hu F, Stampfer M, Haffner S, et al. Elevated risk of cardiovascular disease prior to clinical diagnosis of type 2 diabetes. Diabetes Care. 2002;25(7): *MI=myocardial infarction. Adapted from: Hu F, et al. Diabetes Care. 2002;25:
, which has followed 121,700 female registered nurses aged 30–55 years since The women received questionnaires every two years. When someone in the study reported a new diagnosis of T2DM, the study looked to see what other medical problems the women had.1. The study found a significantly elevated risk of MI and stroke before the clinical diagnosis of T2DM, as compared with women who remained non-diabetic throughout the study.1. The risk for CVD began to increase at least 15 years before diabetes diagnosis.1. This raises the idea that there is a good chance that when a patient is finally diagnosed with T2DM they may already have extensive CVD. 1. Hu F, Stampfer M, Haffner S, et al. Elevated risk of cardiovascular disease prior to clinical diagnosis of type 2 diabetes. Diabetes Care. 2002;25(7): *MI=myocardial infarction. Adapted from: Hu F, et al. Diabetes Care. 2002;25:")
31
Prevention of Diabetes

32
(cases/1000 person-years)
The Finnish Diabetes Prevention Study: Lifestyle Modifications (cont’d) 58% (cases/1000 person-years) Incidence of diabetes Tuomilehto et al. N Engl J Med. 2001;344:1343.
 58% (cases/1000 person-years) Incidence of diabetes. Tuomilehto et al. N Engl J Med. 2001;344:1343.")
33
The Finnish Diabetes Prevention Study: Lifestyle Modifications
522 overweight individuals with IGT randomized to Control: diet instruction at the onset of study Individualized advice given 7 times in the first year and every 3 months thereafter with goals of Weight loss 5% Reducing fat intake to <30% of energy consumption Increasing fiber intake to 15 g/1000 kcal Exercising at a moderate level for 30 min/d Primary end point: Prevention of diabetes, as assessed by annual OGTT Tuomilehto et al. N Engl J Med. 2001;344:1343.

34
The Finnish Diabetes Prevention Study: Lifestyle Modifications (cont’d)
Change from baseline P<0.001 P<0.001 P=0.007 P=0.02 Tuomilehto et al. N Engl J Med. 2001;344:1343.

35
FDPS: Incidence of Diabetes By Success Score
Tuomilehto et al. NEJM2001; 344: 1343

36
The Diabetes Prevention Program
A Randomized Clinical Trial to Prevent Type 2 Diabetes in Persons at High Risk Check sponsors (CDCP?). Everyone agree on the subtitle? Sponsored by the NIDDK, NIA, NICHD, NIH, IHS, CDC, ADA, and other agencies and corporations
. Everyone agree on the subtitle Sponsored by the NIDDK, NIA, NICHD, NIH, IHS, CDC, ADA, and other agencies and corporations.")
37
Diabetes Prevention Program: Primary Objectives
Compare safety and efficacy of 4 interventions for preventing or delaying development of diabetes Standard lifestyle recommendations + masked metformin titrated to 850 mg bid or troglitazone 400 mg/d Standard lifestyle recommendations + masked placebo Intensive lifestyle intervention by case managers with goals of 7% weight reduction through healthy eating and physical activity 150 min/wk moderate intensity physical activity The primary study objective of the DPP was to ascertain the effectiveness of 3 interventions for preventing or delaying the development of type 2 diabetes (as diagnosed by 1997 ADA criteria) in high-risk individuals. These included pharmacological interventions and intensive lifestyle modifications supervised by case managers. The pharmacological interventions were selected based on their ability to lower glucose levels with an acceptable safety profile and no effects that would limit adherence or retention. Metformin, added to standard lifestyle recommendations, was the only agent selected that was continued until the end of the study. The metformin treatment was started at 850 mg once daily and increased to 850 mg twice daily at one month. Dosage adjustments were allowed to minimize gastrointestinal symptoms. The intensive lifestyle intervention aimed to encourage healthy eating and increase physical activity such that initial body weight was reduced by at least 7% and energy expenditure was increased by ~700 kcal/week. Aggressive interactive programs were developed to help participants achieve and maintain these goals for the duration of the study. The Diabetes Prevention Program Research Group. Diabetes Care. 1999;22:623.
 in high-risk individuals. These included pharmacological interventions and intensive lifestyle modifications supervised by case managers. The pharmacological interventions were selected based on their ability to lower glucose levels with an acceptable safety profile and no effects that would limit adherence or retention. Metformin, added to standard lifestyle recommendations, was the only agent selected that was continued until the end of the study. The metformin treatment was started at 850 mg once daily and increased to 850 mg twice daily at one month. Dosage adjustments were allowed to minimize gastrointestinal symptoms. The intensive lifestyle intervention aimed to encourage healthy eating and increase physical activity such that initial body weight was reduced by at least 7% and energy expenditure was increased by ~700 kcal/week. Aggressive interactive programs were developed to help participants achieve and maintain these goals for the duration of the study. The Diabetes Prevention Program Research Group. Diabetes Care. 1999;22:623.")
38
Diabetes Prevention Program: Achievement of Study Goals
Average follow-up of 2.8 years Goal % Achieving Goal Lifestyle modifications Week 24 Last visit Weight loss 7% 50% 38% Physical activity 150 74% 58% (min/wk) Pharmacologic intervention Placebo Metformin Compliance 80% 77% 72% Full dose 2 tablets/d 97% 84% The average follow-up was 2.8 years with a range of 1.8 to 4.6 years. Early in the course of the study, 50% of participants in the intensive lifestyle arm achieved the weight loss goal and 74% reached the target level of leisure activity. Compliance with oral medication was better for those individuals receiving placebo than those taking metformin, presumably because of increased gastrointestinal side effects. Among those participants taking metformin, 84% received the full dose; the remainder took 1 tablet/day to limit the incidence of GI symptoms. The Diabetes Prevention Program Research Group. N Engl J Med. 2002;346:393.
 Pharmacologic intervention Placebo Metformin. Compliance 80% 77% 72% Full dose 2 tablets/d 97% 84% The average follow-up was 2.8 years with a range of 1.8 to 4.6 years. Early in the course of the study, 50% of participants in the intensive lifestyle arm achieved the weight loss goal and 74% reached the target level of leisure activity. Compliance with oral medication was better for those individuals receiving placebo than those taking metformin, presumably because of increased gastrointestinal side effects. Among those participants taking metformin, 84% received the full dose; the remainder took 1 tablet/day to limit the incidence of GI symptoms. The Diabetes Prevention Program Research Group. N Engl J Med. 2002;346:393.")
39
Diabetes Prevention Program: Effects on Weight and Dietary Intake
Lifestyle Placebo Metformin Intervention P Value Change in weight (kg) <0.001 Change in fat intake* (% of total calories) <0.001 Change in energy intake (kcal/d) at 1 year <0.001 Over the entire DPP, the average weight loss due to lifestyle intervention was 5.6 kg. This was achieved in part due to reduced fat intake as well as reductions in total caloric intake. *Baseline fat intake was 34.1% of total calories. The goal of intensive lifestyle modification was <25% of total calories. The Diabetes Prevention Program Research Group. N Engl J Med. 2002;346:393.
 < Change in fat intake* (% of total calories) < Change in energy intake. (kcal/d) at 1 year < Over the entire DPP, the average weight loss due to lifestyle intervention was 5.6 kg. This was achieved in part due to reduced fat intake as well as reductions in total caloric intake. *Baseline fat intake was 34.1% of total calories. The goal of intensive lifestyle modification was <25% of total calories. The Diabetes Prevention Program Research Group. N Engl J Med. 2002;346:393.")
40
Diabetes Prevention Program: Progression to Type 2 Diabetes
Average follow-up of 2.8 years 31%* Cases/100 person-years 58%* Compared to placebo, fewer people who took metformin or participated in the lifestyle modification arm developed type 2 diabetes during the DPP. Accordingly, the relative risk of developing type 2 diabetes was reduced by 31% by metformin and by 58% by the intensive lifestyle intervention. Placebo Metformin Intensive lifestyle *All pairwise comparisons significantly different by group; sequential log-rank test. The Diabetes Prevention Program Research Group. N Engl J Med. 2002;346:393.

41
Body lacks insulin or is unable to use insulin effectively
Diabetes Body lacks insulin or is unable to use insulin effectively With diabetes the body either does not produce enough insulin and/or it cannot use insulin effectively. As a result, sugar cannot get into the cells. This, in turn, causes blood glucose levels to rise, which can lead to immediate and long-term complications. Pancreas Cannot Produce Enough Insulin Muscle and Fat Cells Cannot Use Insulin Effectively

42
Prevalence of IR in Selected Metabolic Disorders
Hypertriglyceridemia: 84% Hyperuricemia: 63% IR T2DM: 92% Hypertension: 58% Low HDL cholesterol: 88% This slide shows the prevalence of IR in the specific metabolic disorder involved. When these conditions are clustered together, there is even an increased probability that the individual has IR and is at an increased risk for CVD. These patients need to be viewed not just as having risk factors, but as patients with a global problem: the metabolic syndrome. Those with multiple disorders (diabetes, hypertension, dyslipidemia, and hyperuricemia): 95% Bonora E, et al. Diabetes. 1998;47: Haffner SM, et al. Am J Med. 1997;103:
: 95% Bonora E, et al. Diabetes. 1998;47: Haffner SM, et al. Am J Med. 1997;103:")
43
Who Is Insulin Resistant?
30% of the U.S. population, age 40–74 years 60% of all patients with CVD 50% of patients with confirmed coronary heart disease (CHD) and no prior history of diabetes 92% of patients with T2DM NHANES II and III (1988–1994) data demonstrated that 1/3 of the U.S. population age 40–74 years are insulin resistant.1 1. Harris MI, Flegal KM, Cowie CC, Eberhardt MS, Goldstein DE, Little RR, Wiedmeyer HM, Byrd-Holt DD. Prevalence of diabetes, impaired fasting glucose, and impaired glucose tolerance in U.S. adults. The Third National Health and Nutrition Examination Survey, Diabetes Care. 1998;21(4): Harris M, et al. Diabetes Care. 1998;21(4): Haffner SM, et al. Circulation. 2000;101: Kowalska I, et al. Diabetes Care. 2001;24(5): Haffner SM, et al. Am J Med. 1997;103:
 and no prior history of diabetes. 92% of patients with T2DM. NHANES II and III (1988–1994) data demonstrated that 1/3 of the U.S. population age 40–74 years are insulin resistant Harris MI, Flegal KM, Cowie CC, Eberhardt MS, Goldstein DE, Little RR, Wiedmeyer HM, Byrd-Holt DD. Prevalence of diabetes, impaired fasting glucose, and impaired glucose tolerance in U.S. adults. The Third National Health and Nutrition Examination Survey, Diabetes Care. 1998;21(4): Harris M, et al. Diabetes Care. 1998;21(4): Haffner SM, et al. Circulation. 2000;101: Kowalska I, et al. Diabetes Care. 2001;24(5): Haffner SM, et al. Am J Med. 1997;103:")
44
How to Detect Insulin Resistance
Those with any of the manifestations of the metabolic syndrome: Increased waist circumference Hypertension Hypertriglyceridemia Low HDL-C Atherosclerosis Impaired glucose tolerance Childhood obesity doubled from 1980 to 1994, reaching 24% in overweight and 11% in the obese category. Over the past 20 years, fast food consumption has increased to acount for >40% of income spent on food, with 25% of daily calorie intake among children being from snacks. The size of a typical coca cola and french fry serving has tripled over the past 20 yrs. Annual per capital consumption of soft drinks increased from 27 gallons in l972 to 44 gallons in l992. In the Netherlands, 30% of all trips are made by bicycle, whereas in the US, 1% are made by bicycle. Daily participation in PE decreased from 45 to 33% in HS boys and 38 to 30% in girls. TV viewing increased from 2 h/d in 1970 to 4.8 h/d in 1990 with 34% watching > 5 h.

45
Interrelation Between Atherosclerosis and Insulin Resistance
Hypertension Obesity Hyperinsulinemia Diabetes Dyslipidemia Small, dense LDL Inflammation Hypercoagulability Insulin Resistance Atherosclerosis Interrelation Between Atherosclerosis and Insulin Resistance Insulin resistance is associated with a panoply of abnormalities, including hypertension, hyperinsulinemia, hypertriglyceridemia with small, dense low-density lipoprotein (LDL) and low high-density lipoprotein (HDL), and hypercoagulability. Of course, insulin resistance is a major risk factor for the development of diabetes. Obesity plays a role both in exacerbating insulin resistance and as an independent risk factor for atherosclerosis. Therefore, any patient with insulin resistance has numerous reasons to be at very high risk for atherosclerosis.
 and low high-density lipoprotein (HDL), and hypercoagulability. Of course, insulin resistance is a major risk factor for the development of diabetes. Obesity plays a role both in exacerbating insulin resistance and as an independent risk factor for atherosclerosis. Therefore, any patient with insulin resistance has numerous reasons to be at very high risk for atherosclerosis.")
46
Biological Functions of the Adipocyte
Inert Storage Depot Secretory/Endocrine Gland Fatty Acids Glucose Leptin Fed ANS Leptin, FFA, TNF, IL-6, Adiponectin, Resistin, Angiotensinogen PAI-1, Other Fasted Fatty Acids Glycerol Insulin Kahn B, Flier J. J Clin Invest. 106:

48
Steps in the Development of Diabetes
Defect in mitochondrial fat oxidation Excess energy intake Increase fat in fat cell, muscle and liver Insulin Resistance Release of FFA and inflammatory markers from fat cell Death of islet cell Diabetes Mellitus

49
Screening for Diabetes and Prediabetes
Screen every adult > 40 years of age < 100 > 125 Diabetes Normal Prediabetes

50
What Can You Do to Prevent Diabetes?
If over 40, get screened with a fasting glucose level. If high risk or if glucose levels are over 100 mg/dl, start making lifestyle changes to improve diet and exercise. Talk with your health care provider about other cardiovascular risk factors

52
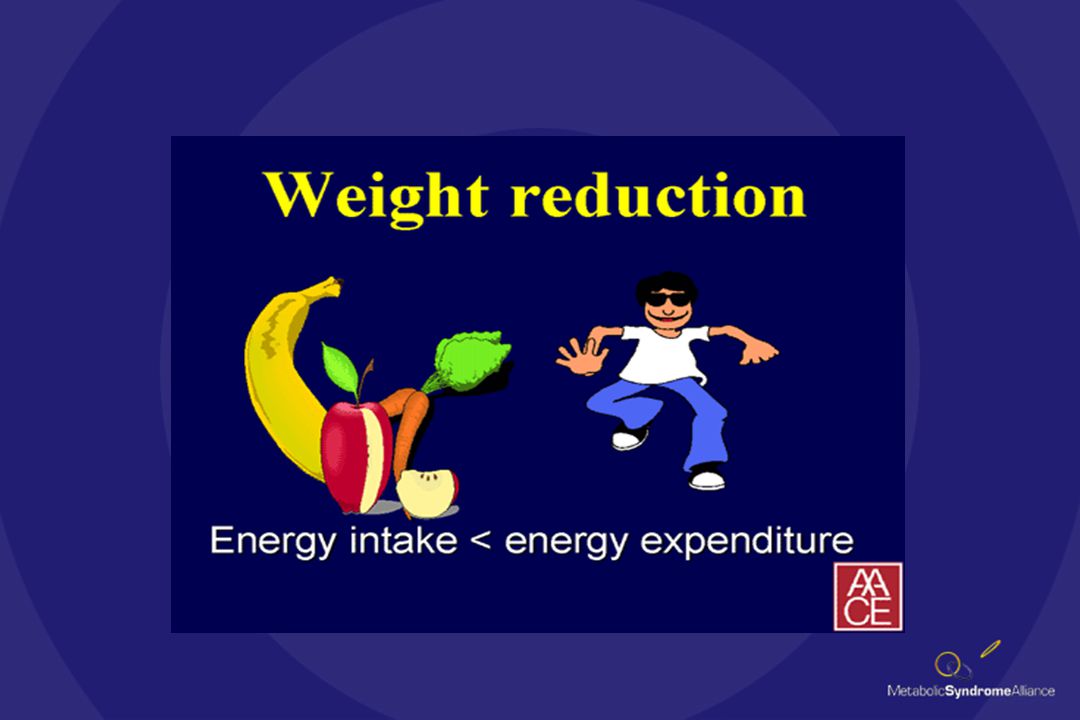
Health Physical Activity + Sound Nutrition Good Health
The basic idea concerning good health is: (click) Physical Activity, such as running Plus Sound Nutrition, such as fruits and grains Equal Good Health
 Physical Activity, such as running. Plus Sound Nutrition, such as fruits and grains. Equal Good Health.")
53
Health The first part of our equation is activity
Get moving, find something you enjoy Now that you know why being healthy is a good idea, lets discuss what you can do to get that way. (click) The first part of our equation, activity, is key. This includes active play and sports. Just get moving with something you enjoy! Ask students What do you like to do? Facilitate responses Do you always make time for activities? (click after all pictures have appeared)
 The first part of our equation, activity, is key. This includes active play and sports. Just get moving with something you enjoy! Ask students. What do you like to do Facilitate responses. Do you always make time for activities (click after all pictures have appeared)")
55
Physical Activity Pyramid
The best way to stay fit is to create a lifestyle around it. This activity pyramid can help you get on the right track. First, cut down on watching TV and computer games. Then, enjoy leisure activities, like bowling and canoeing, and stretching activities, like yoga or dance, two to three times a week. Also, participate in aerobic exercise and recreational sports, such as riding your bike or playing flag football, three to five times a week Finally, incorporate exercise in your everyday life by walking the dog walking to the mail box taking the stairs (click)
")
56
Prescription pad Prescription pad
Now that you have a better understanding, here is your prescription for fitness. Being active just an hour a day everyday is a great way to a healthier you. (click)
")
57
Activities Log Week # Activity # of Minutes Mon Tue Wed Thu Fri Sat
Sun Participant’s signature: Date: A great way to measure the activities part of your fitness goal is to use this graph called an activities log. Keep track of every active thing you do throughout the week. This includes not only sporting activities like basketball and tennis, but anything that gets your body moving. That means you can list chores like taking out the garbage and cleaning your room, as well as fun things like riding your bike and skateboarding. (click)
")
58
Health The second part of the equation is nutrition
Your body needs the right fuel to help it work well. The second part of the equation is nutrition. Your body needs the right fuel to help it work well. Make healthy choices for meals and snacks at home and school. Pack your own lunch and snacks. Avoid high fat and high sugar. Let’s name some foods that have lots of fat and/ or sugar. (click after all pizza appears)
")
61
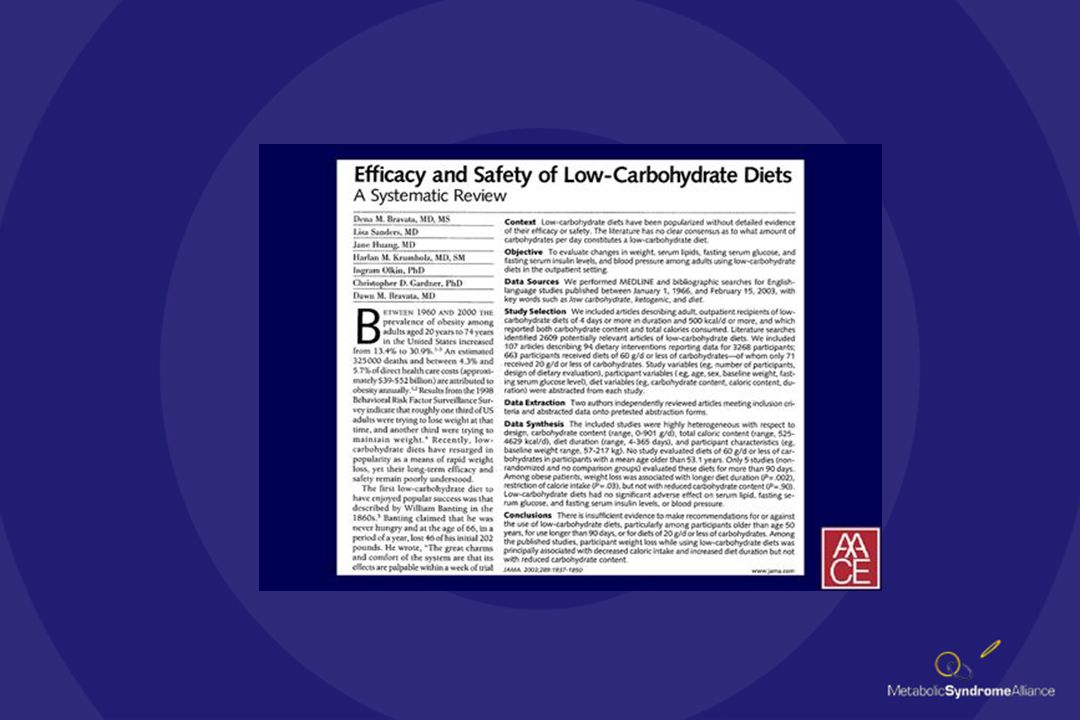
23 subjects with vascular disease were treated with diet low in starch
and high in saturated fat. After 6 weeks, subjects lost 5% of body weight. Lipids were slightly improved, but homocysteine and CRP both increased

63
Food Pyramid Here is the food pyramid, which is a great guide to help you choose healthy foods. Ask students What are some good foods to eat? (Possible responses: fruits, vegetables, chicken, whole-grain breads, milk, yogurt) What are some foods that you should avoid? (Possible responses: cheeseburgers, tacos, donuts, milk shakes, French fries,) (click)
 What are some foods that you should avoid (Possible responses: cheeseburgers, tacos, donuts, milk shakes, French fries,) (click)")
64
Management of Obesity: Treatment Options
Modality Recommendation Reduced-calorie diet Reduce energy intake by 500 to 1,000 kcal/day to achieve a weight loss of 1 to 2 lbs/week over a 6-month period Start with 30 to 45 minutes moderate activity 3 to 5 days/week, and work up to at least 30 minutes moderate-intensity physical activity on most or all days/week Use multiple behavioral strategies (eg, self-monitoring of eating habits and physical activity) Recommend appropriate pharmacotherapy* for patients with BMI 30 kg/m2, or with BMI 27 kg/m2 with one or more comorbid conditions Consider for patients with class 3 obesity, or class 2 obesity with comorbid conditions, for whom other treatments have failed Increased activity Behavior modification Pharmacotherapy Surgery *In combination with diet, increased activity, and behavior modification. (NIH. Obes Res. 1998)
 Recommend appropriate pharmacotherapy* for patients with BMI 30 kg/m2, or with BMI 27 kg/m2 with one or more comorbid conditions. Consider for patients with class 3 obesity, or class 2 obesity with comorbid conditions, for whom other treatments have failed. Increased activity. Behavior modification. Pharmacotherapy. Surgery. *In combination with diet, increased activity, and behavior modification. (NIH. Obes Res. 1998)")
65
Gastric Bypass Surgery for Obesity
Improvements in technique and “advertising” has resulted in a resurgence of interest in bariatric surgery for treatment of obesity 1990 – 16,000/year 2003 – 200,000/year

66
Healthy Lifestyle Improves All Cardiovascular Risk
Factors: Glucose BP Cholesterol 30-60 minutes/day Restrict: Calories Salt Simple carbohydrates Animal Fats High fiber, low fat diet – 3 meals/day

67
For Effective Weight Loss
30 – 60 minutes of exercise most days of the week Mixture of cardiovascular and weight training Cut calories by about 30% Do not restrict any one category too severely Have realistic expectations – unusual for people to be able to maintain > 20% weight loss for the long-term.

68
How Can You Help Reduce Your Risk of Diabetes?
Take your medications regularly. If overweight, lose weight. Limit alcohol to 1-2 drinks per day. Adopting a healthy lifestyle is essential in helping reduce your overall risk of heart disease. If you currently take medications for preventing heart disease, their effectiveness will be enhanced by making these healthy lifestyle changes. Physical activity Eat foods low in fat & calories. Stop smoking!

69
What are goals to healthy living? Be SMART
Specific Measurable Achievable Relevant Time Now that you know how important it is to be healthy, it is a smart idea to set some goals for healthy living. Goals should be: (click) Specific-I can explain it simply Measurable- I can measure my progress Achievable-I can accomplish this goal. Relevant-It will lead to the desired outcome Time- The goal has a specific time frame Ask students Let’s talk about goals related to your fitness and your health. What are your goals? (responses)
 Specific-I can explain it simply. Measurable- I can measure my progress. Achievable-I can accomplish this goal. Relevant-It will lead to the desired outcome. Time- The goal has a specific time frame. Ask students. Let’s talk about goals related to your fitness and your health. What are your goals (responses)")
70
www.aace.com www.diabetes.org www.powerofprevention.com
Thank you teachers and students for taking time out from your busy class schedule to learn about the importance of being healthy. Find out how you and your class can join the President’s Challenge. To get started on your fitness goals, check out these websites. They will give you plenty of ideas on how to get started and will help measure your progress as you get healthier and more physically fit. Here is a prescription pad for you to take home so you can get moving to a healthier lifestyle.

Similar presentations


![LIFESTYLE MODIFICATIONS FOR PREVENTING HEART DISEASE [e.g. HEART ATTACKS] [ primary prevention of coronary artery disease ] DR S. SAHAI MD [Med.], DM [Card]](/19/5810187/big_thumb.jpg "LIFESTYLE MODIFICATIONS FOR PREVENTING HEART DISEASE [e.g. HEART ATTACKS] [ primary prevention of coronary artery disease ] DR S. SAHAI MD [Med.], DM [Card]>")

 By: Wandaye Deressa,>")