Download presentation
Presentation is loading. Please wait.

1
The Changing Nature of Student Demographics in Ontario DIALOGUE May 15, 2008 R. Tiffin, Vice-President Students

2
Session Outline World Picture Canada/Ontario Perspective Ontario Projections Implications for Ontario Post-Secondary Institutions What are the consequences of the shift from natural increase to immigration as the source of population growth?

3
Sources Can Immigration compensate for below- replacement fertility?: The consequences of the unbalanced settlement of immigrants in Canadian cities 2001 – 2051 Dr. Deborah Drake Matthews Minister Responsible for Women’s Issues Minister of Children and Youth Services StatsCan The Challenge of the Rural Poor, Interim Report of the Senate Standing Committee on Agriculture and Forestry, December 2006

4
Population Trends Past population declines were temporary Low fertility rates combined with the lowest levels of mortality in human history Economically developed countries will experience aging and population decline Poorest countries will experience continued rapid population growth

5
Fertility Rate World Map

6
The Consequences Unequal population distribution Social and Economic adjustments - pensions, healthcare, political imbalance - Cottbus Geopolitical implications

7
Examples Europe’s share of the global population: 1925 - 25% 1975 – 17% 2050 – 7% Russia 10 times the size of Yemen in 2000 Equal size in 2050, Yemen growing and Russia aging Last 3.5 billion in N.A., former Soviet Union, China, Southeast Asia and Latin America Next 3.5 billion in sub-Saharan Africa and parts of Asia

8
Causes and Responses Increased life expectancy family breakdown pensions not children increased social mobility changing role of women in society economic fears Increase labour force participation of older workers and women reform pension plans and eligibility tax revisions to assist families lower housing costs enhanced childcare support

9
The U.S. Difference TFR 2.0 Teenage fertility rates double those of industrialized nations Similar for white and non-white populations – hispanics a factor Higher rates of marriage and earlier Higher unplanned pregnancies, births and abortions Greater access to more effective forms of birth control and socialized health care in Canada

10
U.S. College/University Trends Baby boom echo peaks in 2008 – 3.34 m. high school grads 2015+ – Hispanic and Asian student populations caucasian students decline – from 1.9 to 1.59 mill in 2022 growth primarily in families with no prior college history Hispanic growth in Texas and southern U.S. admissions challenge – plan for demographic changes

11
Canada - Total Fertility Rate, 1953 - 2006 Replacement Rate 2.1%

12
Total Fertility Rate By Province - 2003

13
Outlook for Canada Under current immigration levels, only 10 of Canada’s 26 largest cities are projected to grow through to 2051, and 12 will be smaller in 2051 than in 2001. Cities with high levels of in-migration are projected to more than double in size.

14
Circle of Declining Rural Regions

15
Immigration Patterns Canada attracts significantly more immigrants on a per capita basis than most other countries in the developed world. 1960’s – southern Europe and UK 1970’s/80’s – Asia, Central and S.A., Eastern Europe and Middle East 1990’s – China and Hong Kong 2004 – China and India

16
Impact of Immigration on Population Growth 1940 – 49 – 8% 1950 – 1989 – 20 – 30% 1990 – 99 – 60% Going forward – 100%

17
Settlement Patterns Immigrants from all regions tend to be increasingly attracted to Toronto Immigrants from Africa are more concentrated in Montreal 63% of immigrants from South Asia settle in Toronto Vancouver – Eastern Asia Strong relationship between the size of an existing immigrant community and the settlement of new immigrants - Proximity of friends and family is the primary determinant Urbanization 1981 – 58% in Toronto, Montreal or Vancouver 2001 – 74% in these cities

18
Attracters of Recent Immigrants (1998 – 2001), as % of population
, as % of population")
19
Government Response to Promote Balanced Distribution Sweden, Australia, – transfers to local govt. for specific support services Quebec – financial incentives to local govt. to attract immigrants Manitoba – agreement with the federal govt. to nominate immigrants to fill specific job vacancies

20
In-migration 40% moving from Montreal -> Toronto 25% moving from Vancouver -> Toronto 12% moving from Toronto -> Vancouver Ontario and BC primary destinations for interprovincial migration Mobility decreases as time in country increases Least mobile – South/southeast Asia and S. Europe 30% of those leaving Toronto move to a city within commuting distance – Hamilton, Oshawa, Kitchener

21
Projected Populations

22
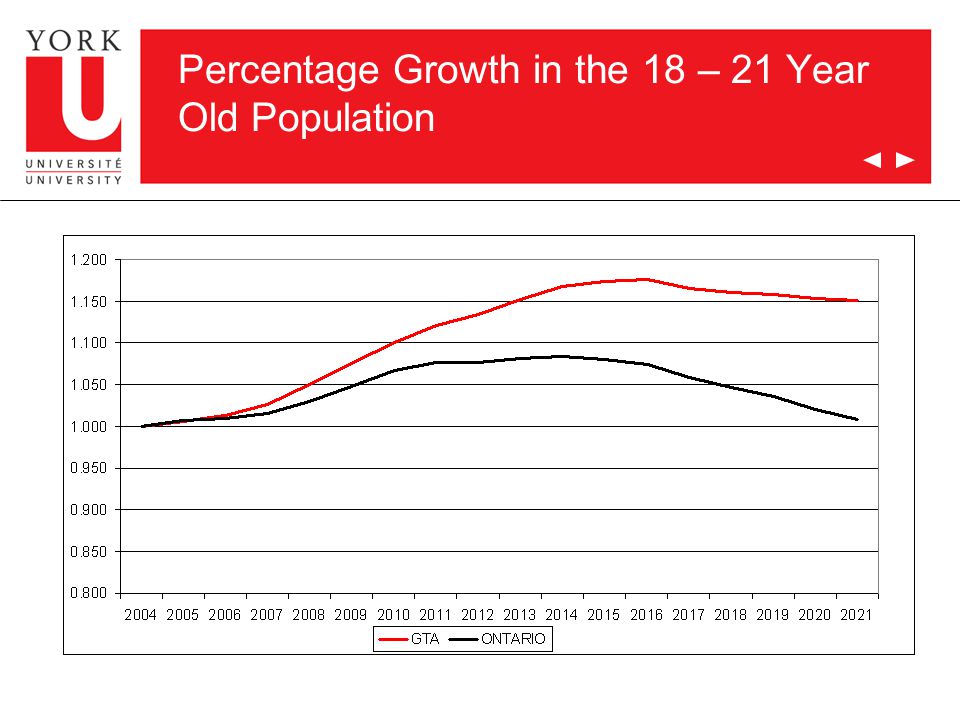
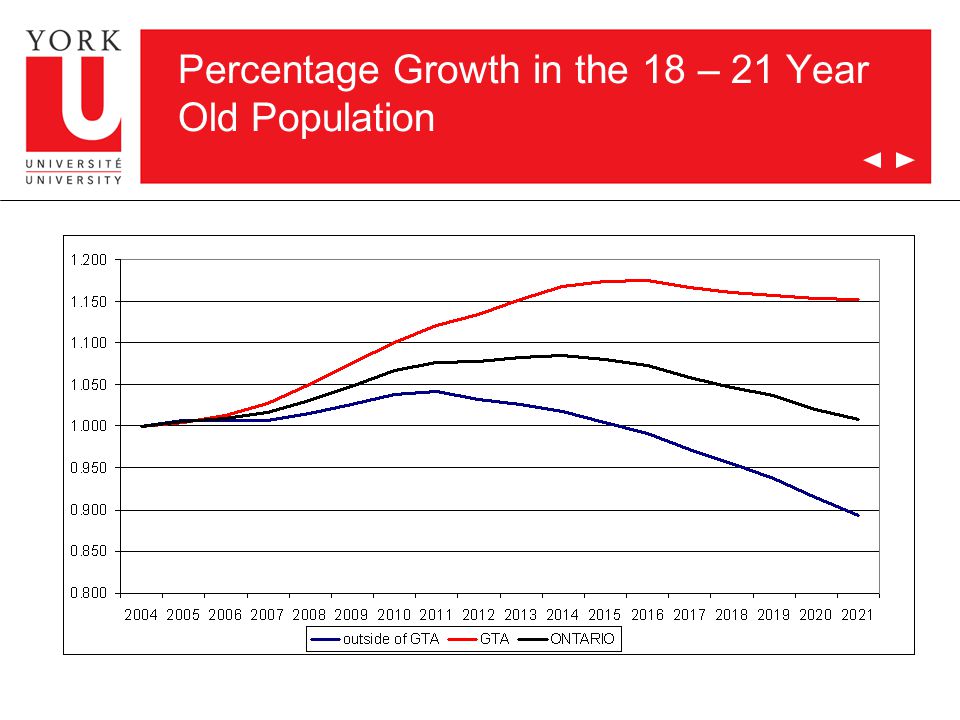
Ontario Projections Focus on Ontario university aged population – 18 to 21 years of age. Pick up on themes that – growth is mostly the result of immigration – new Canadians settle differentially around the Province All data is from Ontario Ministry of Finance http://www.fin.gov.on.ca/english/economy/demographics/projections/

23
Percentage Growth in the 18 – 21 Year Old Population

26
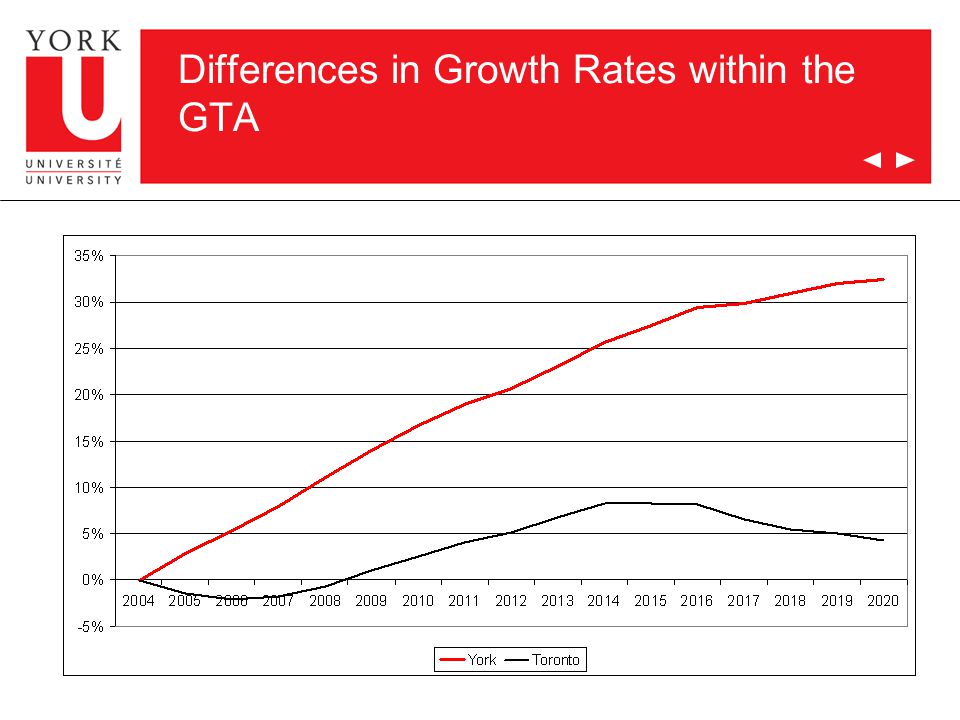
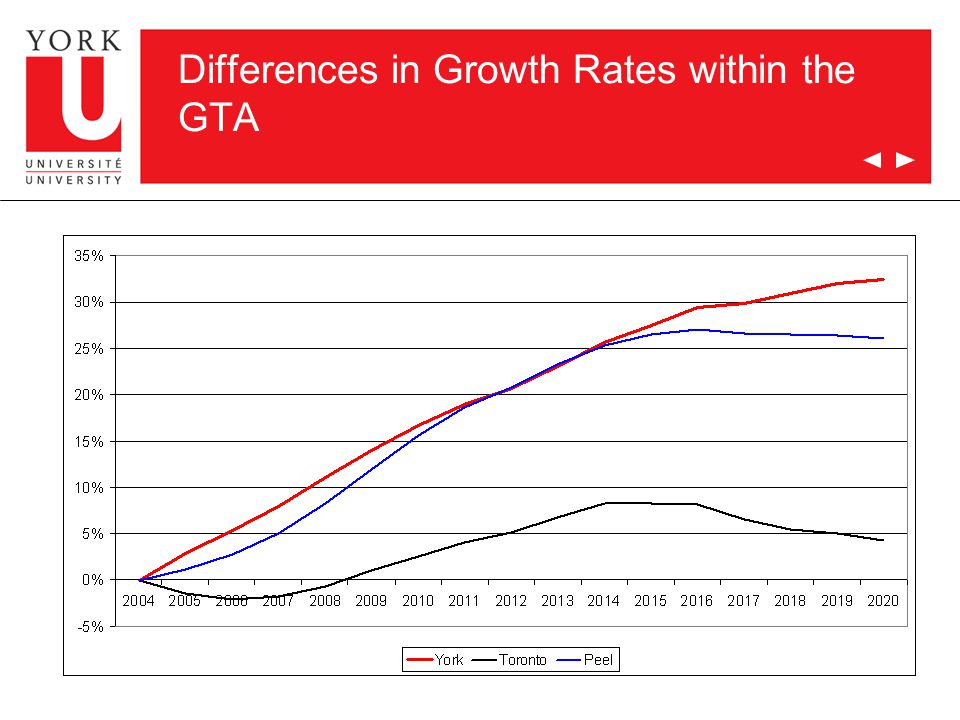
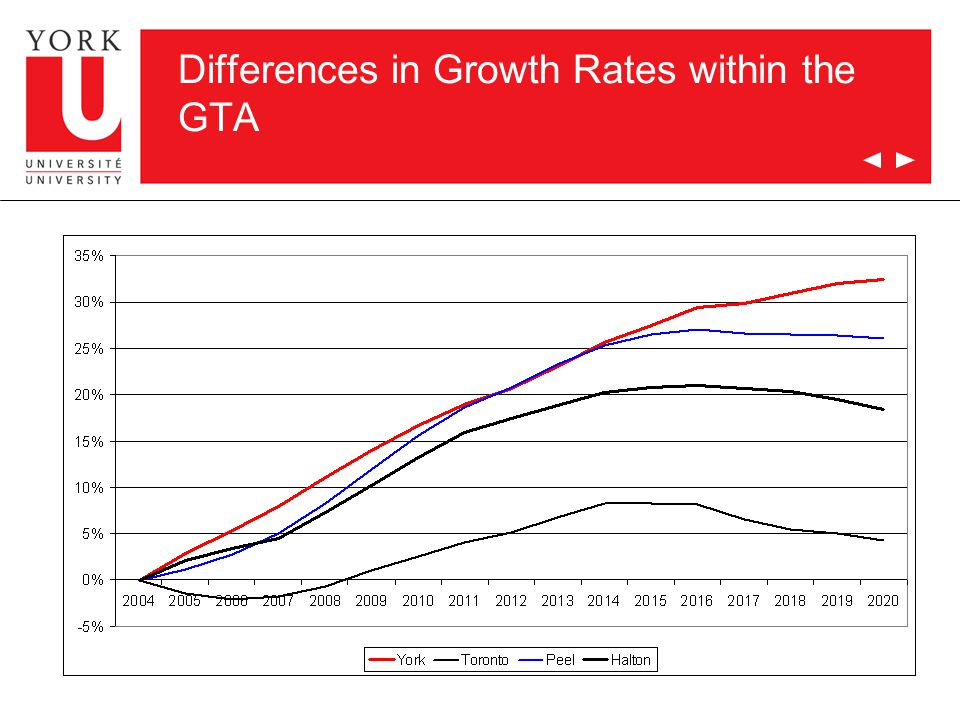
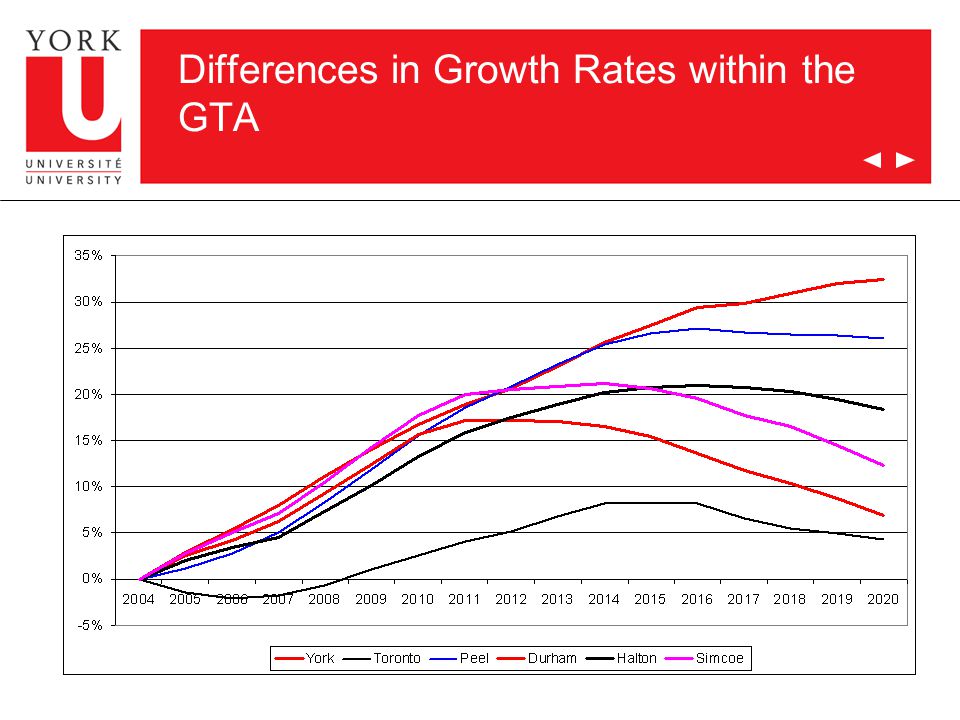
Differences in Growth Rates within the GTA

32
Difference in Regions Outside of the GTA

33
Implications: Where do Students from the GTA go to University?

34
Implications: Where do Students from Outside the GTA go to University?

35
Post-Secondary Issues Enrolment Growth Capacity Recruitment Strategies OSAP – financial support College – University Partnerships Satellite campuses Funding initiatives – e.g. First Generation Capital plans – residences Distance education Student services Male – female gender issues FT – PT

Similar presentations


 Population size (N) -ideal habitat -maximum reproduction -unlimited resources Increase often.>")


