Download presentation
Presentation is loading. Please wait.

1
Neutrino search in Auger Ricardo A. Vázquez University of Santiago de Compostela, Spain for the Pierre Auger collaboration Beijing, April 2006

2
1.The Pierre Auger Observatory 2. Neutrino Search: 3. Fluorescence Detector (FD) Search 4. Surface Detector Search 5. Conclusions
 Search 4. Surface Detector Search 5. Conclusions.")
3
The Pierre Auger Observatory Aims at measuring The Highest Energy Cosmic Rays Energy Spectrum - Direction – Composition - Anisotropy Hybrid detection: Fluorescence and Surface detectors Two Large Air Shower Detectors Mendoza Province, Argentina (under construction) Colorado, USA
 Colorado, USA")
4
The Auger Collaboration Participating Countries ArgentinaMexico Australia Netherlands Bolivia * Poland Brazil Slovenia Czech RepublicSpain France United Kingdom Germany USA ItalyVietnam * * Associate 63 Institutions, 369 Collaborators

5
Surface Array 100% duty cycle Uniform sky coverage Simple robust detectors Mass determination using rise time, & muon/em Fluorescence Detector Calorimetric energy measurement Direct view of shower development: Xmax measurement, mass determination Good angular resolution (< 1 o ) Hybrid concept
 Hybrid concept")
6
Advantages Independent measurement techniques allow cross calibration and control of systematics More reliable energy and geometry reconstruction Primary mass Hybrid concept: Surface Detector Array and Fluorescence Detectors Two observatories: allow full sky coverage

7
Auger Southern Site Mendoza province, Argentina

8
The Observatory Plan Surface Array 1600 detector stations 1.5 km spacing 3000 km 2 Fluorescence Detectors 4 Telescope enclosures 6 Telescopes per enclosure 24 Telescopes total

9
The Auger Surface Detector Three 8” PM Tubes Plastic tank White light diffusing liner 12 m 2 of de-ionized water Solar panel and electronic box Comm antenna GPS antenna Battery box

10
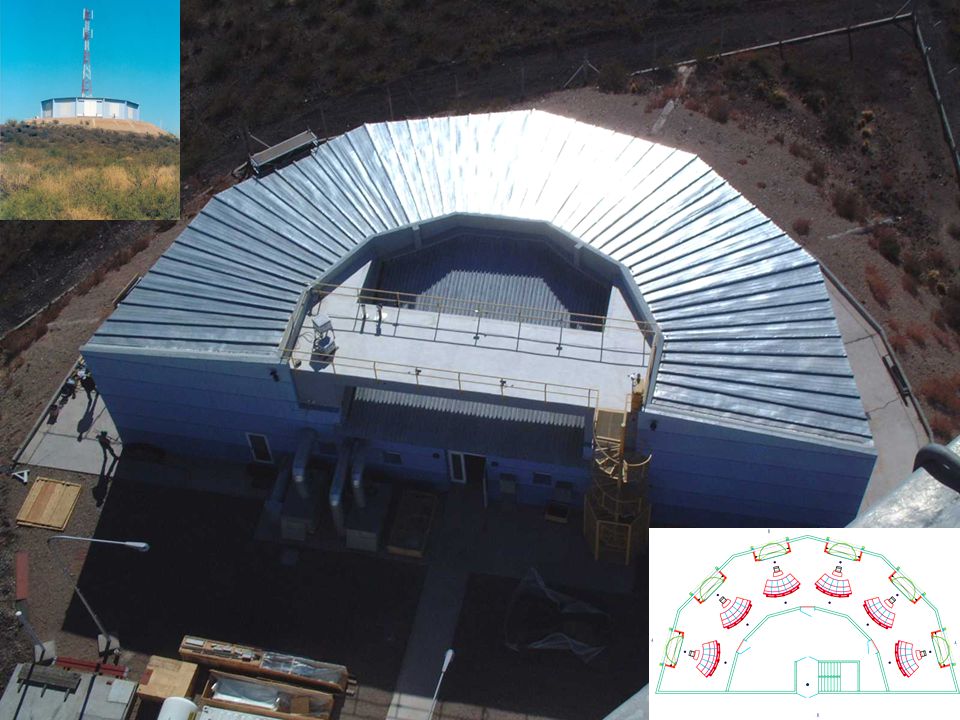
Fluorescence Detector Building at Los Leones

12
The Fluorescence Detector 3.4 meter diameter segmented mirror Aperture stop and optical filter 440 pixel camera

13
Atmosphere calibrated (movable) light sources cloud monitors LIDAR lasers balloon sondes 2. Intl Workshop Liebenzell Castle Dec 11-14

14
On-line monitoring(Big Brother) Detector elements are monitorized every 10 mins. Alarms inform about anomalies.

15
Auger Center Building

16
Detector Assembly Building Cerenkov detector tanks being prepared for deployment The Auger Campus

17
The communications system Rigging the antennas

18
Array status by the End 2004 337 tanks deployed ~100% duty cycle

19
905 surface detector stations deployed Three fluorescence buildings complete each with 6 telescopes End of 2005

20
Status of the array @ March 2006 ~ 1000 stations

21
The First Data Set Collection period – 1 January 2004 to 5 June 2005 Zenith angles - 0 - 60º Total acceptance – 1750km 2 sr yr (~ AGASA) Surface array events (after quality cuts) Current rate - 18,000 / month Total -~180,000 Hybrid events (after quality cuts) Current rate – 1800 / month Total ~ 18000 Cumulative number of events January 04 July 04 January 05
 Surface array events (after quality cuts) Current rate - 18,000 / month Total -~180,000 Hybrid events (after quality cuts) Current rate – 1800 / month Total ~ Cumulative number of events January 04 July 04 January 05")
22
Official First FD Event

23
Surface Detector First 4 – fold event – 12 August

24
Flash ADC traces Lateral density distribution Hybrid Event Θ~ 30º, ~ 8 EeV

25
Fitted Electromagnetic Shower from Fly's Eye 1985 Time μ sec Angle Χ in the shower-detector plane Hybrid Event Θ~ 30º, ~ 8 EeV Tanks Pixels

26
Example Event Θ~ 48º, ~ 70 EeV Flash ADC traces Lateral density distribution Typical flash ADC trace Detector signal (VEM) vs time (ns) PMT 1 PMT 2 PMT 3
 vs time (ns) PMT 1 PMT 2 PMT 3")
27
Lateral density distribution Surface Detector Event Θ~ 60º, ~ 86 EeV Flash ADC traces Flash ADC Trace for detector late in the shower PMT 1 PMT 2 PMT 3

28
Hybrid event

29
Performance: Resolution of Core Position Hybrid – SD only core position Hybrid Data Laser Data Core position resolution –Hybrid: < 60 m Surface array: ~150 m Laser position – Hybrid and FD only (m) -500 +500 Entries 501 Mean 5.8 ± 6.5 m RMS 147 m Entries 501 Mean 68 ± 8 m RMS 173 m
 Entries 501 Mean 5.8 ± 6.5 m RMS 147 m Entries 501 Mean 68 ± 8 m RMS 173 m")
30
Performance: Angular Resolution Surface array Angular resolution (68% CL) < 2.2º for 3 station events (E< 3EeV, θ < 60º ) < 1.7º for 4 station events (3<E<10 EeV) 10 EeV) Hybrid Angular resolution (68% CL) 0.6 degrees (mean) Hybrid-SD only space angle difference Hybrid Data Angle in laser beam /FD detector plane Laser Beam Entries 269 σ(ψ) =1.24º
 < 2.2º for 3 station events (E< 3EeV, θ < 60º ) < 1.7º for 4 station events (3<E<10 EeV) 10 EeV) Hybrid Angular resolution (68% CL) 0.6 degrees (mean) Hybrid-SD only space angle difference Hybrid Data Angle in laser beam /FD detector plane Laser Beam Entries 269 σ(ψ) =1.24º")
31
Energy Determination and the Spectrum The detector signal size at 1000 meters from the shower core - called the ground parameter or S(1000) - is determined for each surface detector event using the lateral density function. S(1000) is proportional to the primary energy. The energy scale is based on fluorescence measurements without reliance on a specific interaction model or assumptions about the composition. Zenith angle ~ 48º Energy ~ 70EeV
 is proportional to the primary energy. The energy scale is based on fluorescence measurements without reliance on a specific interaction model or assumptions about the composition. Zenith angle ~ 48º Energy ~ 70EeV.")
32
Energy Determination and the Spectrum The energy converter: Compare ground parameter S(1000) with the fluorescence detector energy. Transfer the energy converter to the surface array only events. Log S(1000) Log (E/EeV) 10EeV 1 EeV Hybrid Events Strict event selection: track length >350g/cm2 Cherenkov contamination <10%
 Log (E/EeV) 10EeV 1 EeV Hybrid Events Strict event selection: track length >350g/cm2 Cherenkov contamination <10%.")
33
Auger Energy Spectrum E/E~30% E/E~50% ICRC 2005 spectrum

34
Neutrino search in Auger FD search –Auger can detect neutrinos directly with the fluorescence detector SD search –Deep inclined (neutrino) showers should have a different time structure (risetime/falltime), curvature, etc. and electromagnetic component Different strategies

35
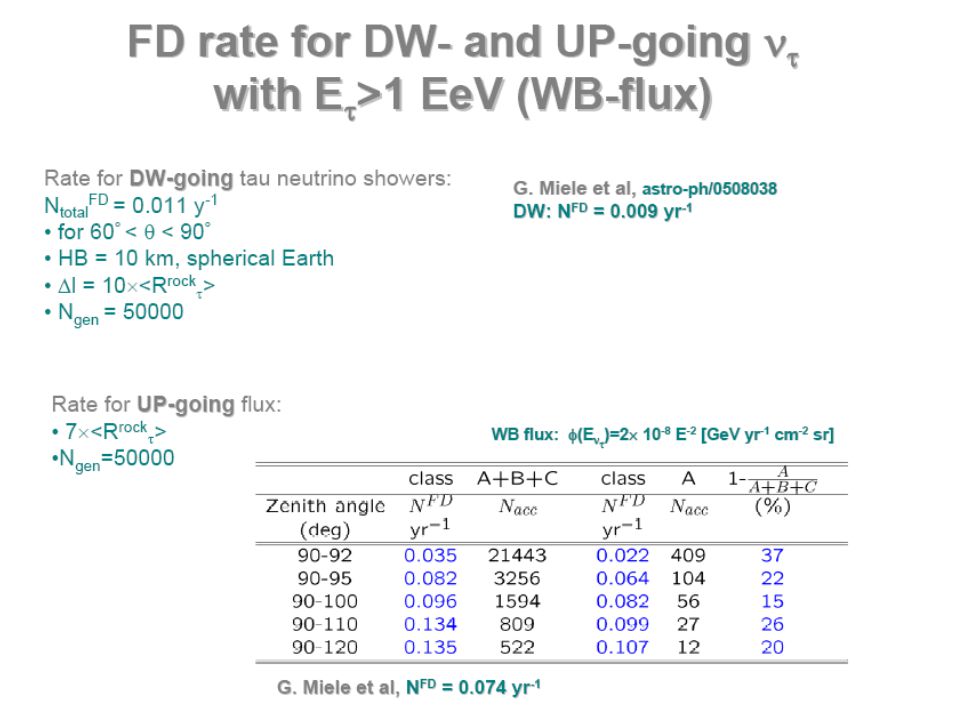
M. Roth et al., Karlsruhe FD search

39
M. Roth, Karlsruhe

42
a real vertical event (20 deg) Noise ! doublet SD search
 Noise ! doublet SD search")
43
a real horizontal event (80 deg) “single” peaks : fast rise + exp. light decay ( ~ 70 ns) accidental background signals are similar
 accidental background signals are similar.")
44
Simulated + ( 5.1) 0 (16.1) 1800 m above ground
 0 (16.1) 1800 m above ground")
45
EM signal in shower plane Proton 1 EeV θ = 80 deg x shower plane [m] y shower plane [m] [VEM] ρ, ε → S μ,EM 3167 g/cm 2 3306 g/cm 2 3570 g/cm 2 3968 g/cm 2 4100 g/cm 2 4238 g/cm 2 4371 g/cm 2 4503 g/cm 2 4636 g/cm 2 4768 g/cm 2 4901 g/cm 2 3438 g/cm 2 3703 g/cm 2 3035 g/cm 2 X injection J. Alvarez-Muniz Downgoing showers
![EM signal in shower plane Proton 1 EeV θ = 80 deg x shower plane [m] y shower plane [m] [VEM] ρ, ε → S μ,EM 3167 g/cm g/cm g/cm g/cm g/cm g/cm g/cm g/cm g/cm g/cm g/cm g/cm g/cm g/cm 2 X injection J.](http://images.slideplayer.com/17/5378797/slides/slide_45.jpg "Alvarez-Muniz Downgoing showers.")
46
Controlled calculation: strategy We need ΔX where neutrino triggers are expected → Effective volume Calculate size of active region (where S EM >S threshold )
")
47
2D EM signal maps at ground EM signal [VEM] x [km] y [km] Proton, E = 10 17 eV, h int = 0 m θ = 90.1 degθ = 90.5 degθ = 91 degθ = 110 degθ = 92 degθ = 93 degθ = 95 degθ = 100 degθ = 105 deg AIRES + SIBYLL 2.1 Fixed proton interaction height h int = 0 m J. Alvarez-Muniz Upcoming showers
![2D EM signal maps at ground EM signal [VEM] x [km] y [km] Proton, E = eV, h int = 0 m θ = 90.1 degθ = 90.5 degθ = 91 degθ = 110 degθ = 92 degθ = 93 degθ = 95 degθ = 100 degθ = 105 deg AIRES + SIBYLL 2.1 Fixed proton interaction height h int = 0 m J.](http://images.slideplayer.com/17/5378797/slides/slide_47.jpg "Alvarez-Muniz Upcoming showers.")
48
2D EM signal maps at ground EM signal [VEM] x [km] y [km] Proton, E = 10 17 eV, θ = 91 deg. h int = 0 m AIRES + SIBYLL 2.1 h int = 50 mh int = 100 mh int = 300 mh int = 500 mh int = 1000 mh int = 3000 m Fixed zenith angle θ = 91 deg. J. Alvarez-Muniz
![2D EM signal maps at ground EM signal [VEM] x [km] y [km] Proton, E = eV, θ = 91 deg.](http://images.slideplayer.com/17/5378797/slides/slide_48.jpg "h int = 0 m AIRES + SIBYLL 2.1 h int = 50 mh int = 100 mh int = 300 mh int = 500 mh int = 1000 mh int = 3000 m Fixed zenith angle θ = 91 deg. J. Alvarez-Muniz.")
49
Event 850018 Event 1432390 = 71.5±0.02 = -57.2±0.02 E ~ 50 EeV R= 22.9 km /dof =2.4 NTanks =48 = 77.1± 0.01 = -36.1 ± 0.01 E ~ 30 EeV R= 33.11 km /dof =1.81 NTanks = 59 Some events

50
Event 767138 = 87.6 = -134.9 E ~ 30 EeV /dof =1.7 NTanks = 37

51
Post-San Valentin day event Event 1999991 = 83 = -102 E ~ 40 EeV /dof =2.3 NTanks = 61

52
10% 50% Risetime is defined as the time from 10% - 50% of the integrated pulse. Falltime time from 50% - 90% Risetime/Falltime S [VEM] 90 %

53
Falltime vs Risetime (no cuts) All stations θ ≥ 70 deg. θ ≤ 45 deg. J. Alvarez-Muniz
 All stations θ ≥ 70 deg. θ ≤ 45 deg. J. Alvarez-Muniz")
54
Falltime vs Risetime (1 cut) S ≥ 15 VEM θ ≤ 45 deg. θ ≥ 70 deg.
 S ≥ 15 VEM θ ≤ 45 deg. θ ≥ 70 deg.")
55
Falltime vs Risetime (2 cuts) S ≥ 15 VEM & r ≥ 500 m θ ≥ 70 deg. θ ≤ 45 deg. Neutrino candidates should have θ ≥ 70 deg and should show up here. No events up to now!

56
No θ ≥ 70 deg. Candidates looking like (0,45) deg. events. No deep inclined events starting at vertical depths between 870 and 870/cos45 = 1230 g/cm 2 (from the detector) => target volume => limit on deep showers.
 => target volume => limit on deep showers..")
57
L Cazon, RAV, A. Watson, E. Zas (Ap Phys 2004) Curvature analysis
 Curvature analysis")
58
Arrival Time of first muon (& average) -like delay large p-like delay: small (flat) L. Cazon, RAV, E. Zas

59
footprint analysis Variables defined from the footprint (in any configuration, even aligned) length L and width W (major and minor axis of the ellipsoid of inertia) “speed” for each pair of stations (distance/difference of time) major axis titi tjtj d ij P. Billoir & O. Blanch

60
candidate selection 2. Discriminating variables cuts: L/W > 5 0.29 < av. Speed < 0.31 r.m.s. < 0.08 Search for long shaped configurations, compatible with a front moving horizontally at speed c, well contained inside the array (background: vertical or inclined showers, d/Dt > c ) from years 2004-2005: no real event survived…
 from years : no real event survived….")
61
Auger sensitivity Points: 1 event / year / decade of energy “pessimistic” energy loss uncertainty range GRB TD AGN GZK preliminary P. Billoir & O. Blanch

62
3C2 & 4C4 2C1 & 3C2 & 4C4 2C1 & 4C2 3C1 & 4C2 not saturated yet at 10 19 eV compacity of the trigger matters ! L. Nellen, V. Van Elewyck & RAV Log(E/eV) Understanding the background: HAS Optimal trigger?
 Understanding the background: HAS Optimal trigger .")
63
Conclusions -The Pierre Auger Observatory is performing well and steadily taking data -Due to the Hybrid characteristics several neutrino searches are possible -Need to understand the background, model dependence on the aperture, systematics,…. -We will keep looking for neutrinos !

Similar presentations


 By: Rasha Usama Abbasi.>")

 Alan Watson University of Leeds>")