Download presentation
Presentation is loading. Please wait.

1
Nuclear Magnetic Resonance (NMR) Spectroscopy
CHAPTER 9 Nuclear Magnetic Resonance (NMR) Spectroscopy
 Spectroscopy.")
2
NMR: Based on absorption of Radio waves of certain nuclei in strong Magnetic Field
Origin: Some atoms nuclei have no spin (12C, 16O). Some other nuclei have spin(1H,13C,19F). These produce a small magnetic field = nuclear magnetic moment
. Some other nuclei have spin(1H,13C,19F). These produce a small magnetic field = nuclear magnetic moment.")
3
In NMR spectroscopy an external magnetic field generated by a permanent magnet is used.
The strength of the field is symbolized by H0 (units= gauss)
")
4
1H or Proton NMR Spectra When molecules containing hydrogen atoms are placed in an external magnetic field ; the magnetic moment of each proton nucleus aligns itself in one of two different orientations:

5
The parallel protons absorb energy (radio waves) and the magnetic moment turn around (flip) to the high energy antiparallel state (Resonance)
 and the magnetic moment turn around (flip) to the high energy antiparallel state (Resonance)")
6
The amount of energy required to flip the magnetic moment depends on the strength of the applied magnetic field H0

7
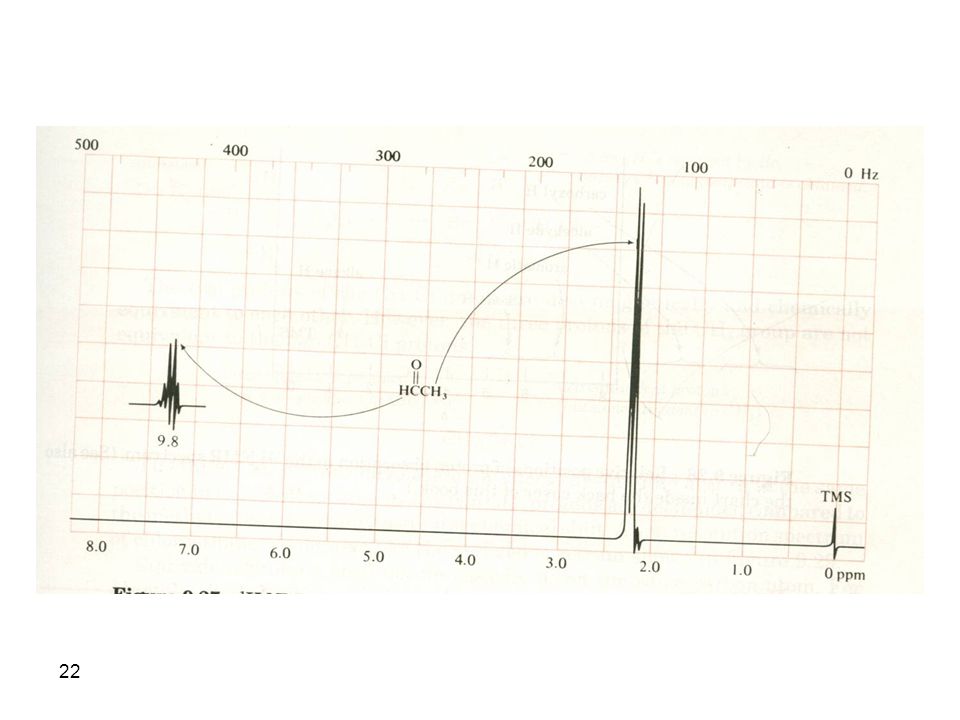
Energy difference between parallel and antiparallel states increases with the strength of the external field H0. The magnetic field observed by a proton is a combination of 2 fields 1- H0 external 2- Induced molecular magnetic field

8
Field Effects

9
Different protons in an organic compound are surrounded by molecular field of different strength It takes stronger or weaker Ho to overcome the molecular fields Different protons come into resolution at different position in the spectrum.

10
NMR spectrometer

11
The NMR Spectrum

12
The spectrum is measured on a delta (d) scale in units of parts per million (ppm)
Lower frequency is to the left in the spectrum; these absorptions are said to be downfield Higher frequency is to the right in the spectrum: these absorptions are said to be upfield The small signal at d 0 corresponds to an internal standard called tetramethylsilane (TMS) used to calibrate the chemical shift scale The number of signals in the spectrum corresponds to the number of unique sets of protons
 used to calibrate the chemical shift scale. The number of signals in the spectrum corresponds to the number of unique sets of protons.")
13
Chemical Shift Chemical shifts are measured in relation to the internal reference tetramethylsilane (TMS) The protons of TMS are highly shielded because of the strong electron donating capability of silicon The d scale for chemical shifts is independent of the magnetic field strength of the instrument (whereas the absolute frequency depends on field strength)
")
14
Thus, the chemical shift in d units for protons on benzene is the same whether a 60 MHz or 300 MHz instrument is used

15
Shielding and Deshielding of Protons
Protons in an external magnetic field absorb at different frequencies depending on the electron density around that proton High electron density around a nucleus shields the nucleus from the external magnetic field Shielding causes absorption of energy at higher frequencies (more energy is required for this nucleus to flip between spin states) - the signals are upfield in the NMR spectrum Lower electron density around a nucleus deshields the nucleus from the external magnetic field Deshielding causes absorption of energy at lower frequencies (less energy is required for this nucleus to flip between spin states) - the signals are downfield in the NMR spectrum
 - the signals are upfield in the NMR spectrum. Lower electron density around a nucleus deshields the nucleus from the external magnetic field. Deshielding causes absorption of energy at lower frequencies (less energy is required for this nucleus to flip between spin states) - the signals are downfield in the NMR spectrum.")
17
Fields induced by sigma bonds
The induced field from circulating sigma bond electrons opposes Ho in the vicinity of proton

18
A proton that is bonded to the same carbon as an electronegative atom is more deshielded than proton on other carbons. (Inductive Effect) H3C-F H3C-Cl H3C-Br H3C-I d 4.3 d 3.0 d 2.7 d 2.1 Increased shielding of H

19
The inductive effect

20
Fields induced by pi electrons
Circulating pi electrons in benzene and aldehydes induce a magnetic field that deshield the adjacent protons.

23
Summary of induced field effects

24
Equivalent and nonequivalent protons

27
Proton NMR spectra of CH3CH2Cl

28
Integration of Peak Areas. The Integral Curve
The area under each signal corresponds to the relative number of hydrogen atoms in each unique environment within a molecule The height of each step in the integral curve is proportional to the area of the signal underneath the step

29
Calculation of relative Hydrogen

30
Spin-spin coupling Protons that split each other signals are said to have undergone spin-spin coupling

31
n+1 Rule The number of peaks of a particular proton is equal to number (n) of nonequivalent protons on the adjacent atoms + 1
 of nonequivalent protons on the adjacent atoms + 1.")
33
Notice:

34
Splitting pattern: The singlet
If no neighboring nonequivalent protons present one single peak (singlet) (S). eg.
 (S). eg.")
35
The doublet If one neighboring nonequivalent proton present two peaks (doublet) (d). eg
 (d). eg")
36
The triplet If two neighboring nonequivalent protons present three peaks (triplet) (t). eg
 (t). eg")
37
The quartet If a proton is neighboring to CH3 it will observe 3+1=4 peaks (quartet) (q) eg
 (q) eg")
40
Examples:

45
Spin-spin splitting diagram

46
Coupling constant The separation between two peaks is called the coupling constant (J)
")
47
Terminal alkene NMR

49
Chemical Exchange and Hydrogen Bonding
Impure alcohol contains acid and base impurities which catalyze the exchange of hydroxyl protons This rapid exchange is so fast that coupling to the adjacent CH3 is not observed This process is called spin decoupling

50
Spin decoupling is typical in the 1H NMR spectra of alcohols, amines and carboxylic acids
The proton attached to the oxygen or nitrogen normally appears as a singlet because of rapid exchange processes

51
When an 1H NMR of regular ethanol is taken the hydroxyl proton is a singlet

52
Several factors complicate analysis of NMR spectra
Peaks may overlap ( if the chemical shift differences is very small)
")
53
Splitting patterns in aromatic groups can be confusing.
A monosubstituted aromatic ring can appear as an apparent singlet or a complex pattern of peaks. A para disubstituted aromatic ring mostly appear as two doublets (dd)
")
54
Interpretation of proton NMR spectra
From the molecular formula determine the number of unsaturation ( No. of rings + Double bonds) CxHyNzOn # of rings + db= x-1/2 y+1/2 z +1 X = # of carbon atoms y = # of hydrogen and halogen atoms z = # of nitrogen atoms
 CxHyNzOn. # of rings + db= x-1/2 y+1/2 z +1. X = # of carbon atoms. y = # of hydrogen and halogen atoms. z = # of nitrogen atoms.")
55
Example: C7H6O2 #rings + db = 7- 1/2x6 + 1 = 5
One ring + 4 double bonds benzoic acid

56
C3H8O

57
C7H8O

58
C4H7ClO2

59
C8H10O2

60
Notice: in interpreting NMR spectra
Singlet no H on adjacent atoms Doublet one H on adjacent atoms. Triplet Two H’s on adjacent atoms. Quarter Three H’s on adjacent atoms Pentet Four H’s on adjacent atoms Sixtet Five H’s on adjacent atoms Septet six H’s on adjacent atoms

61
C4H8O2

62
C10H14O

63
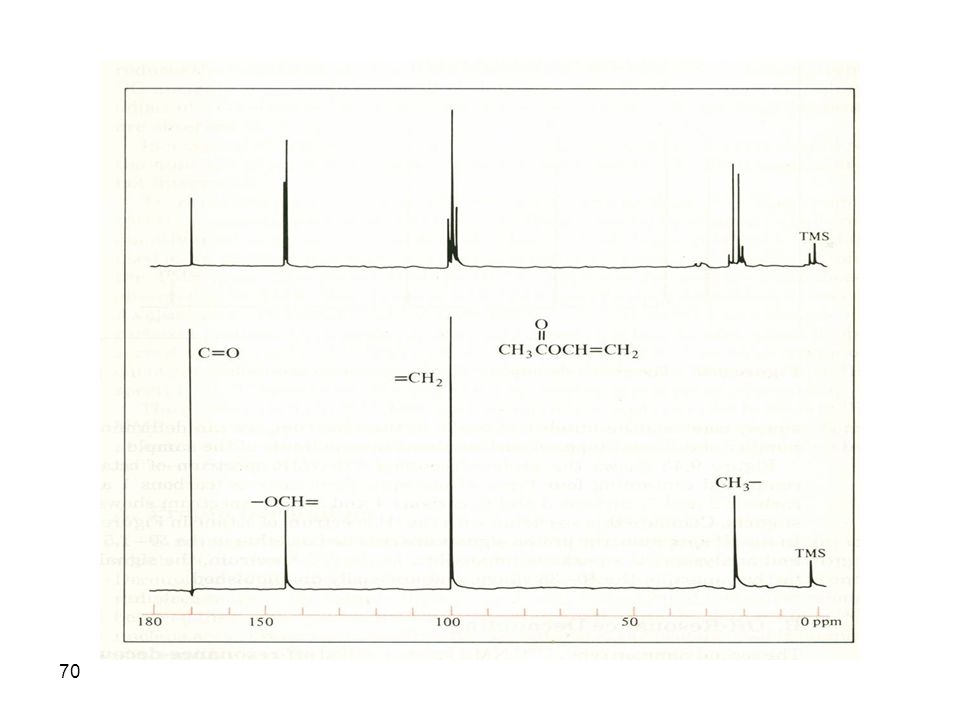
Carbon-13 NMR Spectroscopy
13C accounts for only 1.1% of naturally occurring carbon 12C has no magnetic spin and produces no NMR signal. C-13 NMR has d 0 to 220 ppm (1HNMR d 0 to 12 ppm) No integration for C-13 spectra Since the 13C isotope of carbon is present in only 1.1% natural abundance, there is only a 1 in 10,000 chance that two 13C atoms will occur next to each other in a molecule
 No integration for C-13 spectra. Since the 13C isotope of carbon is present in only 1.1% natural abundance, there is only a 1 in 10,000 chance that two 13C atoms will occur next to each other in a molecule.")
64
13C proton decoupled spectrum
The low probability of adjacent 13C atoms leads to no detectable carbon-carbon splitting No coupling between 13C and C. One Peak for Each Unique Carbon Atom ( All nonequivalent carbons singlets) # peaks # nonequivalent carbons. CH3CH3 one singlet CH3CH2CH3 two singlets CH3CH2CH2CH3 two singlets
 # peaks # nonequivalent carbons. CH3CH3 one singlet. CH3CH2CH3 two singlets. CH3CH2CH2CH3 two singlets.")
65
Off-Resonance Decoupled Spectra
Direct coupling between the carbon atom and the hydrogen on this carbon ( n+1 rule is applied) -CH3 quartet -CH2- triplet -CH- doublet
 -CH3 quartet. -CH2- triplet. -CH- doublet.")
66
13C Chemical Shifts Just as in 1H NMR spectroscopy, chemical shifts in 13C NMR depend on the electron density around the carbon nucleus Decreased electron density causes the signal to move downfield (desheilding) Increased electron density causes the signal to move upfield (sheilding) Because of the wide range of chemical shifts, it is rare to have two 13C peaks coincidentally overlap A group of 3 peaks at d 77 comes from the common NMR solvent deuteriochloroform and can be ignored
 Increased electron density causes the signal to move upfield (sheilding) Because of the wide range of chemical shifts, it is rare to have two 13C peaks coincidentally overlap. A group of 3 peaks at d 77 comes from the common NMR solvent deuteriochloroform and can be ignored.")
67
13C Chemical Shifts

68
13C Chemical shift ( simplified)
")
69
Examples

71
C5H7O2Br

72
C6H10

73
C4H6O2

Similar presentations


>")

>")


>")


 Spectroscopy Structure Determination>")
