Download presentation
Presentation is loading. Please wait.

1
Structure Determination: MS, IR, NMR (A review)
Dr. Sheppard CHEM 2412 Fall 2014 McMurry (8th ed.) sections , , , , 13.13
 sections , , , ,")
2
Spectroscopy Analytical techniques Help determine structure
Destroy little or no sample Light absorbed by the sample is measured as wavelength varies Types: Mass spectrometry (MS) Fragments the molecule and measures the masses Infrared (IR) spectroscopy Measures the bond vibration frequencies in a molecule and is used to determine the functional group Nuclear magnetic resonance (NMR) spectroscopy Number, type and connectivity of atoms in a molecule Ultraviolet (UV) spectroscopy Uses electron transitions to determine bonding patterns (conjugated p systems)
 Fragments the molecule and measures the masses. Infrared (IR) spectroscopy. Measures the bond vibration frequencies in a molecule and is used to determine the functional group. Nuclear magnetic resonance (NMR) spectroscopy. Number, type and connectivity of atoms in a molecule. Ultraviolet (UV) spectroscopy. Uses electron transitions to determine bonding patterns (conjugated p systems)")
3
Mass Spectrometry

4
Mass Spectrometry Used with Gas Chromatography
Mixture of compounds separated by gas chromatography, then identified by mass spectrometry Determines MW and provides information about structure A beam of high-energy electrons breaks molecules into ions (fragments) M → M•+ + e- M•+ → A+ + X A+ → B+ + Y etc. Ions are separated and detected; mass determined
 M → M•+ + e- M•+ → A+ + X. A+ → B+ + Y. etc. Ions are separated and detected; mass determined.")
5
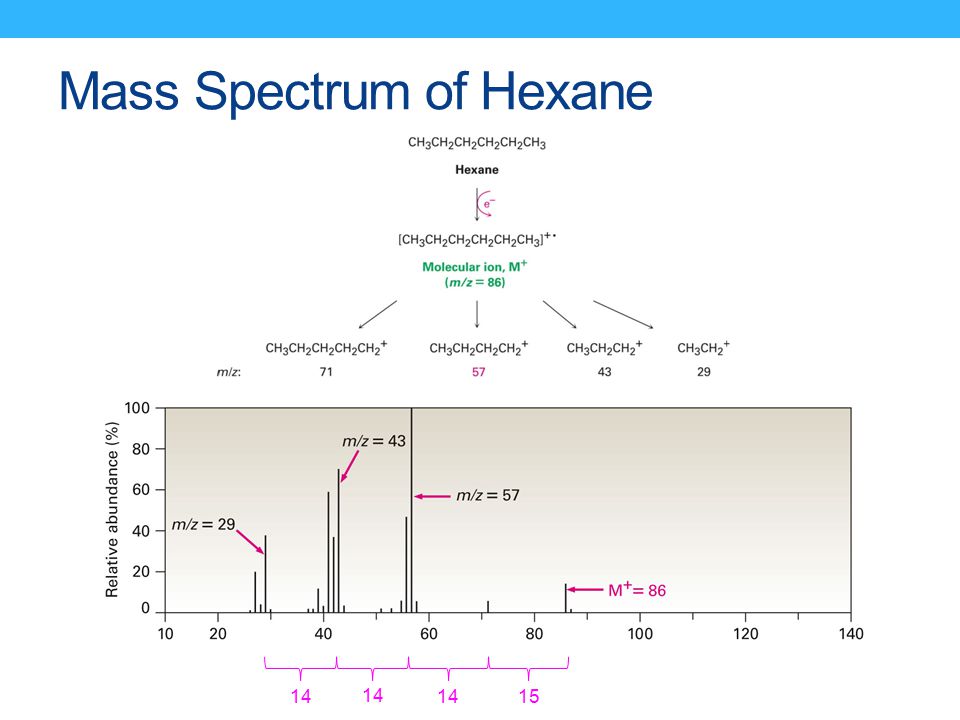
The Mass Spectrum Plot relative abundance vs. mass-to-charge ratio
Base peak = strongest (most abundant/stable ion) Molecular ion/parent peak (M+) = mass of compound 14 14 15
 Molecular ion/parent peak (M+) = mass of compound")
6
Mass Spectrum of Hexane
14 14 14 15
7
Isotopes Present in their usual abundance
81Br Isotopes Present in their usual abundance Hydrocarbons contain 1.1% 13C, so there will be a small M+1 peak If S is present, M+2 will be 4% of M+ If Cl is present, M+2 is one-third of M+ If Br is present, M+2 is equal to M+ If I is present, peak at 127; large gap

8
Infrared Spectroscopy

9
IR Spectroscopy Units are wavenumbers (4000-400 cm-1)
Measures molecular vibrations No two molecules will give exactly the same IR spectrum (except enantiomers)
")
10
IR Spectrum Simple stretching: 1500-4000 cm-1
Baseline Absorbance/Peak Simple stretching: cm-1 Complex vibrations: cm-1 The “fingerprint region” Interpretation: Looking for presence/absence of functional groups Correlation tables Polar bonds is usually the most IR-active

11
IR Correlation Table (McMurry 8th ed.)
")
12
Hexane , Hexene and Hexyne Spectra

13
Alcohol and Amine Spectra

14
Carbonyl Spectra

15
NMR

16
NMR Most powerful technique for structure determination
Number and type of atoms in a molecule Connectivity of atoms Used to study a wide variety of nuclei: 1H, 13C, 15N, 19F, 31P, etc. Radio-frequency radiation used to transition between energy states (nuclear spin) Spinning nucleus acts as a bar magnet Aligns with or against external field Absorption of light causes spin flip “Resonance” Measured by spectrometer
 Spinning nucleus acts as a bar magnet. Aligns with or against external field. Absorption of light causes spin flip. Resonance Measured by spectrometer.")
17
Nuclei in a Molecule Depending on their chemical environment, atoms in a molecule are shielded by different amounts Chemically equivalent nuclei Interchanged through bond rotation or element of symmetry Have same absorption Chemically different nuclei have different absorption

18
Chemical Shifts (d scale, in ppm)
")
19
TMS = Reference Compound
NMR Spectra TMS = Reference Compound

20
13C-NMR Signal = one sharp line for each different type of carbon
The number of different signals indicates the number of different kinds of carbon The chemical shift indicates the functional group Used to support 1H-NMR analysis

21
1H-NMR More info than 13C-NMR The number of signals
How many different kinds of protons are present The location (chemical shift) of the signals Is the proton shielded or deshielded The intensity (integration) of the signal The number of protons of that type Signal splitting (multiplicity) The number of protons on adjacent atoms
 of the signals. Is the proton shielded or deshielded. The intensity (integration) of the signal. The number of protons of that type. Signal splitting (multiplicity) The number of protons on adjacent atoms.")
22
1H-NMR Number of Signals
One signal for each type of H in a molecule

23
1H-NMR Chemical Shifts More shielded = upfield (to the right)
Less shielded = downfield (to the left)
")
24
1H-NMR Integration The signal intensity (area under signal) is proportional to the number of protons giving rise to that signal Shown by integration line Height of vertical line ≈ area under peak ≈ # H’s in set Measure height with ruler or look at graph paper Ratio of height = ratio of hydrogens

25
1H-NMR Spin-Spin Splitting
Signals can be split into multiple peaks The (n+1) rule: A signal is split by n neighboring protons, into (n + 1) peaks
 rule: A signal is split by n neighboring protons, into (n + 1) peaks.")
26
1H-NMR Spin-Spin Splitting
Coupling constants (J) Distance between the peaks of a split signal Measured in Hz (usually 0-18) Gives info on type of H
 Distance between the peaks of a split signal. Measured in Hz (usually 0-18) Gives info on type of H.")
27
Stereochemical Nonequivalence
Usually, two protons on the same carbon are equivalent and do not split each other If the replacement of each of the protons of a -CH2 group with an imaginary “Z” gives stereoisomers, then the protons are non-equivalent and will split each other Results in more complex splitting patterns Examples:

28
Solving NMR Problems Given: Goal: Determine structure
1H-NMR Molecular formula (typically) IR (sometimes) 13C-NMR (sometimes) Goal: Determine structure If the molecular formula is known: Determine the number of elements of unsaturation Sum of number of rings + p bonds Index of Hydrogen Deficiency IHD = C – ½(H + X) + ½N + 1 Example: C5H3N2O2Cl IHD = 5 – ½(3 + 1) + ½(2) + 1 = 5
 IR (sometimes) 13C-NMR (sometimes) Goal: Determine structure. If the molecular formula is known: Determine the number of elements of unsaturation. Sum of number of rings + p bonds. Index of Hydrogen Deficiency IHD = C – ½(H + X) + ½N + 1. Example: C5H3N2O2Cl IHD = 5 – ½(3 + 1) + ½(2) + 1 = 5.")
Similar presentations


>")


 Spectroscopy>")

 for a detailed description.>")


>")


 Spectroscopy Structure Determination>")


