Download presentation
Presentation is loading. Please wait.

1
NMR Spectroscopy

2
NMR NMR uses energy in the radio frequency range.
This energy is too low to cause changes in electron energy levels or in the vibrations of molecules. NMR can cause changes in the spin of particles in the nucleus of some atoms.

3
Protons, neutrons and electrons spin on their axes in either an up or down direction. For this technique, the movement of electrons is not relevant. In many nuclei, the number of nucleons is even; the spins are paired and cancel each other out. In atoms like 1H and 13C, there is an overall spin.

4
In the presence of a strong magnetic field, the tiny magnetic field due to spinning charged particles aligns to be either with or against the magnetic field.

5
More nucleons will be in the lower energy state aligned with the magnetic field.
A nucleon can absorb a quantum of energy in the radio frequency range and align against the magnetic field. It emits a radio frequency when it drops back to its original position.

6
Proton NMR The most common for of NMR is based on the hydrogen-1 (1H), nucleus or proton. It can give information about the structure of any molecule containing hydrogen atoms. Complex biochemical molecules have a large number of carbon atoms so NMR using the 13C isotope is often also used.

7
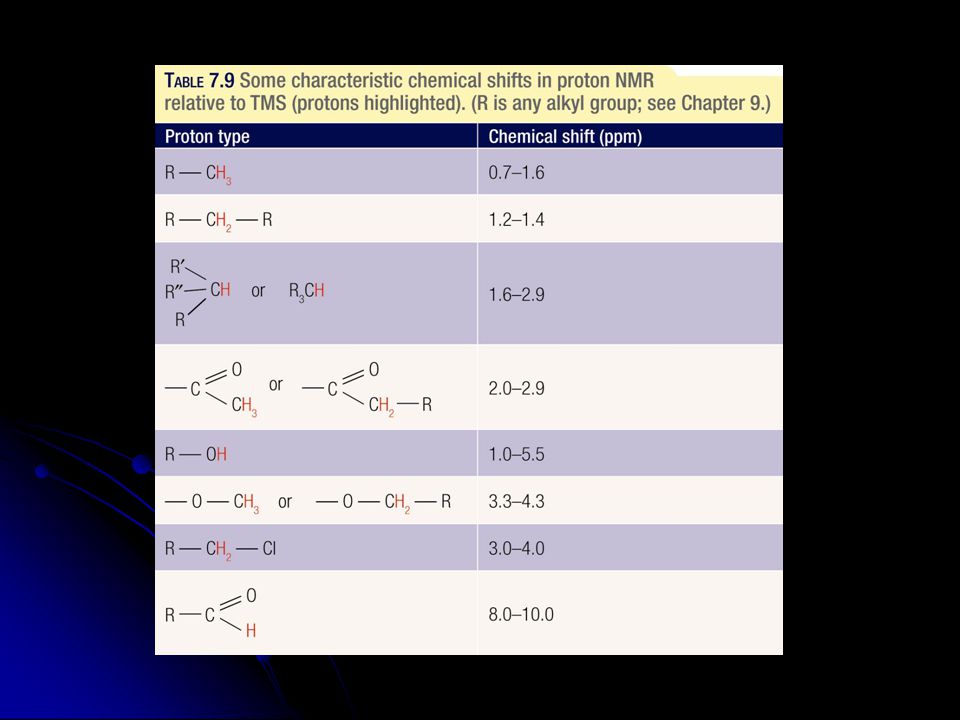
The difference in energy of the two spin states depends on :
The nucleus being screened ( 1H or 13C) The other atoms around the nucleus. These can shield the nucleus and change the amount of energy needed to change its spin. (H in CH3 will absorb a different frequency from H in CH2)
 The other atoms around the nucleus. These can shield the nucleus and change the amount of energy needed to change its spin. (H in CH3 will absorb a different frequency from H in CH2)")
8
To standardise measurements on different NMR instruments, a standard reference sample is used in each experiment. This is tetramethylsilane (TMS). This is a symmetrical and inert molecule. All H atoms have the same chemical environment and a single peak is produced from this molecule.

9
The difference in energy needed to change the spin state in the sample is compared to TMS and is called the CHEMICAL SHIFT. The chemical shift of TMS is defined as zero The symbol d represents chemical shift and is measured in ppm. The chemical shift scale is measured from right to left on the spectrum.

11
The NMR Spectrophotometer

12
Instrumentation Main features of a basic NMR include:
A radio transmitter coil that produces a short powerful pulse of radio waves A powerful magnet that produces strong magnetic fields The sample is placed in a glass tube that spins so the test material is subject to uniform magnetic field. Solid samples are dissolved in a solvent that will not give a signal A radio receiver coil that detects radio frequencies emitted as nuclei relax to a lower energy level A computer that analyses and record the data

13
Proton NMR Low resolution spectra
Proton NMR is used to identify the number of chemically distinct hydrogen ‘environments’ there are in a molecule. In low resolution proton NMR, the number of peaks is equal to the number of different bonding environments experience by the hydrogen nuclei in the molecule.

14
Low resolution spectrum of ethanol
Proton NMR spectra Low resolution spectrum of ethanol

15
Proton NMR High Resolution Spectra
The NMR spectrum shows more detail. High resolution spectra’s show the J splitting of the peaks. The number of peaks caused by splitting equals n + 1, where n is the number of H atoms on the neighbouring atom i.e.: CH splits the signal from hydrogens attached to adjacent atoms into two peaks CH2 splits the signal from hydrogens attached to adjacent atoms into three peaks CH3 splits the signal from hydrogens attached to adjacent atoms into four peaks

16
High Resolution NMR spectrum of ethanol

17
What the NMR spectrum tells us
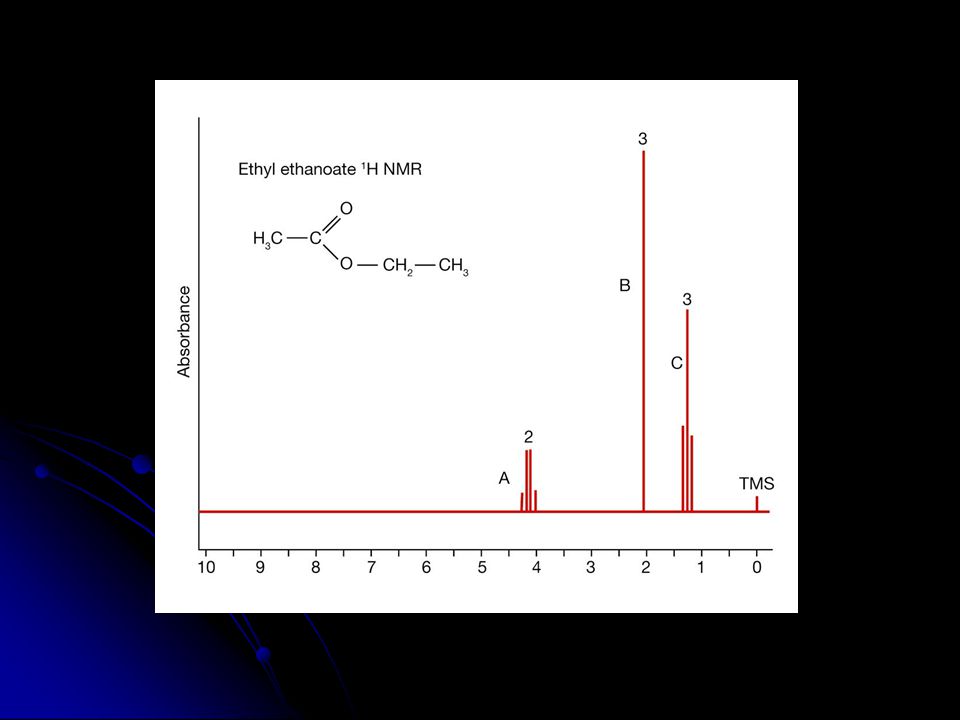
The number of peaks tell how many different proton environments are in the molecule. The peak area ratio shows the relative numbers of protons in each environment. The chemical shift (measured in ppm) helps to identify each of the different environments and provides information about the functional groups to which the hydrogen is attached. J splitting tells us how many H atoms are on the neighbouring atom according to the rule n+1. This supports the chemical shift data.
 helps to identify each of the different environments and provides information about the functional groups to which the hydrogen is attached. J splitting tells us how many H atoms are on the neighbouring atom according to the rule n+1. This supports the chemical shift data.")
18
1H Proton NMR Spectroscopy - Sample Spectra; Ethanol
3J Coupling; n+1 = triplet 3J Coupling; n+1 = quartet

19
Understanding & Identifying Molecular Structure
NMR Spectroscopy 1H NMR - Sample Spectra; CH3CHClCOOH 3J Coupling; n+1 = doublet 3J Coupling; n+1 = quartet

20
Worked Example 7.6 Page 101

21
Understanding & Identifying Molecular Structure
NMR Spectroscopy Sample Question Q. How could 1H NMR be used to distinguish between the two following isomers? H N O 2 H 2 C N O 2 C H 3 C C H 2 H 3 C C H 3 1-nitropropane 2-nitropropane

22
Understanding & Identifying Molecular Structure
NMR Spectroscopy Sample Question Q. How could 1H NMR be used to distinguish between the two following isomers? 2. 2. Sextet. 1. 1. Triplet. H 2 C N O 2 H 3 C C H 2 3. 3. Triplet. 1-nitropropane

23
Understanding & Identifying Molecular Structure
NMR Spectroscopy Sample Question Q. How could 1H NMR be used to distinguish between the two following isomers? 2. 2. Septet. H N O 2 1. 1. Doublet. C 3. 3. Doublet. H 3 C C H 3 2-nitropropane

24
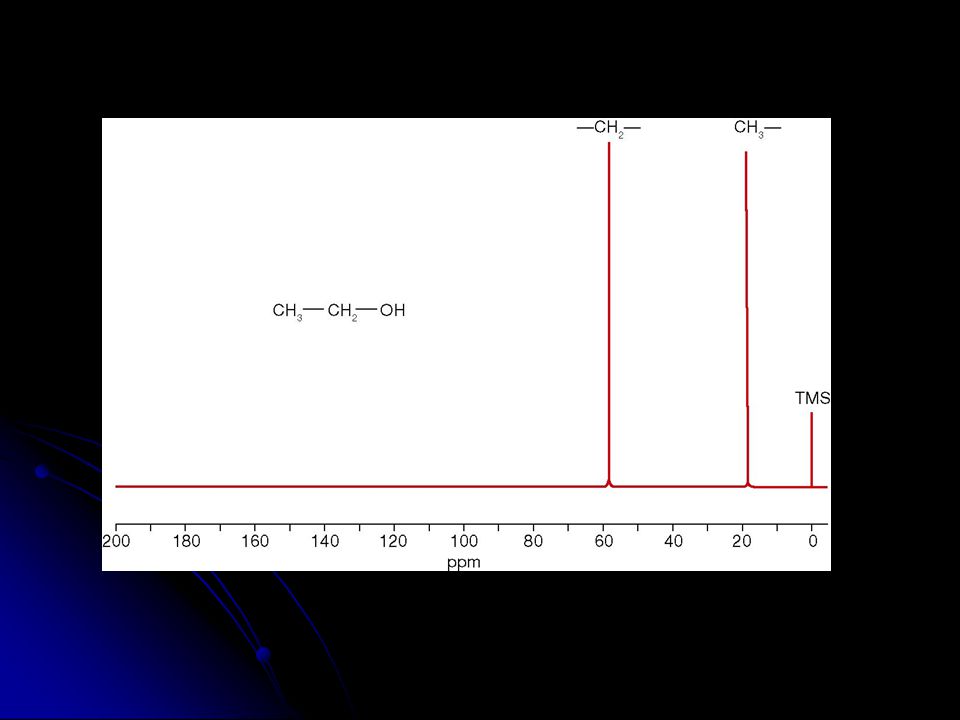
13C NMR Spectroscopy Carbon-13 is a naturally occurring isotope of carbon that has nuclear spin. It is used in NMR spectroscopy to identify different carbon atoms environments within a molecule. Chemical shifts range from 0ppm to 200ppm The peaks in the spectrum are a single line produced for each different carbon atom environment. Compare the two spectra for ethanol.

25
13C NMR spectroscopy

27
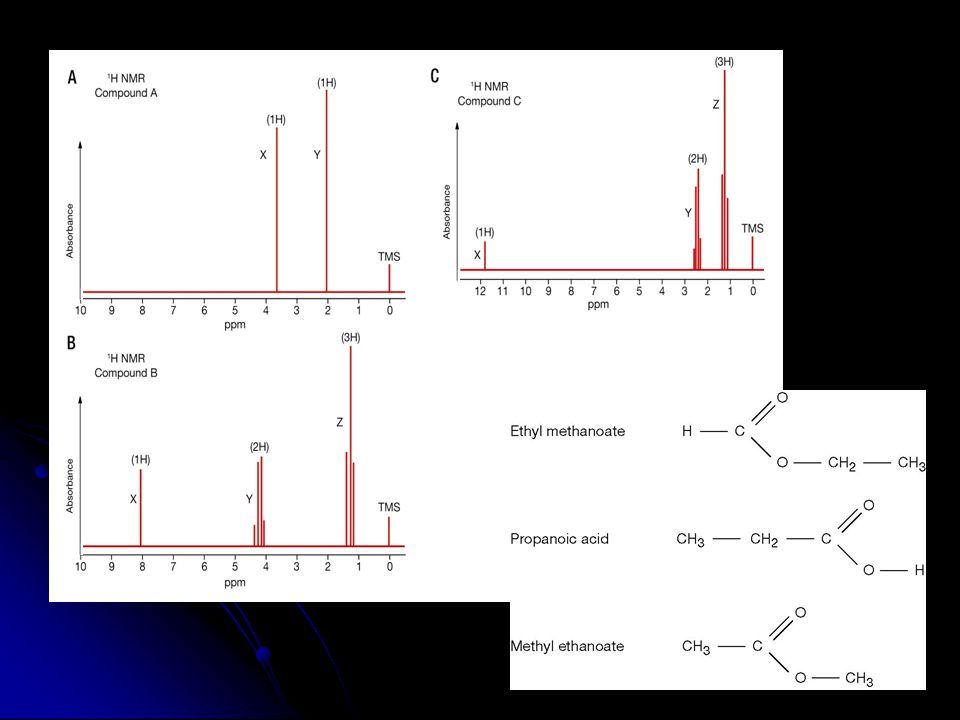
Steps for analysing NMR spectra
Look at the number of peak sets and hence the number of different environments The chemical shift for each peak set The relative number of protons in each peak set (from the relative peak area) The number of fine peaks each major peak set is split into Determine the relative number of hydrogens in each environment The protons responsible for each peak set and the carbon to which they are bonded
 The number of fine peaks each major peak set is split into. Determine the relative number of hydrogens in each environment. The protons responsible for each peak set and the carbon to which they are bonded.")
28
Your Turn Page 105 Question 17 and 18 Page 107 Question 32 Page 108

Similar presentations
 NMR Spectroscopy>")
 Spectroscopy>")

>")
 Spectroscopy>")

 Spectroscopy>")
 for a detailed description.>")


 nuclei, such as 1 H, 13 C, 19 F, 31 P have nuclear spin. A spinning charge creates a magnetic moment,>")


 Spectroscopy Structure Determination>")


