Download presentation
Presentation is loading. Please wait.

1
Population Density & Distribution

2
B. Population Distribution
Ecumene: a permanently inhabited place on the Earth *about 35% of land area is uninhabitable (non-ecumene) Where are the most non-ecumenes? World pop stats: ½ rural, other ½ urban 90% live north of the equator 90% live on less than 20% of land Tend to live low elevations & coastal (temperature, length of growing season, less erosion issues)
 Where are the most non-ecumenes World pop stats: ½ rural, other ½ urban. 90% live north of the equator. 90% live on less than 20% of land. Tend to live low elevations & coastal (temperature, length of growing season, less erosion issues)")
3
Expansion of the Ecumene 5000 B.C.E.– 1900 C.E.

4
C. Five Great Pop. Clusters
East Asia: 25% of world Japan, China, Taiwan, South Korea By the Pacific Coast China=1/2 are farmers, ½ live on the pacific coast Japan and Korea are mostly urbanized and people work service jobs

5
South Asian and East Asian distributions reflect agricultural populations

6
2. South Asia: 21% of world India, Bangladesh, Pakistan, Sri Lanka
Over 1 billion people live along the Ganges River alone From Lahore to Bangladesh is the highest pop. Density Mostlty farmers/rural areas

7
Europe: 12% of pop Germany, U.K., Benelux(48 countries)
Europe has as many people as U.S. but on 70% less space ¾ live in cities in Europe Also they live near rivers and the coal reserves of Germany and Belgium

8
reflect the locations of… coal fields
European pop. distributions reflect the locations of… coal fields

9
4. Southeast Asia 600 million people live in Southeast Asia
Mostly on islands between the Indian and Pacific oceans Indonesia=13,677 islands (JAVA has 100 mill people); Indonesia is the 4th most populated country People live on river valleys and deltas
; Indonesia is the 4th most populated country. People live on river valleys and deltas.")
10
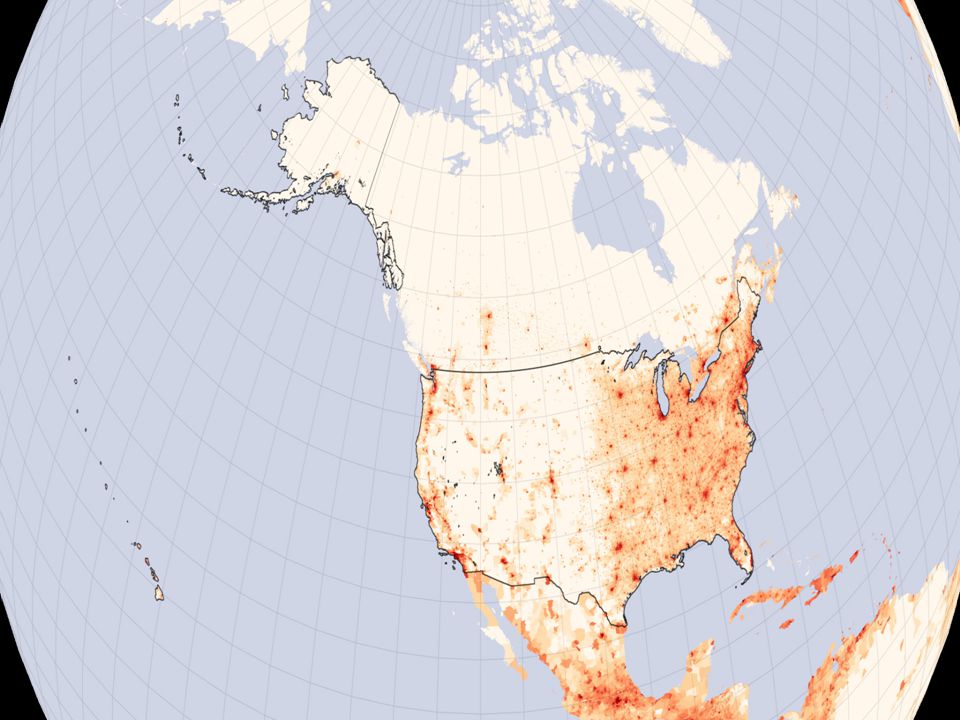
5. Northeastern U.S./S.E. Canada
U.S. “Rust Belt” & megalopolis of “Bowash” (urban area extending from Boston to D.C.) Canadian province of Quebec
 Canadian province of Quebec.")
12
*60% of Canadians concentrated within a thin belt of land between Windsor, Ontario & Quebec City

13
South America Periphery

14
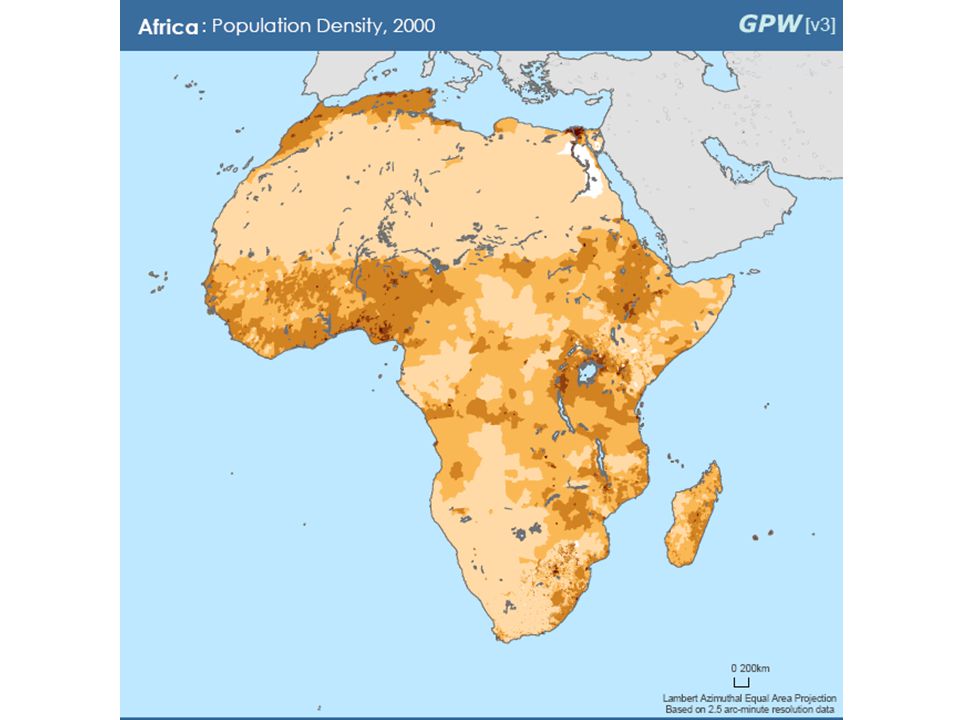
A. Population Density Arithmetic density: population per total land area -US arithmetic density is 32people/ square kilometer Physiologic density: population per agriculturally productive land – 33% of land on Earth is arable – U.S. physiological density: 175 arable land/square kilometer _In Egypt 95% live near the Nile river which is by the Nile River Egypt Physiological Pop Density=2296 people/arable land sq. KM Agricultural Density: The ratio of the number of farmers to the amount of arable land Developed countries have lower agricultural densities.

17
Egypt has an arithmetic density of 80 per square KM
Egypt’s physiologic density is 2296/sq KM

18
B. Demographic Equation:
Natural Change (births minus deaths) minus Net Migration Exs.: - ½ of British pop. increase due to immigration : 60 million Europeans arrived to U.S.
 minus. Net Migration. Exs.: - ½ of British pop. increase due to immigration : 60 million Europeans arrived to U.S.")
19
Crude Birth Rate: number of births in a year per 1000 people alive
Crude Birth Rate: number of births in a year per 1000 people alive. CBR of 20 is 20 live births per 1000 people per year. Developed countries 11 CBR and Crude Death Rate: number of deaths in a year per 1000 people alive. CDR is expressed as annual number of deaths per 1,000 of the population.10 is the CDR developed countries.

20
Natural Increase Rate: (NIR) percentage by which the population grows in a year.
CBR-CDR but after changing both numbers to per 100 people per year CBR 20-CDR 5=15 but the NIR is 1.5 Throughout most of history the NIR was close to zero. Developed countries NIR is .2

21
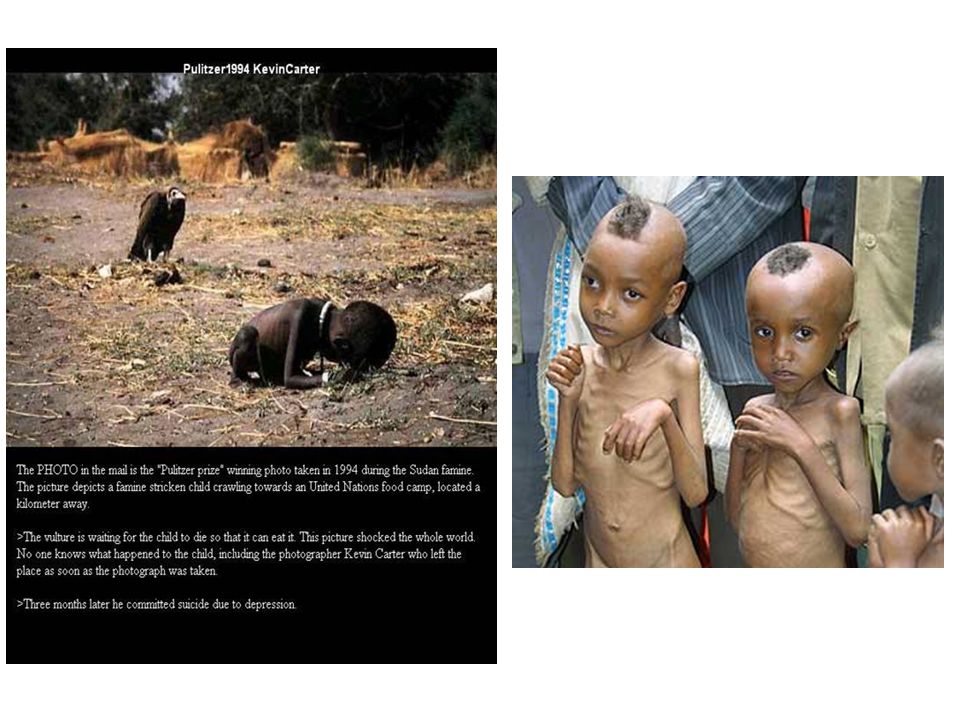
E. Overpopulation overpopulation: not enough resources to support a population carrying capacity (k-capacity): number of people that an area can support with existing technology

22
Tokyo: Overpopulated or Overcrowded?

24
Hong Kong

25
Mongolian capital city

Similar presentations


>")

 Total Fertility Rate (TFR) Crude Death Rate (CDR) Infant Mortality.>")


 Questions Where do people live and why do they live where they do? In which regions is population.>")

 Questions Where do people live and why do they live where they do? In which regions is population.>")

. 2.Set up page 42 for class-work.>")


