Download presentation
Presentation is loading. Please wait.

1
Chapter 2 Population Key Issues 1.Where is the worlds population distributed? 2.Where has the worlds population increased 3.Why is population increasing at different rates in different countries? 4.Why might the world face an over population problem? http://www.youtube.com/watch?v=E8dkWQ VFAoA

2
Key Issue 1- Where is the Population Distributed? –Pg 40 cartogram

3
demography - The study of population characteristics Geographers look at –where –Why –the scale of population in different regions, –Why could this be a problem?

4
Three Reasons for Studying Population 1.There is more people alive today then any other time in history 2.The population rate has increased more then any other time 3.Almost all population growth can be found in LDC

5
Earth ’ s Population History 1 billion reached circa 1830 2 billion reached 1930 (100 years later) 3 billion reached 1959 (29 years later) 4 billion reached 1974 (15 years later) 5 billion reached 1987 (13 years later) 6 billion reached 1999 (12 years later) Source: Kuby, HGIA 7 billion reached 2011 (12 years later)
 3 billion reached 1959 (29 years later) 4 billion reached 1974 (15 years later) 5 billion reached 1987 (13 years later) 6 billion reached 1999 (12 years later) Source: Kuby, HGIA 7 billion reached 2011 (12 years later)")
6
Human Population The collapse of the first civilization on earth, the Summerian, affected only a half a million. The fall of Rome affected tens of millions. If ours were to fail... it would bring catastrophe on billions. Directly or indirectly, the human species already captures nearly 40% of the total biological productivity on land and 70% of the productivity of the marine environment – the “net primary productivity” of the planet – for its exclusive use. The rate of increase in human use is about 2% per year.

7
http://www.greenberg- art.com/.Toons/.Toons,%20Environ/PopulationTrain.html

8
The study of population is important for three reasons

10
Population Equation Scale of inquiry- size of your investigation –Global vs. Local- LDC’s vs. MDC’s Demographic Accounting Equation –Global- P0– size at start P1- at end B- births during D- deaths during P1=P0+B-D –Sub- Global P0– size at start P1- at end B- births during D- deaths during I- Immigrants E-emigrants P1=P0+B-D+I-E Immigrant- “I” for coming in Emigrant- “E” for exit Why are these not counted in the Global Equation?

11
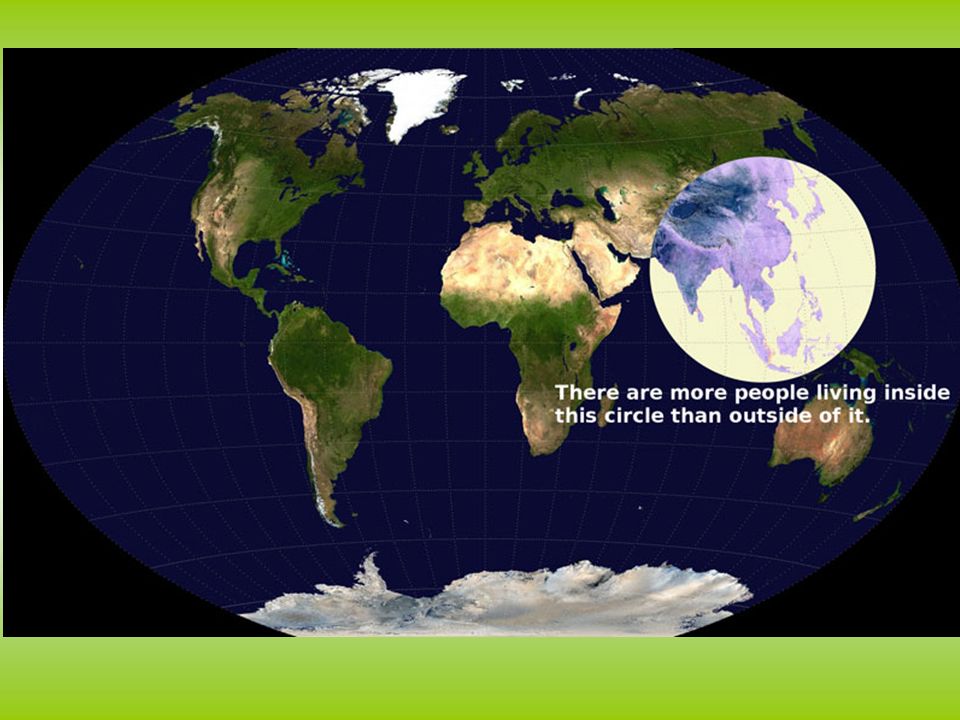
Population Distribution Distribution- the pattern of people across the earths surface –Unevenly and around water ¾ of the pop lives on 5% of the earths surface Ecumene- sustained population

16
One Billion per Region

17
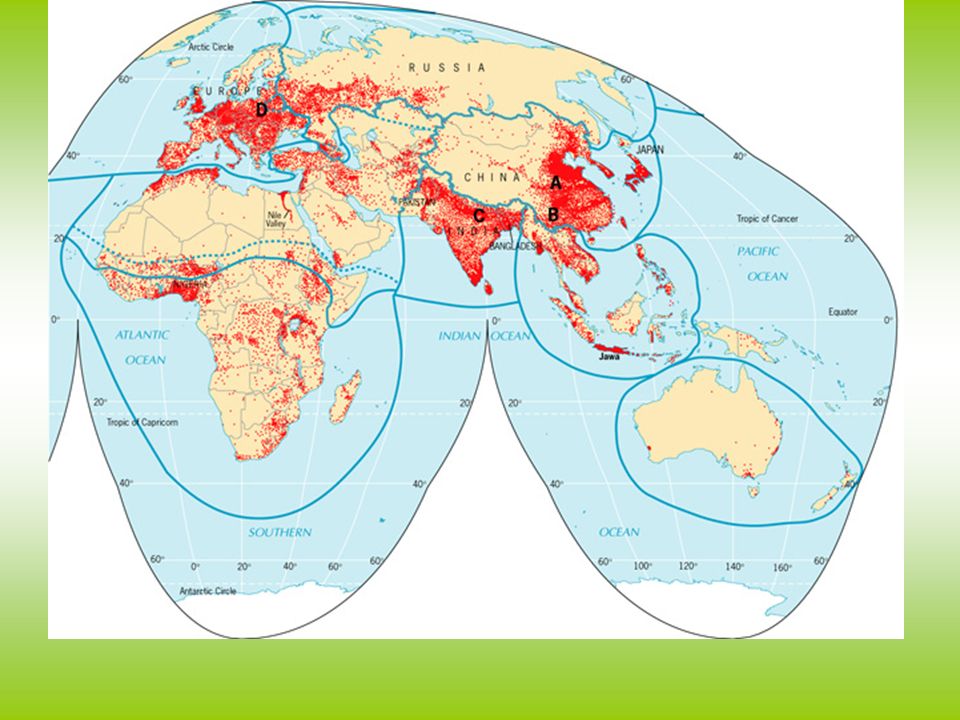
World Population Cartogram Fig. 2-1: This cartogram displays countries by the size of their population rather than their land area. (Only countries with 50 million or more people are named.)
.")
18
The World Today: More Than Seven Billion People

19
19 Distribution by Latitude Source: http://paul.kedrosky.com/archives/2010/08/world_populatio.html

20
20 Distribution by Longitude Source: http://paul.kedrosky.com/archives/2010/08/world_populatio.html

22
22 Global Population: 2 / 3 of the World in 4 Major Clusters East Asia – More than 1.5 billion people – More than 20% of humanity – About 20% of humanity in China – About 50 % rural South Asia – More than 1.5 billion people – About 20% of humanity – Nearly 20% of humanity in India – About 60% rural Southeast Asia – About ½ billion people – 8% of humanity – More than 2 / 3 rural Europe – About ¾ billion people – 11% of humanity – About ¾ urban

23
East Asia –¼ the earth population live here China, Japan, Korea, Taiwan –Of this 5/6 of these people live in China »Over 3/4ths of these inhabitants live in rural areas –Japanese and Taiwanese 3/4 th s live in urban areas South Asia –1/5 th the population lives in India, Pakistan, Bangladesh, Sri Lanka Along the Indus River and the Ganges –3/4ths of these people live in rural settings

24
Southeast Asia –4 th largest area of population, Java, Sumatra, Borneo, Papua New Guinea and the Philippines –The three Asian regions consist of over half the worlds population Europe –3 rd largest population cluster, 18 th the people on earth 3/4ths these people live in the cities –England, Germany and Belgium hold the highest population –They do not produce enough agriculture to support their population where do they get their food?

25
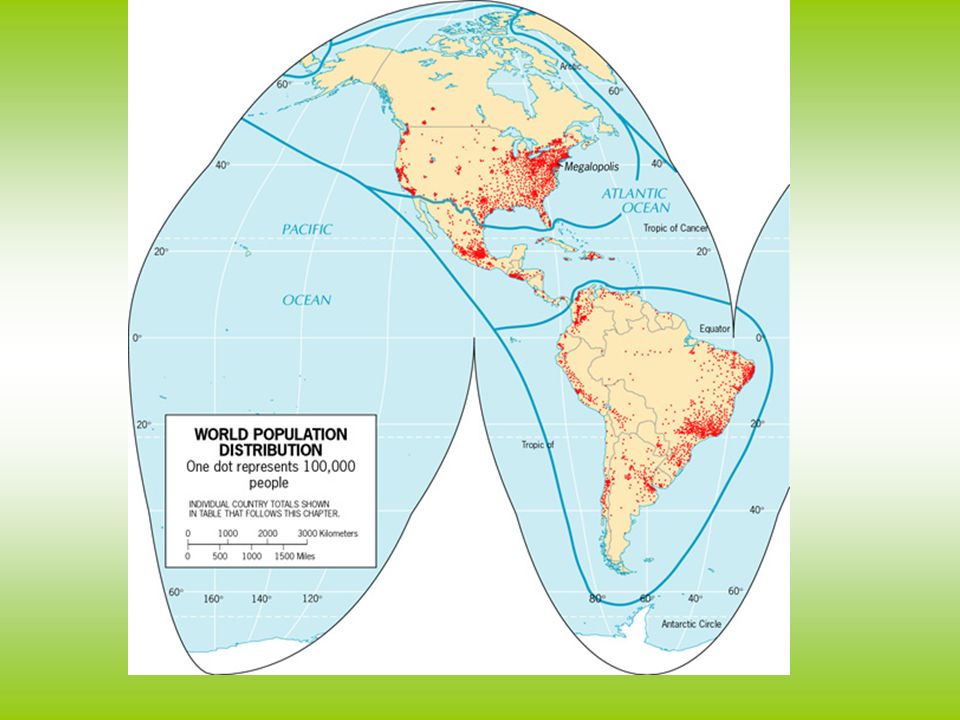
Eastern North America –2% of the population, located along the eastern U.S.A. and the southeast Canada 95% of these people live in the cities Sparsely Populated Regions –Ecumene- portion of the earth that permanently populates an area People avoid certain areas, Why? What are some examples?

26
ECUMENE

27
Dry Lands –20% of the earth surface, the largest include the Sahara, Arabian, Thar, Takla Makan, Gobi Lack of natural resources, such as what? What natural resource do they have? Wet Lands –50 inches of rain a year, high heat and rain deplete the soil Southeast Asia, South America Cold Lands –North and South poles covered in Permafrost Cant grow right? High lands –Steep snow covered, Mexico is an exception living about 7,360 ft above sea level

28
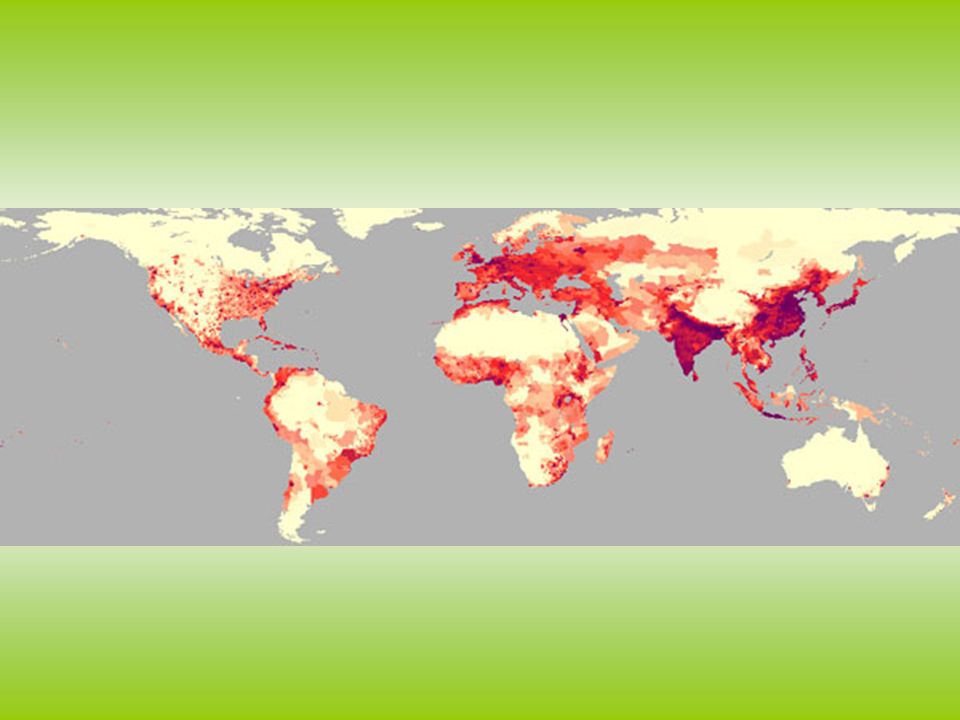
World Population Distribution & Climate Zones Fig. 2-2: World population is unevenly distributed across the earth’s surface. Climate is one factor that affects population density.

30
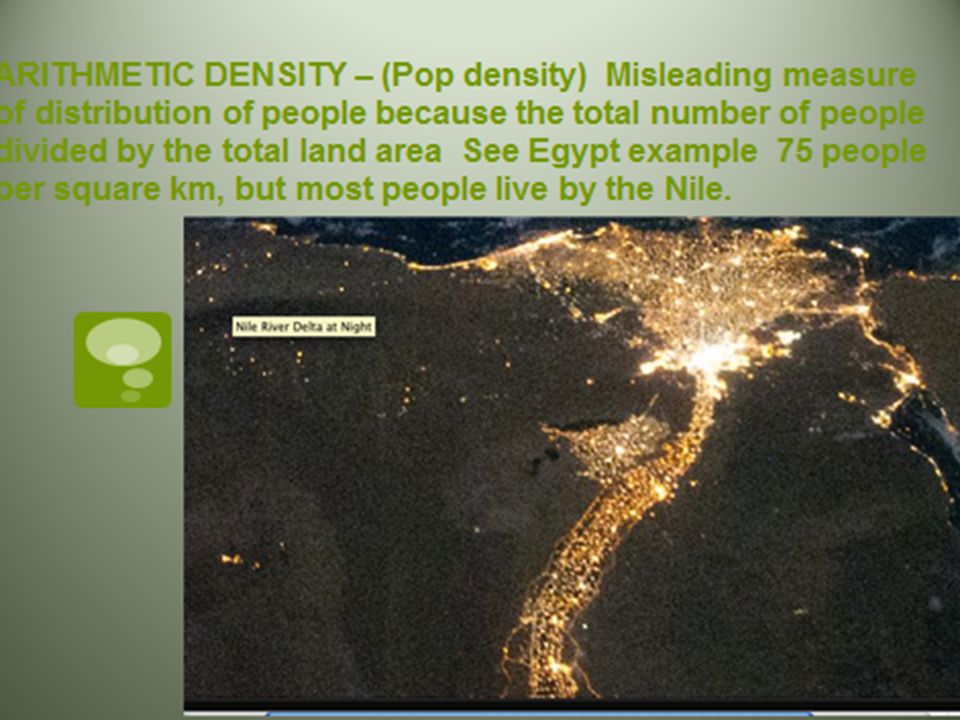
Arithmetic Population Density Fig. 2-4: Arithmetic population density is the number of people per total land area. The highest densities are found in parts of Asia and Europe.

31
Population Density –Number of people occupying land Arithmetic Density –Total # of people divided by land mass U.S. has 77 persons per sq. Mile –This number adjust as you measure different aspects, Manhattan has about 55,400 per sq. mile, why? –This explains the where question

32
Fig. 2-5: Physiological density is the number of people per arable land area. This is a good measure of the relation between population and agricultural resources in a society. Physiological Density

33
–Arable land- Farm Land # of people supported by Arable land –U.S. 404 persons per sq mile, Egypt 9073 per sq, shows us that Egypt must feed more people with this land

34
Agricultural Density

35
–Two places can be similar but their Farming Density could be different The ratio between farmers and the amount of farms –U.S. has 4 per sq kilo, Egypt has 1401 per sq Kilo »What can this tell us about technology and where production is being made

Similar presentations


 Questions Where do people live and why do they live where they do? In which regions is population.>")

>")
 Questions Where do people live and why do they live where they do? In which regions is population.>")
. 2.Set up page 42 for class-work.>")

