Download presentation
Presentation is loading. Please wait.

1
Ch. 14: Fiscal Policy Federal budget process and recent history of outlays, tax revenues, deficits, and debts Supply-Side Economics Controversies on effects of deficits on investment, saving, and economic growth Redistribution of benefits and costs across generations Fiscal policy as a stabilization tool

2
The Federal Budget and Fiscal Policy
annual statement of the federal government’s outlays and tax revenues. Two purposes finance the activities of the federal government achieve macroeconomic objectives Fiscal policy the use of the federal budget to achieve macroeconomic objectives Employment Act of 1946 it is the continuing policy and responsibility of the Federal Government to use all practicable means to coordinate and utilize all its plans, functions, and resources to promote maximum employment, production, and purchasing power.

3
Timeline for 2007 Budget

4
The Council of Economic Advisers
Fiscal Policy The Council of Economic Advisers monitors the economy keeps the President and the public well informed about the current state of the economy forecasts of where it is heading. source of data that informs the budget-making process. Congressional Budget Office Forecasts effects of legislative changes on budget and economy

5
Source of Revenues Revenues

6
Composition of Outlays

7
Federal Deficits and Public Debt
Budgett = revenuet –outlayst if Budgett > 0 budget surplus if Budgett < 0 budget deficit Debtt = Debtt-1 - budgett-1 Budget deficits increase debt Budget surpluses decrease debt

8
Revenues and Outlays

9
CBO data on budget deficits/debt: http://www. cbo

10
The U.S. Government Budget in Global Perspective

11
State and Local Budgets
In 2005, when federal government outlays were about $2,500 billion, state and local outlays were almost $1,700 billion. Most state expenditures were on public schools, colleges, and universities ($550 billion); local police and fire services; and roads. Greatest source of state revenue: income & sales taxes Greatest source of local tax revenue: property & sales taxes Many states (including Ohio) have a balanced budget amendment.
; local police and fire services; and roads. Greatest source of state revenue: income & sales taxes. Greatest source of local tax revenue: property & sales taxes. Many states (including Ohio) have a balanced budget amendment.")
12
Supply-Side Economics
Fiscal policy aimed at increasing LAS Income taxes affect LAS by affecting labor supply. Higher income taxes reduce labor supply & reduce LAS “Supply-siders” argue for low marginal tax rates. Graph the effect of an increase in income tax rate on before-tax real wage rate, after-tax real wage rate. Tax-wedge Equilibrium employment LAS

13
Effect of an increase in income tax rate

14
Tax Wedge Comparisons

15
Federal Income Tax Marginal Rates: 2007

16
Top Marginal Tax Rates Source:

17
Historical average tax rates in U. S
Historical average tax rates in U.S. by Income Quintile: Income Tax Only .: Source: Includes individual income tax only

18
Share of Federal Income Taxes Paid by Quintile
.: Source: Includes individual income tax only

19
The Supply-Side: The Laffer Curve.
Tax Revenue Tax Rates

20
Laffer Curve and Capital Gains Tax
Source:

21
The Supply-Side: Investment and Saving
GDP = C + I + G + (X – M) GDP = C + S + T I + G + (X – M) = S + T I = S + (T – G) + (M – X) Private saving PS = S + (M – X) Government Saving GS=T-G I = PS + GS
 GDP = C + S + T. I + G + (X – M) = S + T. I = S + (T – G) + (M – X) Private saving PS = S + (M – X) Government Saving GS=T-G. I = PS + GS.")
22
The Supply-Side: Investment and Saving

23
The Supply-Side: Investment and Saving
Fiscal policy influences investment and saving in two ways: Taxes affect the incentive to save and change the supply of loanable funds. Government saving is a component of total saving and the supply of loanable funds.

24
The Supply-Side: Investment and Saving
A tax on capital income decreases the supply of loanable funds a tax wedge is driven between the interest rate and the after-tax interest rate Investment and saving decrease.

25
The Supply-Side: Investment and Saving
Effect of a government budget deficit on saving and investment -- crowding out

26
The Supply-Side: Investment and Saving
Ricardo-Barro Equivalence In above diagram, it is assumed that government budget does not shift PSLF curve. Ricardo-Barro: Larger deficits cause households to increase savings in order to cover future tax increases. Net effect of larger deficit on SLF curve is zero because PSLF curve shifts right. No effect on investment or interest rates All increases in deficits are offset by increased saving (decreased consumption). Explain the reasoning behind Ricardo-Barro equivalence: A government that has a budget deficit must sell bonds to pay for the goods and services that are not paid for by taxes. And the government must pay interest on those bonds. It must also collect more taxes in the future to pay the interest on the larger quantity of bonds that are outstanding. Taxpayers are rational and have good foresight. They can see that their taxes will be higher in the future and so their disposable income will be lower. Lower expected future disposable income increases saving. And if taxpayers want to neutralize the effects of the budget deficit on their own consumption plans, they increase their own saving by the same amount that the government is dissaving through its deficit. This outcome is extreme and probably does not actually occur.
. Explain the reasoning behind Ricardo-Barro equivalence: A government that has a budget deficit must sell bonds to pay for the goods and services that are not paid for by taxes. And the government must pay interest on those bonds. It must also collect more taxes in the future to pay the interest on the larger quantity of bonds that are outstanding. Taxpayers are rational and have good foresight. They can see that their taxes will be higher in the future and so their disposable income will be lower. Lower expected future disposable income increases saving. And if taxpayers want to neutralize the effects of the budget deficit on their own consumption plans, they increase their own saving by the same amount that the government is dissaving through its deficit. This outcome is extreme and probably does not actually occur.")
27
Generational Effects of Fiscal Policy
Generational accounting is an accounting system that compares the present value of lifetime tax burden with the benefits of each generation. Is the budget deficit a burden on future generations? Is the deficit in the Social Security fund a burden? Does it matter who owns the bonds that the government sells to finance its deficit?

28
Generational Effects of Fiscal Policy
Generational Accounting and Present Value Taxes are paid by people with jobs. Social security benefits are paid to people after they retire. To compare the value of an amount of money at one date (working years) with that at a later date (retirement years), we use the concept of present value.
 with that at a later date (retirement years), we use the concept of present value.")
29
Generational Effects of Fiscal Policy
The Social Security Time Bomb Using generational accounting and present values, economists have found that the federal government is facing a Social Security time bomb! In 2008, the first of the baby boomers will start collecting Social Security pensions and in 2011, they will become eligible for Medicare benefits. By 2030, all the baby boomers will have retired and, compared to 2006, the population supported by Social Security will have doubled.

30
Generational Effects of Fiscal Policy
Under the existing Social Security laws, the federal government has an obligation to pay pensions and Medicare benefits on an already declared scale. Gokhale and Smetters estimated that the fiscal imbalance in Social Security / Medicare was $45 trillion in 2003—4 times the value of total production in 2003 ($11 trillion).
.")
31
Generational Effects of Fiscal Policy
Generational imbalance division of the fiscal imbalance between the current and future generations, assuming that the current generation will enjoy the existing levels of taxes and benefits. The bars show the scale of the fiscal imbalance.

32
Generational Effects of Fiscal Policy
International Debt In June 2006, the United States had a net debt to the rest of the world of $5.2 trillion. Of that debt, $2.2 trillion was U.S. government debt. Total U.S. government debt is $4.1 trillion. More than half of the outstanding government debt is held by foreigners.

33
Stabilizing the Business Cycle
Discretionary fiscal policy action that is initiated by an act of Congress. Automatic fiscal policy (Auto stabilizers) fiscal policy triggered by the state of the economy.
 fiscal policy triggered by the state of the economy.")
34
Stabilizing the Business Cycle
Discretionary Fiscal Stabilization An increase in government expenditure or a tax cut increases aggregate demand. The “multiplier process” increases aggregate demand further.

35
Stabilizing the Business Cycle
A decrease in government expenditure or a tax increase decreases aggregate demand. The multiplier process decreases aggregate demand further.

36
Stabilizing the Business Cycle
Limitations of Discretionary Fiscal Policy Recognition lag time it takes to figure out that fiscal policy action is needed. Law-making lag time it takes Congress to pass the laws needed to change taxes or spending. Impact lag time it takes from passing a tax or spending change to its effect on real GDP being felt. Fiscal policy in practice. Most economists acknowledge that, in principle, discretionary fiscal policy can be used for stabilization purposes, but in practice such stabilization is extremely difficult because of long legislative lags. It is worth reminding the students that the equilibrium in the AS-AD model takes time to work out. The multiplier is a long drawn out process. An increase in government expenditures shifts the AD curve rightward but the new equilibrium price level and real GDP take time to occur. It is also useful to discuss the differences between the potential of fiscal policy under a parliamentary system and under the more rigid U.S. system; the length of time it took the congress to pass the 2002 ‘stimulus’ package, compared to almost immediate executive-initiated changes to fiscal policy in Britain, make the point that discretionary fiscal policy is feasible under some governmental systems but only in extreme circumstances in the world’s largest economy.

37
Stabilizing the Business Cycle
Automatic Stabilizers mechanisms that stabilize real GDP without explicit action by the government. Taxes that rise and fall with GDP taxes and needs-tested spending are automatic stabilizers. When real GDP decreases in a recession wages and profits fall, so taxes fall Needs-tested spending rises Budget deficit grows (surplus shrinks)
")
39
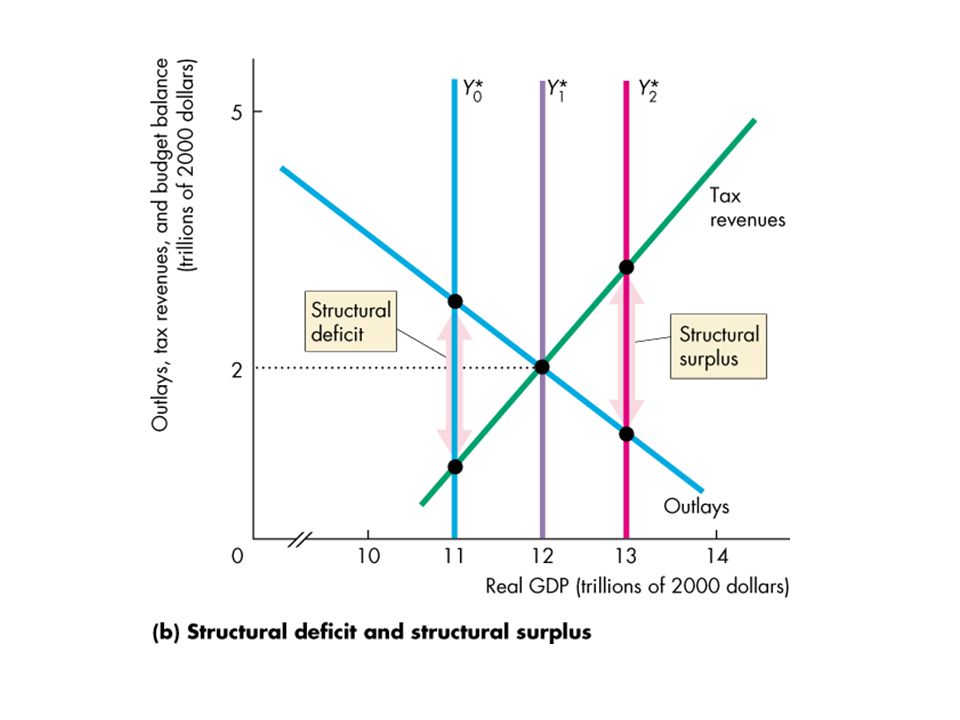
The Budget and the Business Cycle
Cyclical and Structural Balances The structural surplus or deficit the surplus or deficit that would occur if the economy were at full employment and real GDP were equal to potential GDP. The cyclical surplus or deficit the actual surplus or deficit minus the structural surplus or deficit; the surplus or deficit that occurs purely because real GDP does not equal potential GDP. Cyclical and structural budget balances. Cyclical and structural budget balances are a difficult concept for many students, but important because of the appropriate measure of fiscal stance. An effective way to help students see that revenues and outlays will vary as depicted in Figure is to remind them that potential GDP corresponds to full employment, and employment (and so the number of tax payers and recipients of unemployment compensation) changes when real GDP varies.
 changes when real GDP varies.")
40
Stabilizing the Business Cycle

Similar presentations