Download presentation
Presentation is loading. Please wait.

1
Llad Phillips1 Part I Strategies to Estimate Deterrence Part II Optimization of the Criminal Justice System

2
Llad Phillips2 Outline _ Human Capital _ Studying for the Midterm _ Deterrence: _ Evidence pro _ Evidence con

3
Llad Phillips3 About 60% Of 9 th graders Get a diploma somewhere

4
Llad Phillips4 The high Hurdle? Algebra

5
Llad Phillips5

6
6 Studying For the Midterm _ http://econ.ucsb.edu/ http://econ.ucsb.edu/

7
Llad Phillips7

8
8

9
9

10
10

11
Llad Phillips11

12
Llad Phillips12 Part I Strategies to Estimate Deterrence

13
Llad Phillips13 Questions About Crime _ Why is it difficult to empirically demonstrate the control effect of deterrence on crime? _ What is the empirical evidence that raises questions about deterrence? _ What is the empirical evidence that supports deterrence?

14
Llad Phillips14 What is the Empirical Evidence that Supports Deterrence? _ Domestic violence and police intervention _ Experiments with control groups _ Traffic Black Spots _ Focused enforcement efforts

15
Llad Phillips15 Female Victims of Violent Crime

16
Llad Phillips16 Female Victims of Violent Crime _ In 1994 _ 1 homicide for every 23,000 women (12 or older) _ females represented 23% of homicide victims in US _ 9 out of 10 female victims were murdered by males _ 1 rape for every 270 women _ 1 robbery for every 240 women _ 1 assault for every 29 women
 _ females represented 23% of homicide victims in US _ 9 out of 10 female victims were murdered by males _ 1 rape for every 270 women _ 1 robbery for every 240 women _ 1 assault for every 29 women")
17
Victims of Lone Offenders* Annual Average Numbers

18
Llad Phillips18 United States Bureau of Justice Statistics http://www.ojp.usdoj.gov/bjs/

19
Llad Phillips19

20
Llad Phillips20 Average Annual Rate of Violent Victimizations Per 1000 Females

21
Llad Phillips21 Declining Trends in Intimate Violence: Homicide

22
Llad Phillips22 United States Bureau of Justice Statistics

23
Llad Phillips23 United States Bureau of Justice Statistics http://www.ojp.usdoj.gov/bjs/

24
Llad Phillips24 United States Bureau of Justice Statistics http://www.ojp.usdoj.gov/bjs/

25
Llad Phillips25 United States Bureau of Justice Statistics http://www.ojp.usdoj.gov/bjs/

26
Llad Phillips26

27
Llad Phillips27 Domestic Violence in California http://caag.state.ca.us/

28
Llad Phillips28 Domestic Violence Rates in California: 1988-1998 1988: 113.6 per 100.000 1998: 169.9 per 100,000

29
Llad Phillips29 Domestic Violence in California 1988: 94% Male Arrests 1998: 83.5% Male Arrests

30
Llad Phillips30 Police Intervention with Experimental Controls _ A 911 call from a family member _ the case is randomly assigned for “treatment” _ A police patrol responds and visits the household _ police calm down the family members _ based on the treatment randomly assigned, the police carry out the sanctions

31
Llad Phillips31 Why is Treatment Assigned Randomly? _ To control for unknown causal factors _ assign known numbers of cases, for example equal numbers, to each treatment _ with this procedure, there should be an even distribution of difficult cases in each treatment group

32
Llad Phillips32 911 call (characteristics of household Participants unknown) Random Assignment code blue code gold patrol responds settles the household verbally warn the husbandtake the husband to jail for the night
 Random Assignment code blue code gold patrol responds settles the household verbally warn the husbandtake the husband to jail for the night")
33
Llad Phillips33 Traffic Black Spots _ Blood Alley _ Highway 126 _ San Marcos Pass _ Highway 154

34
Los Angeles Traffic Map

35
Llad Phillips35 San Marcos Pass Experiment _ Increase Highway Patrols _ Increase Arrests _ Total accidents decrease _ Injury accidents decrease _ Accidents involving drinking under the influence decrease

36
Llad Phillips36

37
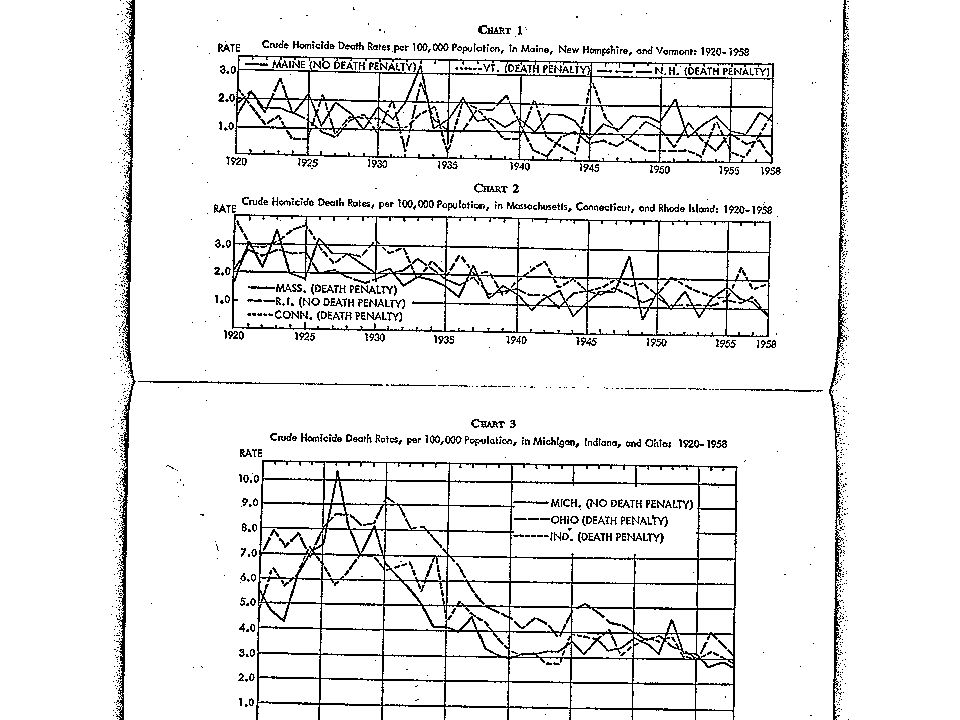
Llad Phillips37 Evidence Against the Death Penalty Being a Deterrent _ Contiguous States _ Maine: no death penalty _ Vermont: death penalty _ New Hampshire: death penalty _ Little Variation in the Homicide Rate _ Source: Study by Thorsten Sellin in Hugo Bedau, The Death Penalty in America

39
Llad Phillips39 Isaac Ehrlich Study of the Death Penalty: 1933-1969 _ Homicide Rate Per Capita _ Control Variables _ probability of arrest _ probability of conviction given charged _ Probability of execution given conviction _ Causal Variables _ labor force participation rate _ unemployment rate _ percent population aged 14-24 years _ permanent income _ trend

40
Ehrlich Results: Elasticities of Homicide with respect to Controls Source: Isaac Ehrlich, “The Deterrent Effect of Capital Punishment

41
Llad Phillips41 Critique of Ehrlich by Death Penalty Opponents _ Time period used: 1933-1968 _ period of declining probability of execution _ Ehrlich did not include probability of imprisonment given conviction as a control variable _ Causal variables included are unconvincing as causes of homicide

42
Llad Phillips42 U.S. United States Bureau of Justice Statistics http://www.ojp.usdoj.gov/bjs/

43
Llad Phillips43 U.S. United States Bureau of Justice Statistics http://www.ojp.usdoj.gov/bjs/

44
Long Swings in the Homicide Rate in the US: 1900-1980 Source: Report to the Nation on Crime and Justice

45
Llad Phillips45 United States Bureau of Justice Statistics http://www.ojp.usdoj.gov/bjs/ Long Swings in The Homicide Rate

46
Llad Phillips46

47
Llad Phillips47 Part II Optimization of the Criminal Justice System

48
Llad Phillips48 Questions About Statistical Studies of Deterrence _ Do we know enough about the factors that cause crime? _ Can we find variables that will control for variation in crime generation? _ We have better measures for the factors that control crime than for the factors that cause crime. _ Unknown variation in crime generation may mask the effects of crime control.

49
Llad Phillips49 Crime Generation Crime Control Offense Rate Per Capita Expected Cost of Punishment Schematic of the Criminal Justice System Causes ? (detention, deterrence) Expenditures Weak Link
 Expenditures Weak Link.")
50
Crime Generation 1. variation of offense rate per capita with expected cost of punishment 2. Shift in the relationship with a change in causal factors Offense rate per capita Expected cost(severity) of punishment crime generation function
 of punishment crime generation function.")
51
Crime Generation 1. variation of offense rate per capita with expected cost of punishment 2. Shift in the relationship with a change in causal factors Offense rate per capita Expected cost(severity) of punishment crime generation function High causal conditions Low causal conditions
 of punishment crime generation function High causal conditions Low causal conditions.")
52
Production Function for the Criminal Justice System (CJS) 1. Variation in expected costs of punishment with criminal justice system expenditure per capita Expected costs of punishment Criminal Justice System expenditures per capita production function

53
per capita expenditures on CJS offense rate per capita expected cost of punishment Crime Generation Four-Way Diagram: Crime Generation & Crime Control

54
per capita expenditures on CJS offense rate per capita expected cost of punishment Crime Generation Four-Way Diagram: Crime Generation & Crime Control per capita expenditures on CJS Production Function

55
per capita expenditures on CJS offense rate per capita expected cost of punishment Crime Generation Four-Way Diagram: Crime Generation & Crime Control per capita expenditures on CJS Production Function square 45 0

56
per capita expenditures on CJS offense rate per capita expected cost of punishment Crime Generation Four-Way Diagram: Crime Generation & Crime Control per capita expenditures on CJS Production Function square 45 0 1 1

57
per capita expenditures on CJS offense rate per capita expected cost of punishment Crime Generation Four-Way Diagram: Crime Generation & Crime Control per capita expenditures on CJS Production Function square 45 0 1 1

58
per capita expenditures on CJS offense rate per capita expected cost of punishment Crime Generation Four-Way Diagram: Crime Generation & Crime Control per capita expenditures on CJS Production Function square 45 0 1 1

59
per capita expenditures on CJS offense rate per capita expected cost of punishment Crime Generation Four-Way Diagram: Crime Generation & Crime Control per capita expenditures on CJS Production Function square 45 0 1 1

60
per capita expenditures on CJS offense rate per capita expected cost of punishment Crime Generation Four-Way Diagram: Crime Generation & Crime Control per capita expenditures on CJS Production Function square 45 0 1 1 2 2

61
per capita expenditures on CJS offense rate per capita expected cost of punishment Crime Generation Four-Way Diagram: Crime Generation & Crime Control per capita expenditures on CJS Production Function square 45 0 1 1 2 2 3

62
per capita expenditures on CJS offense rate per capita Four-Way Diagram: Crime Generation & Crime Control 1 2 3

63
Source: Report to the Nation on Crime and Justice

64
per capita expenditures on CJS offense rate per capita expected cost of punishment Crime Generation Four-Way Diagram: Crime Generation & Crime Control per capita expenditures on CJS Production Function square 45 0 1 1 2 2 3

65
Source: Report to the Nation on Crime and Justice control Causal factors

66
Expenditures per Capita Offenses Per Capita Crime Control Technology South Dakota North Dakota 2500 Index crimes per 100,000 people $100 $0 0

67
Llad Phillips67 Optimization of the Criminal Justice System (CJS) _ Minimize damages to victims plus the costs of control, subject to the crime control technology _ damages to victims per capita = loss rate per offense * offense rate per capita _ Costs of control = per capita expenditures on CJS _ Total cost = damages + expenditures
 _ Minimize damages to victims plus the costs of control, subject to the crime control technology _ damages to victims per capita = loss rate per offense * offense rate per capita _ Costs of control = per capita expenditures on CJS _ Total cost = damages + expenditures")
68
Expenditures per Capita Offenses Per Capita Crime Control Technology South Dakota North Dakota 2500 Index crimes per 100,000 people $100 Total cost = expenditures per capita $200 $0 0

69
Expenditures per Capita Offenses Per Capita Crime Control Technology South Dakota North Dakota 2500 Index crimes per 100,000 people $100 Total cost = expenditures per capita Total cost = damages to victims $200 $0 0 5000 Index offenses per 100,000 people = 0.05 per capita

70
Llad Phillips70 Expenditures per Capita Offenses Per Capita Crime Control Technology South Dakota North Dakota 0.025 Index crimes per capita $100 Total cost = expenditures per capita Total cost = damages to victims 0.050 Total cost = $200 per capita = damages to victims = loss rate*0.05 so loss rate = $4,000 per Index Crime in South Dakota $200 $0 0

71
Source: Phillips: Lecture One

72
Llad Phillips72 Expenditures per capita Offenses Per Capita 2500 Index crimes per 100,000 people $100 Total cost = expenditures per capita Total cost = damages to victims Family of Total Cost Curves High Low

73
Llad Phillips73 Expenditures per Capita Offenses Per Capita Crime Control Technology South Dakota North Dakota 2500 Index crimes per 100,000 people $100 Total cost = expenditures per capita Total cost = damages to victims

74
Llad Phillips74 Application of the Economic Paradigm _ Specify the feasible options _ the states of the world: Crime control technology _ Value the options _ loss rate per offense _ Optimize _ Pick the lowest cost point on the crime control technology

76
Llad Phillips76 Female Victims of Violent Crime

Similar presentations


 FBI Compiles data from the nation’s law enforcement agencies on crime for: Numbers of arrests Reports of crimes This is the.>")


 F Practical:>")


 Isolating Deterrence.>")
