Download presentation
Presentation is loading. Please wait.

1
Earth Observing Systems SPOT 4 Terra

2
Digital Image Processing and Analysis – Xinjiang University Satellite Observing Systems Two main remote sensing missions – Earth resources – Weather and Atmosphere Two main orbit types – Polar orbiting – Geosynchronous

3
Digital Image Processing and Analysis – Xinjiang University Two main remote sensing missions – Earth resources All are in near-polar orbits, 700 – 900 km alt. – Weather and Atmosphere Use both orbit types – Near-polar (700 – 900 km altitude) – Geosynchronous (35,900 km altitude) Satellite Observing Systems
 – Geosynchronous (35,900 km altitude) Satellite Observing Systems.")
4
Digital Image Processing and Analysis – Xinjiang University Two main orbit types – Polar (near polar) – Geosynchronous GOMS (Russian Federation) METEOSAT (EUMETSAT) GMS (Japan) GOES East (USA) GOES West (USA) Near-polar (700 – 900 km) Geosynchronous (35,900 km) Satellite Observing Systems
 – Geosynchronous GOMS (Russian Federation) METEOSAT (EUMETSAT) GMS (Japan) GOES East (USA) GOES West (USA) Near-polar (700 – 900 km) Geosynchronous (35,900 km) Satellite Observing Systems")
5
Current ER-EOS Satellites:Current ER-EOS Satellites: –Landsat 5 & (7) (NASA) –TERRA (NASA) –EO-1 (NASA) –AQUA (NASA) –IKONOS (Space Imaging Corp., USA) –QUICKBIRD (DigitalGlobe Corp., USA) –SPOT (SPOT Image Corp., France) –ERS (ESA) –ENVISAT (ESA) –ADEOS (Japan) –IRS (India) –RADARSAT (RSI, Ltd., Canada) –JERS (Japan) Satellite Observing Systems
 (NASA) –TERRA (NASA) –EO-1 (NASA) –AQUA (NASA) –IKONOS (Space Imaging Corp., USA) –QUICKBIRD (DigitalGlobe Corp., USA) –SPOT (SPOT Image Corp., France) –ERS (ESA) –ENVISAT (ESA) –ADEOS (Japan) –IRS (India) –RADARSAT (RSI, Ltd., Canada) –JERS (Japan) Satellite Observing Systems")
6
Digital Image Processing and Analysis – Xinjiang University ER - EOS Orbits The orbital inclination and altitude Near-polar orbit

7
Digital Image Processing and Analysis – Xinjiang University ER - EOS Orbits The sensor swath width (Landsat example)
")
8
Digital Image Processing and Analysis – Xinjiang University ER - EOS Orbits The repeat cycle and coverage pattern (Landsat example) Landsat 5 & 7 each have a 16-day repeat cycle For Landsat 5 & 7, the adjacent scene to the west is acquired 7 days later
 Landsat 5 & 7 each have a 16-day repeat cycle For Landsat 5 & 7, the adjacent scene to the west is acquired 7 days later")
9
Digital Image Processing and Analysis – Xinjiang University ER - EOS Orbits Sun-synchronous orbitSun-synchronous orbit (Landsat example) The mean sun time at each individual point in the orbit will remain fixed. All points at a given latitude on each orbital pass will have the same mean sun time.

10
Digital Image Processing and Analysis – Xinjiang University ER - EOS Orbits Sun-synchronous orbits –Do NOT control seasonal sun-elevation differences

11
Digital Image Processing and Analysis – Xinjiang University Digital (electronic) Sensors Spatial resolutionSpatial resolution is based on Detector element size Flight altitude Lens focal length
 Sensors Spatial resolutionSpatial resolution is based on Detector element size Flight altitude Lens focal length")
12
Digital Image Processing and Analysis – Xinjiang University Digital (electronic) Sensors Radiometric resolutionRadiometric resolution refers to the number of discrete levels of light that the sensor can detect Number of bits = exponent of 2Number of bits = exponent of 2 8-bit = 2 8 = 256 levels 11-bit = 2 11 = 2048 levels 11-bit = 2 11 = 2048 levels 12-bit = 2 12 = 4096 levels 12-bit = 2 12 = 4096 levels 14-bit = 2 14 = 16384 levels 14-bit = 2 14 = 16384 levels 16-bit = 2 16 = 65536 levels 16-bit = 2 16 = 65536 levels
 Sensors Radiometric resolutionRadiometric resolution refers to the number of discrete levels of light that the sensor can detect Number of bits = exponent of 2Number of bits = exponent of 2 8-bit = 2 8 = 256 levels 11-bit = 2 11 = 2048 levels 11-bit = 2 11 = 2048 levels 12-bit = 2 12 = 4096 levels 12-bit = 2 12 = 4096 levels 14-bit = 2 14 = levels 14-bit = 2 14 = levels 16-bit = 2 16 = levels 16-bit = 2 16 = levels")
13
Digital Image Processing and Analysis – Xinjiang University Landsat: NASA Six spacecraft to date, in three versions Landsat 1 – 3 Landsat 4 – 5 Landsat 7 All whiskbroom sensors

14
Digital Image Processing and Analysis – Xinjiang University Landsat-5: NASA Mission Date: March 1, 1984 to present Mission Type: Earth resource-land Orbit Type: Near-polar, sun-synchronous Repeat cycle: 16 days Payload: MSS - Multispectral Scanner & TM: Thematic Mapper Resolution: 75m30m (except Band 6) Swath: 185km 185km Bands ( m): 1) 0.50 – 0.60 1) 0.45 – 0.52 2) 0.60 – 0.70 2) 0.52 – 0.60 3) 0.70 – 0.83 3) 0.63 – 0.69 4) 0.8 – 1.1 4) 0.76 – 0. 90 5) 1.55 – 1.75 6) 10.4 – 12.5 (120 m resolution) 7) 2.08 – 2.35
 1.55 – ) 10.4 – 12.5 (120 m resolution) 7) 2.08 –")
15
Digital Image Processing and Analysis – Xinjiang University Landsat-6: NASA Mission Date: October 5, 1993 Mission Type: Earth resource-land Orbit Type: Near-polar, sun-synchronous Repeat cycle: 16 days Payload: ETM – Enhanced Thematic Mapper –Satellite failed to orbit due to malfunction with the final rocket motor Oops!

16
Digital Image Processing and Analysis – Xinjiang University Landsat-7: NASA SLC broke May 31, 2003 Mission Date: April 15, 1999 to present (SLC broke May 31, 2003) Mission Type: Earth resource-land Orbit Type: Near-polar, sun-synchronous Repeat cycle: 16 days Payload: Enhanced Thematic Mapper Plus (ETM+) Resolution: 30m (except Bands 6 and 8) Swath: 185km Bands ( m): 1) 0.45 – 0.53blue-green 2) 0.52 – 0.60green 3) 0.63 – 0.69 red 4) 0.76 – 0. 90NIR 5) 1.55 – 1.75SWIR 1 6) 10.4 – 12.5 (60 m)TIR 7) 2.08 – 2.35SWIR 2 8) 0.50 – 0.90 (15 m)Green - NIR
 1.55 – 1.75SWIR 1 6) 10.4 – 12.5 (60 m)TIR 7) 2.08 – 2.35SWIR 2 8) 0.50 – 0.90 (15 m)Green - NIR.")
17
Digital Image Processing and Analysis – Xinjiang University Landsat 5 & 7 Payload – TM & ETM+ sensors – spectral resolution Green Vegetation Senescent vegetation Bare soil Band 2 Band 3 Band 4 Band 5Band 7 Band 1 Landsat 5 TM Landsat 7 ETM+ Band 8 (ETM+ only)
")
18
Digital Image Processing and Analysis – Xinjiang University The Worldwide Reference System (WRS) Landsat 5 & 7
 Landsat 5 & 7")
19
Digital Image Processing and Analysis – Xinjiang University Landsat 7 Payload – ETM+ sensor – spatial resolution Landsat ETM+ 15m

20
Digital Image Processing and Analysis – Xinjiang University Spatial resolution Landsat 5 & 7 30 m UPLA bldg. Comm. Arts bldg. Wilson

21
Digital Image Processing and Analysis – Xinjiang University Five spacecraft to date, in three versions SPOT 1 – 3 SPOT 4 SPOT 5 All pushbroom sensors SPOT: SPOT Image Corp (France)
")
22
Digital Image Processing and Analysis – Xinjiang University Mission Dates: SPOT 1: Feb 22,1986 – present (on-orbit spare) SPOT 2: Jan 22, 1990 – present SPOT 3: Sep 26,1993 – Nov 14, 1997 Mission Type: Earth resource-land Orbit Type: Near-polar, sun-synchronous Repeat cycle: 26 days (single spacecraft, nadir only) Swath: 60 km HRV Payload: Two identical HRV imagers Resolution: 20 m multispectral (XS) & 10 m panchromatic (P) Bands ( m): b1) 0.50 - 0.59green b2) 0.61 - 0.68red b3) 0.79 - 0.89NIR P) 0.51 - 0.73pan SPOT 1 - 3
 SPOT 2: Jan 22, 1990 – present SPOT 3: Sep 26,1993 – Nov 14, 1997 Mission Type: Earth resource-land Orbit Type: Near-polar, sun-synchronous Repeat cycle: 26 days (single spacecraft, nadir only) Swath: 60 km HRV Payload: Two identical HRV imagers Resolution: 20 m multispectral (XS) & 10 m panchromatic (P) Bands ( m): b1) green b2) red b3) NIR P) pan SPOT 1 - 3")
23
Digital Image Processing and Analysis – Xinjiang University Mission Date: Mar 24,1998 – present Mission Type: Earth resource-land Orbit Type: Near-polar, sun-synchronous Repeat cycle: 26 days (single spacecraft, nadir only) Swath width: 60 km HRVIR Payload (1 of 2): Two identical HRVIR imagers Resolution: 20 m multispectral (Xi) & 10 m monospectral (M) Bands ( m): b1) 0.50 - 0.59 (green) 0.61 - 0.68 (red) b2) 0.61 - 0.68* (red) b3) 0.79 - 0.89 (NIR) b4) 1.58 - 1.75 (SWIR) * 10 x 10 m red band (monospectral) is averaged 2 x 2 to create a 20 m red-band for the multispectral data set SPOT 4
 Swath width: 60 km HRVIR Payload (1 of 2): Two identical HRVIR imagers Resolution: 20 m multispectral (Xi) & 10 m monospectral (M) Bands ( m): b1) (green) (red) b2) * (red) b3) (NIR) b4) (SWIR) * 10 x 10 m red band (monospectral) is averaged 2 x 2 to create a 20 m red-band for the multispectral data set SPOT 4")
24
Digital Image Processing and Analysis – Xinjiang University Vegetation 1 Payload (2 of 2): Vegetation 1 Resolution: 1000 m Swath width: 2,250 km Bands ( m): B0) 0.43 to 0.47 blue B2) 0.61 - 0.68red B3) 0.78 - 0.89NIR SWIR)1.58 - 1.75 SWIR SPOT 4
: Vegetation 1 Resolution: 1000 m Swath width: 2,250 km Bands ( m): B0) 0.43 to 0.47 blue B2) red B3) NIR SWIR) SWIR SPOT 4")
25
Digital Image Processing and Analysis – Xinjiang University Mission Date: May 4,2002 – present Mission Type: Earth resource-land Orbit Type: Near-polar, sun-synchronous Repeat cycle: 26 days (single spacecraft, nadir only) Swath width: 60 km HRG Payload (1 of 2): Two identical HRG imagers Resolution: 10 & 20 m multispectral 2.5 & 5 m panchromatic Bands ( m): b1) 0.50 - 0.59 (green) [10m] P) 0.48 - 0.71 [5m] b2) 0.61 - 0.68 (red) [10m] b3) 0.79 - 0.89 (NIR) [10m] b4) 1.58 - 1.75 (SWIR) [20 m] SPOT 5
![Digital Image Processing and Analysis – Xinjiang University Mission Date: May 4,2002 – present Mission Type: Earth resource-land Orbit Type: Near-polar, sun-synchronous Repeat cycle: 26 days (single spacecraft, nadir only) Swath width: 60 km HRG Payload (1 of 2): Two identical HRG imagers Resolution: 10 & 20 m multispectral 2.5 & 5 m panchromatic Bands ( m): b1) (green) [10m] P) [5m] b2) (red) [10m] b3) (NIR) [10m] b4) (SWIR) [20 m] SPOT 5](http://images.slideplayer.com/16/5131944/slides/slide_25.jpg "Digital Image Processing and Analysis – Xinjiang University Mission Date: May 4,2002 – present Mission Type: Earth resource-land Orbit Type: Near-polar, sun-synchronous Repeat cycle: 26 days (single spacecraft, nadir only) Swath width: 60 km HRG Payload (1 of 2): Two identical HRG imagers Resolution: 10 & 20 m multispectral 2.5 & 5 m panchromatic Bands ( m): b1) (green) [10m] P) [5m] b2) (red) [10m] b3) (NIR) [10m] b4) (SWIR) [20 m] SPOT 5")
26
Digital Image Processing and Analysis – Xinjiang University Vegetation 2 Payload (2 of 2): Vegetation 2 Resolution: 1000 m Swath width: 2,250 km Bands ( m): B0) 0.43 to 0.47 blue B2) 0.61 - 0.68red B3) 0.78 - 0.89NIR SWIR)1.58 - 1.75 SWIR SPOT 5
: Vegetation 2 Resolution: 1000 m Swath width: 2,250 km Bands ( m): B0) 0.43 to 0.47 blue B2) red B3) NIR SWIR) SWIR SPOT 5")
27
Digital Image Processing and Analysis – Xinjiang University Pushbroom CCD arrays SPOT Imagers

28
Digital Image Processing and Analysis – Xinjiang University Pointable imagers The two HR imaging instruments on each SPOT satellite are programmable for independent image acquisition, increasing the total number of imaging opportunities. It is possible to change the view direction of one instrument without affecting the quality of the images acquired at the same time by the other instrument. SPOT Imagers

29
Digital Image Processing and Analysis – Xinjiang University A Base/Height (B/H) ratio of 1.0 can be obtained for a viewing angle of 24 degrees to the East and to the West. For a stereopair comprising a vertical view and one acquired at 27 degrees, a B/H of 0.5 is obtained. Stereo Acquisition

30
Digital Image Processing and Analysis – Xinjiang University Three satellites working together every day Above 40° latitude, any point on earth can be imaged every day. At the equator, on any given day, only a small strip about 250 km wide is not accessible ( out of the 2,800 km separating two consecutive SPOT tracks ). SPOT Constellation
. SPOT Constellation.")
31
Digital Image Processing and Analysis – Xinjiang University Terra Satellite Since 1988, teams have been funded to develop both hardware and algorithms of then EOS-AM satellite, which later was renamed as Terra. This name implies that the major applications are terrestrial. The follow-on mission was subsequently renamed from EOS-PM to Aqua, implying the applications are primarily on “water.”

32
Digital Image Processing and Analysis – Xinjiang University

34
http://terra.nasa.gov
35
http://eos-am.gsfc.nasa.gov/index.html
36
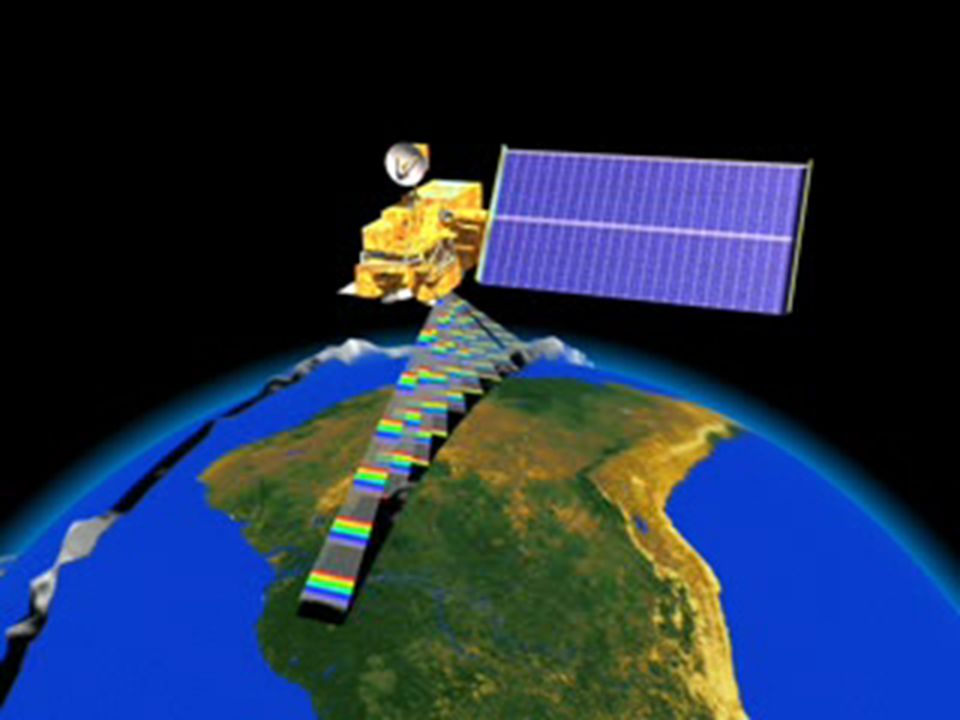
Digital Image Processing and Analysis – Xinjiang University Terra: NASA Mission Date: December 18, 1999 to present Mission/orbit type: Earth resource-land / sun-synchronous Orbit parameters: Altitude = 705 km, 98 o inclination, 10:30 a.m. descending node crossing Repeat cycle: 16 day (platform overpass) Payload: ASTER, CERES, MISR, MODIS, MOPITT Resolution: Variable by instrument: 15 m – 1000 m Swath: Variable by instrument : 60 km – 2330 km Bands: Variable by instrument
 Payload: ASTER, CERES, MISR, MODIS, MOPITT Resolution: Variable by instrument: 15 m – 1000 m Swath: Variable by instrument : 60 km – 2330 km Bands: Variable by instrument.")
37
Digital Image Processing and Analysis – Xinjiang University Terra: NASA Dimensions: 5.9 x 1.7 x 2.0 m Total mass: 5,190 kg Payload mass: 1,172 kg Total power: 2.4 kW avg; 3.0 kW peak Payload power: 1.2 kW avg; 1.7 kW peak “the size of a small school bus” ASTER MODIS Earth View

38
Digital Image Processing and Analysis – Xinjiang University Terra: NASA

39
Digital Image Processing and Analysis – Xinjiang University Terra: NASA ASTER The Advanced Spaceborne Thermal Emission and Reflection Radiometer obtains high-resolution (15 to 90 square meters per pixel) images of the Earth in 14 different wavelengths of the electromagnetic spectrum, ranging from visible to thermal infrared. The only high spatial resolution instrument on the Terra Platform. Will does not collect data continuously; it collects an average of 8 minutes of data (investigator requested) per orbit. All three ASTER telescopes (VNIR, SWIR, and TIR) are pointable in the crosstrack direction. VNIR produces stereoscopic images which can be processed into detailed terrain height models.
 per orbit. All three ASTER telescopes (VNIR, SWIR, and TIR) are pointable in the crosstrack direction. VNIR produces stereoscopic images which can be processed into detailed terrain height models..")
40
Digital Image Processing and Analysis – Xinjiang University Terra: NASA ASTER -- VNIR Spectral RangeBand 1: 0.52 - 0.60 µm Nadir looking Band 2: 0.63 - 0.69 µm Nadir looking Band 3: 0.76 - 0.86 µm Nadir looking Band 3: 0.76 - 0.86 µmBackward looking Ground Resolution15 m Cross-track Pointing (km)±318 Quantization (bits)8
±318 Quantization (bits)8")
41
Digital Image Processing and Analysis – Xinjiang University Terra: NASA ASTER -- SWIR Spectral RangeBand 4: 1.600 - 1.700 µm Band 5: 2.145 - 2.185 µm Band 6: 2.185 - 2.225 µm Band 7: 2.235 - 2.285 µm Band 8: 2.295 - 2.365 µm Band 9: 2.360 - 2.430 µm Ground Resolution30m Cross-track Pointing (km)±116 Quantization (bits)8
±116 Quantization (bits)8")
42
Digital Image Processing and Analysis – Xinjiang University Terra: NASA ASTER -- TIR Spectral RangeBand 10: 8.125 -8.475 µm Band 11: 8.475 - 8.825 µm Band 12: 8.925 - 9.275 µm Band 13: 10.25 - 10.95 µm Band 14: 10.95 - 11.65 µm Ground Resolution90m Cross-track Pointing (km)±116 Quantization (bits)12
±116 Quantization (bits)12")
43
Digital Image Processing and Analysis – Xinjiang University Terra: NASA Washington, D.C. was imaged by ASTER on June 1, 2000 in this 14 by 13.7 km sub-scene. The 15 m spatial resolution allows us to see individual buildings

44
Digital Image Processing and Analysis – Xinjiang University Terra: NASA This full-scene (60 by 60 km), ASTER - VNIR image of the Saline Valley area, California, was acquired March 30, 2000. Vegetation appears red, snow and dry salt lakes are white, and exposed rocks are brown, gray, yellow and blue. Rock colors mainly reflect the presence of iron minerals, and variations in albedo. VNIR

45
Digital Image Processing and Analysis – Xinjiang University Terra: NASA SWIR This ASTER image displays short-wavelength infrared bands 4, 6, and 8 as RGB. In this wavelength region, clay, carbonate, and sulfate minerals have diagnostic absorption features, resulting in distinct colors on the image. For example, limestone is yellow-green, and purple areas are kaolinite-rich.

46
Digital Image Processing and Analysis – Xinjiang University Terra: NASA TIR This ASTER image displays thermal infrared bands 13, 12 and 10 as RGB. In this wavelength region, variations in quartz content appear as more or less red; carbonate rocks are green, and mafic volcanic rocks are purple.

47
Digital Image Processing and Analysis – Xinjiang University Terra: NASA This color-coded, suspended- sediment image was created from ASTER band 1 by blacking out the land, and assigning colors to the relative brightnesses in the water. High values are colored white, then red, yellow, green, blue. Brighter values in Band 1 indicate higher sediment load in the water. The highest values are in Suisun and San Pablo Bays, and along the coast of the San Francisco Peninsula. The Pacific Ocean and San Francisco Bay water are relatively clear.

48
Digital Image Processing and Analysis – Xinjiang University Terra: NASA The color-coded, water-temperature image was created from one of ASTER’s thermal IR bands by blacking out the land, and assigning colors to the relative temperature values: White is warmest, followed by yellow, orange, red, and blue as the coldest. Cold water flows from the Sacramento River and enters Suisun Bay in the northeast corner. The water warms up in San Pablo Bay, enters San Francisco Bay, and some flows out through the Golden Gate into the Pacific.

49
Digital Image Processing and Analysis – Xinjiang University Terra: NASA This ASTER image of the recent eruption (July - August, 2001 ) of Mt. Etna was acquired on July 29. Advancing lava flows on the southern flank of Mt. Etna threaten the town of Nicolosi. Also visible are glowing summit craters above the main lava flows, and a small fissure eruption. The bright puffy clouds were formed from water vapor released during the eruption. The image covers an area of 24 x 30 km.

50
Digital Image Processing and Analysis – Xinjiang University Terra: NASA

51
Digital Image Processing and Analysis – Xinjiang University Terra: NASA MODIS A 2,330-km-wide viewing swath. It can image every point on earth within every 1-2 days (weather permitting). Provides high radiometric sensitivity (12 bits) in 36 spectral bands ranging in wavelength from 0.4 µm to 14.4 µm. Two bands are imaged at a resolution of 250 m at nadir, five bands are imaged at a resolution of 500 m and the remaining 29 bands are imaged at a resolution of 1,000 m.
. Provides high radiometric sensitivity (12 bits) in 36 spectral bands ranging in wavelength from 0.4 µm to 14.4 µm. Two bands are imaged at a resolution of 250 m at nadir, five bands are imaged at a resolution of 500 m and the remaining 29 bands are imaged at a resolution of 1,000 m..")
52
Digital Image Processing and Analysis – Xinjiang University Terra: NASA MODIS The Scan Mirror Assembly uses a continuously rotating (20.3 rpm, cross track), double-sided scan mirror to scan ±55 degrees. The optical system consists of a two-mirror, off-axis telescope which directs energy to four refractive objective assemblies, one for each of the VIS, NIR, SWIR and TIR spectral regions. The system includes four on-board calibrators as well as a view to space (for thermal calibration).
..")
53
Digital Image Processing and Analysis – Xinjiang University Terra: NASA MODIS

54
Digital Image Processing and Analysis – Xinjiang University Terra: NASA MODIS bands: Primary UseBandBandwidthPixel Size Land/Cloud/Aerosols Boundaries1 620 – 670 nm 250 m 2 841 – 876 nm 250 m Land/Cloud/Aerosols Properties 3 459 – 479 nm 500 m 4 545 – 565 nm 500 m 5 1230 – 1250 nm 500 m 6 1628 – 1652 nm 500 m 7 2105 – 2155 nm 500 m

55
Digital Image Processing and Analysis – Xinjiang University Terra: NASA MODIS bands: Primary UseBandBandwidthPixel Size Ocean Color / Phytoplankton / Biogeochemistry8 405 – 420 nm1000 m 9 438 – 448 nm1000 m 10 483 – 493 nm1000 m 11 526 – 536 nm1000 m 12 546 – 556 nm1000 m 13 662 – 672 nm1000 m 14 673 – 683 nm1000 m 15 743 – 753 nm1000 m 16 862 – 877 nm1000 m

56
Digital Image Processing and Analysis – Xinjiang University Terra: NASA MODIS bands: Primary UseBandBandwidthPixel Size Atmospheric Water Vapor17 890 – 920 nm1000 m 18 931 – 941 nm1000 m 19 915 – 965 nm1000 m Surface/Cloud Temperature20 3.660 - 3.840 µm1000 m 21 3.929 - 3.989 µm1000 m 22 3.929 - 3.989 µm1000 m 23 4.020 - 4.080 µm1000 m Atmospheric Temperature24 4.433 - 4.498 µm1000 m 25 4.482 - 4.549 µm1000 m

57
Digital Image Processing and Analysis – Xinjiang University Terra: NASA MODIS bands: Primary UseBandBandwidthPixel Size Cirrus Clouds Water Vapor26 1.360 - 1.390 µm1000 m 27 6.535 - 6.895 µm1000 m 28 7.175 - 7.475 µm1000 m Cloud Properties29 8.400 - 8.700 µm 1000 m Ozone30 9.580 - 9.880 µm1000 m

58
Digital Image Processing and Analysis – Xinjiang University Terra: NASA MODIS bands: Primary UseBandBandwidthPixel Size Surface/Cloud Temperature31 10.780 - 11.280 µm1000 m 32 11.770 - 12.270 µm1000 m Cloud Top Altitude33 13.185 - 13.485 µm1000 m 34 13.485 - 13.785 µm1000 m 35 13.785 - 14.085 µm1000 m 36 14.085 - 14.385 µm1000 m

59
Digital Image Processing and Analysis – Xinjiang University Terra: MODIS

60
Digital Image Processing and Analysis – Xinjiang University Terra: MODIS

61
Digital Image Processing and Analysis – Xinjiang University Terra: MODIS

62
Digital Image Processing and Analysis – Xinjiang University Terra: MODIS

63
Digital Image Processing and Analysis – Xinjiang University Terra: MODIS

64
Digital Image Processing and Analysis – Xinjiang University Terra: MODIS

65
Digital Image Processing and Analysis – Xinjiang University Terra: MODIS MODIS image showing the large plume of smoke streaming southward from the remnants of the burning World Trade Towers in downtown Manhattan (September 11, 2001). From MODIS direct broadcast data received at the University of Wisconsin-Madison.

66
Terra: MODIS http://modis.gsfc.nasa.gov/

67
Terra: MODIS http://eospso.gsfc.nasa.gov/atbd/modistables.html

68
Terra: MODIS http://eospso.gsfc.nasa.gov/atbd/modistables.html

69
Digital Image Processing and Analysis – Xinjiang University Launched on Saturday morning (2:55 a.m., PDT), May 4, 2002 Orbit: 705km http://aqua.nasa.gov/ AQUA
, May 4, 2002 Orbit: 705km AQUA")
70
Aqua carries six state-of-the-art instruments in a near-polar low-Earth orbit. The six instruments are the Atmospheric Infrared Sounder (AIRS), the Advanced Microwave Sounding Unit (AMSU-A), the Humidity Sounder for Brazil (HSB), the Advanced Microwave Scanning Radiometer for EOS (AMSR-E), the Moderate-Resolution Imaging Spectroradiometer (MODIS), and Clouds and the Earth's Radiant Energy System (CERES).
, the Advanced Microwave Sounding Unit (AMSU-A), the Humidity Sounder for Brazil (HSB), the Advanced Microwave Scanning Radiometer for EOS (AMSR-E), the Moderate-Resolution Imaging Spectroradiometer (MODIS), and Clouds and the Earth s Radiant Energy System (CERES)..")
71
AIRS - atmospheric Infrared Sounder Infrared Spectral CoverageRadiometric Calibration± 3% absolute error 3.74 - 4.61 µm Power / Mass 256 W / 166 kg 6.20 - 8.22 µm Lifetime 5 years 8.80 - 15.4 µm Spectral ResponseVisible Spectral Coverage 0.41 - 0.44 µm Spectral Resolution >1200 nominal 0.58 - 0.68 µm Spectral Sampling /2 0.71 - 0.92 µm Integrated Response (95%)±1 0.49 - 0.94 µm Wavelength Stability 0.05 24 hours Wavelength Knowledge.0.01 Spatial Coverage Scan Angle±49.5° around nadirScan Angle±49.5° around nadir IFOV1.1° IFOV.0.185° Measurement Simultaneity.>(9% SNR @ Albedo = 0.4 >100 Polarization<5% Sensitivity (NEDT)0.14 K at 4.2 µm 0.20 K from 3.7 - 13.6 µm 0.35 K from 13.6 - 15.4 µm
±1 µm Wavelength Stability 0.05 24 hours Wavelength Knowledge.0.01 Spatial Coverage Scan Angle±49.5° around nadirScan Angle±49.5° around nadir IFOV1.1° IFOV.0.185° Measurement Simultaneity.>(9% Albedo = 0.4 >100 Polarization<5% Sensitivity (NEDT)0.14 K at 4.2 µm 0.20 K from µm 0.35 K from µm")
72
Digital Image Processing and Analysis – Xinjiang University AMSR-E: Advanced Microwave Scanning Radiometer for EOS AMSR-E PERFORMANCE CHARACTERISTICS CENTER FREQUENCIES (GHz)6.925 10.65 18.7 23.8 36.5 89.0 BANDWIDTH (MHz)350 100 200 400 1000 3000 SENSITIVITY (K)0.3 0.6 0.6 0.6 0.6 1.1 SPATIAL RES. (km)56 38 21 24 12 5.4 IFOV(km x km)74x43 51x30 27x16 31x18 14x8 6x 4 SAMPLING RATE(kmxkm) 10x10 10x10 10x10 10x10 10x10 5x5 INTEGRATION T. (msec) 2.6 2.6 2.6 2.6 2.6 1.3 BEAM EFFICIENCY(%) 95.3 95.0 96.3 96.4 95.3 96.0 BEAMWIDTH (degrees) 2.2 1.4 0.8 0.90 0.4 0.18
 IFOV(km x km)74x43 51x30 27x16 31x18 14x8 6x 4 SAMPLING RATE(kmxkm) 10x10 10x10 10x10 10x10 10x10 5x5 INTEGRATION T. (msec) BEAM EFFICIENCY(%) BEAMWIDTH (degrees)")
73
AMSU- Meteorological Satellite Sensors AMSU Facts HeritageMicrowave Sounding Unit (MSU) Swath1650 km Spatial Resolution40 km horizontal at nadir Mass100 kg Duty Cycle100% Power125 Watts Data Rate3.2 kbps Thermal Control ByHeater, central thermal bus,radiator Thermal Operating Range0 to 20°C Field of View (FOV)±49.5° Instrument Instantaneous FOV3.3° Pointing Requirements (Platform + Instrument, 3σ) Control720 arcsec Knowledge360 arcsec Stability360 arcsec/sec Jitter360 arcsec/sec Physical Size65.5 x 29.9 x 59.2 cm (A1) 54.6 x 64.9 x 69.7 cm (A2)
 Swath1650 km Spatial Resolution40 km horizontal at nadir Mass100 kg Duty Cycle100% Power125 Watts Data Rate3.2 kbps Thermal Control ByHeater, central thermal bus,radiator Thermal Operating Range0 to 20°C Field of View (FOV)±49.5° Instrument Instantaneous FOV3.3° Pointing Requirements (Platform + Instrument, 3σ) Control720 arcsec Knowledge360 arcsec Stability360 arcsec/sec Jitter360 arcsec/sec Physical Size65.5 x 29.9 x 59.2 cm (A1) 54.6 x 64.9 x 69.7 cm (A2)")
74
HSB – Humidity Sounder for Brazil HeritageAdvanced Microwave Sounding Unit-B (AMSU-B) Swath1650 km Spatial Resolution13.5 km horizontal at nadir Mass66 kg Duty Cycle100% Power85 W (average), 154 W (peak) Data Rate4.2 kbps Thermal Control ByRadiator Thermal Operating Range0-40° C Field of View (FOV)±49.5° cross track from nadir (+90° to -49.5° for calibration) Instrument Instantaneous FOV1.1° Pointing Requirements (platform + instrument, 3σ) Control3600 arcsec Knowledge360 arcsec Stability74 arcsec/sec JitterTBD Physical Size73 x 69 x 47 cm
 Swath1650 km Spatial Resolution13.5 km horizontal at nadir Mass66 kg Duty Cycle100% Power85 W (average), 154 W (peak) Data Rate4.2 kbps Thermal Control ByRadiator Thermal Operating Range0-40° C Field of View (FOV)±49.5° cross track from nadir (+90° to -49.5° for calibration) Instrument Instantaneous FOV1.1° Pointing Requirements (platform + instrument, 3σ) Control3600 arcsec Knowledge360 arcsec Stability74 arcsec/sec JitterTBD Physical Size73 x 69 x 47 cm")
75
Digital Image Processing and Analysis – Xinjiang University Advanced Earth Observation Satellite – II Sensors include: AMSRAMSR – Advanced Microwave Scanning Radiometer GLIGLI – Global Imager ILAS-IIILAS-II – Improved Limb Atmospheric Spectrometer -II SeaWindsSeaWinds – SeaWinds Scatterometer POLDERPOLDER – Polarization and Directionality of Earth’s Reflectance ADEOS-II

76
Digital Image Processing and Analysis – Xinjiang University ENVISAT DORIS

77
Digital Image Processing and Analysis – Xinjiang University

78
Sensors on ENVISAR ASAR –Advanced Synthetic Aperture Radar DORIS –Doppler Orbitography and Radiopositioning Integrated by Satellite GOMOS –Global Ozone Monitoring by Occultation of Stars LRR –Laser Retroreflector MERIS –MEdium Resolution Image Spectrometer Instrument MIPAS –Michelson Interferometer for Passive Atmospheric Sounding MWR –MicroWave Radiometer RA-2 –Radar Altimeter 2

79
Digital Image Processing and Analysis – Xinjiang University High Spatial Resolution Satellites In the early 90s, there was a need to acquire high spatial resolution images. Space Imaging was the first company that launched a IKONOS satellite. After a successful business, DigitalGlobe launched Quickbird. More story here!

80
Digital Image Processing and Analysis – Xinjiang University IKONOS: SpaceImaging Mission Date: September 24th 1999 – present Mission/orbit type: Earth resource-land / sun-synchronous Repeat cycle: 1.5 – 2.9 days depending on resolution Payload: Quad-linear photodiode array Resolution: 4m (MS) and 1m (PAN) Swath: 11 km Bands ( m): PAN.45 —.90 MS 1 (blue).45 —.53 2 (green).52 —.61 3 (red).64 —.72 4 (NIR).77 —.88
 and 1m (PAN) Swath: 11 km Bands ( m): PAN.45 —.90 MS 1 (blue).45 —.53 2 (green).52 —.61 3 (red).64 —.72 4 (NIR).77 —.88")
81
Digital Image Processing and Analysis – Xinjiang University IKONOS: SpaceImaging 1 meter PAN

82
Digital Image Processing and Analysis – Xinjiang University IKONOS: SpaceImaging Altitude: 681 km Inclination: 98.1 o Overpass time: 10:30 am (descending node) Repeat cycle: 1.5 - 2.9 days both in-track and cross- track pointingAgile spacecraft supporting both in-track and cross- track pointing. 700 km either side of the trackThe sensor can be inclined to acquire imagery up to 700 km either side of the track every 1.5 days (data resolution up to 2 meters).average 2.9 day revisit can be achieved for 1-meter resolution data in an area that covers up to 300 km either side of the track.The satellite can revisit (with different sensor angles and resolutions) any area on the earth on average every 1.5 days (data resolution up to 2 meters). An average 2.9 day revisit can be achieved for 1-meter resolution data in an area that covers up to 300 km either side of the track.
.average 2.9 day revisit can be achieved for 1-meter resolution data in an area that covers up to 300 km either side of the track.The satellite can revisit (with different sensor angles and resolutions) any area on the earth on average every 1.5 days (data resolution up to 2 meters). An average 2.9 day revisit can be achieved for 1-meter resolution data in an area that covers up to 300 km either side of the track..")
83
Digital Image Processing and Analysis – Xinjiang University IKONOS: SpaceImaging This one-meter resolution (sharpened 4 meter) satellite image of the Pentagon was collected at 11:46 a.m. EDT on Sept. 12, 2001 SpaceImaging.com

84
Digital Image Processing and Analysis – Xinjiang University IKONOS: SpaceImaging Radiometric resolution: Radiometric resolution: 11-bit quantization 11 bit 8 bit 11 bit 8 bit

85
Digital Image Processing and Analysis – Xinjiang University IKONOS: SpaceImaging Payload: Kodak quad-linear photodiode array 10m focal-length optical telescope assembly

86
Digital Image Processing and Analysis – Xinjiang University IKONOS: SpaceImaging Payload: Kodak quad-linear photodiode array 13,500 pixels –The panchromatic image sensor array consists of a linear charged couple device (CCD) containing 13,500 pixels, each 12 m-square. 3375 pixels –The multispectral detector is a quad-linear photodiode array with a total of 3375 pixels, each pixel 48 m-square.

87
Digital Image Processing and Analysis – Xinjiang University IKONOS: SpaceImaging Products: –Nominal single image: 11 km x 11 km Image strips: 11km x 100 km up to 11 km x 1000 km Image mosaics: up to 10,000 km 2 Multiple mosaics: Up to two 10,000 km 2 contiguous areas in a single pass within a region In-track, stereo-imagery capability of 22km x 130km perpendicular to the ground track

88
Digital Image Processing and Analysis – Xinjiang University QuickBird: DigitalGlobe Mission Date: October 18, 2001 – present Mission/orbit type: Earth resource- land / sun-synchronous Orbit Altitude: 450 km Repeat cycle: Average 1 – 3.5 days

89
Digital Image Processing and Analysis – Xinjiang University QuickBird: DigitalGlobe Payload: Ball High-resolution Camera 60 (BHRC 60) Resolution: 2.44 m (MS) and 0.61m (PAN) Swath: 16.5 km within a 544 km operational strip Agile Spacecraft: Agile spacecraft, ±30° nominal fore-and-aft and side-to-side pointing Bands ( m): PAN.45 —.90 MS 1 (blue).45 —.52 2 (green).52 —.60 3 (red).63 —.69 4 (NIR).76 —.89
 Resolution: 2.44 m (MS) and 0.61m (PAN) Swath: 16.5 km within a 544 km operational strip Agile Spacecraft: Agile spacecraft, ±30° nominal fore-and-aft and side-to-side pointing Bands ( m): PAN.45 —.90 MS 1 (blue).45 —.52 2 (green).52 —.60 3 (red).63 —.69 4 (NIR).76 —.89")
90
Digital Image Processing and Analysis – Xinjiang University QuickBird: DigitalGlobe Quantization:11 bits Imaging modes (at nadir): Snapshot: 16.5 km x 16.5 km Area: Typically, 32 km x 32 km Strip: 17 km x 225 km Stereo: Typically, 15 km x 15 km
: Snapshot: 16.5 km x 16.5 km Area: Typically, 32 km x 32 km Strip: 17 km x 225 km Stereo: Typically, 15 km x 15 km")
91
Digital Image Processing and Analysis – Xinjiang University QuickBird: DigitalGlobe Washington, D.C. area Snapshot: 17 km x 17 km Pan, 61 cm pixels

92
Digital Image Processing and Analysis – Xinjiang University QuickBird: DigitalGlobe 61-cm PAN close-up of the Royal Grand Palace, Bangkok, Thailand

93
Digital Image Processing and Analysis – Xinjiang University QuickBird: DigitalGlobe 2.44 m pan-sharpened, true-color close-up of the Washington Monument

Similar presentations
 M. Fujita, T. Tachikawa, M. Kato, H. Tsu ( ERSDAC, Japan), M.J. Abrams, L. Maldonado.>")


, infrared (BW, Color) –RADAR (SLAR, SAR) –LIDAR (light detection and ranging)>")


 and Landsat Thematic Mapper (TM) Sensor System Characteristics.>")


