Download presentation
Presentation is loading. Please wait.

1
Introduction, Satellite Imaging

2
Platforms Used to Acquire Remote Sensing Data Aircraft Low, medium & high altitude Higher level of spatial detail Satellite Polar-orbiting, sun-synchronous 800-900 km altitude, 90-100 minutes/orbit Geo-synchronous 35,900 km altitude, 24 hrs/orbit stationary relative to Earth

3
Satellite Observation Geostationary satellites are able to view earth from above. As they move in synchronicity with earth's rotation, they can provide regular coverage for a region and help in forecasting.

4
Polar Orbiting Satellites Polar orbits allow for lower altitudes and more image resolution. These satellites take multiple passes of the earth before returning to the same location.

5
Source: Federation of American Scientists [www.fas.org] Satellite Orbits, Summary Geosynchronous Orbit (GEO): 36,000 km above Earth, includes commercial and military communications satellites, satellites providing early warning of ballistic missile launch. Medium Earth Orbit (MEO): includes navigation satellites (GPS, Galileo, Glonass). Low Earth Orbit (LEO): from 80 to 2000 km above Earth, includes military intelligence satellites, weather satellites.
: includes navigation satellites (GPS, Galileo, Glonass). Low Earth Orbit (LEO): from 80 to 2000 km above Earth, includes military intelligence satellites, weather satellites..")
6
Satellite Systems Landsat 1, 2 and 3 Earth Resources Technology Satellite (ERTS-1), later renamed Landsat-1, launched in 1972 as an experimental system to test the feasibility of collecting earth resources data from satellites Data made publicly available world-wide: Open Skies Policy Carried a multispectral scanner (MSS), imaged a 185 km swath in 4 wavebands, 2 in visible, 2 in near-infrared, spatial resolution of 80 m, sun- synchronous orbit, repeat cycle of 18 days Each scene contains 7.5 million pixels & 30 million data values
, later renamed Landsat-1, launched in 1972 as an experimental system to test the feasibility of collecting earth resources data from satellites Data made publicly available world-wide: Open Skies Policy Carried a multispectral scanner (MSS), imaged a 185 km swath in 4 wavebands, 2 in visible, 2 in near-infrared, spatial resolution of 80 m, sun- synchronous orbit, repeat cycle of 18 days Each scene contains 7.5 million pixels & 30 million data values")
7
Satellite Systems Landsat 4 & 5 Landsat 4 deactivated shortly after launch, but remains in orbit Landsat 5 carries a multispectral scanner (MSS) & a Thematic Mapper (TM), imaged a 185 km swath 7 wavebands from the visible blue to the thermal infrared, spatial resolution of 30 m except the thermal band (120 m), sun-synchronous orbit, repeat cycle of 16 days each scene contains about 36 million pixels & 250 million data values
 & a Thematic Mapper (TM), imaged a 185 km swath 7 wavebands from the visible blue to the thermal infrared, spatial resolution of 30 m except the thermal band (120 m), sun-synchronous orbit, repeat cycle of 16 days each scene contains about 36 million pixels & 250 million data values")
10
Landsat 5 - 7 wavebands

11
12345671234567 Image DataStretch/Band combinationColor Composite Selected bands are remapped (stretched) to fit the display device. The output image color space is called a look-up table. Image display

12
Natural color composite 3,2,1 False color composite 4,3,2

13
Satellite Systems SPOT French satellite launched in 1986 Repeat cycle of 26 days Swath width of 117 km Sun-synchronous orbit, carries 2 pointable scanners Panchromatic mode with spatial resolution of 10 m and multispectral mode with spatial resolution of 20 m & images in 3 wavebands Potential to view a location from adjacent satellite paths = stereoscopic imaging (useful for topographic mapping)
")
14
SPOT’s Steerable Mirror

15
Uses of Landsat & SPOT Data Geology - used for mapping in mineral and petroleum exploration Agriculture - used to estimate crop quantities, monitor condition of crops Forestry - to estimate forest losses caused by fires, clear cutting & disease; to provide forest inventory data; used for comparative forest land valuation

16
Uses of Landsat & SPOT Data Land use planning - mapping current land cover, change detection, route location planning High resolution satellite imagery is being used as a substitute for high- altitude aerial photography Blue-water Green-forest Yellow-suburban Red-urban

17
Uses of Landsat & SPOT Data For monitoring rangeland condition, wildlife habitat, identify water pollution, identify flooded areas, to aid in the assessment of damage caused by natural disasters

18
Ocean Monitoring Satellites Oceans are important natural resource - difficult to map & monitor over large areas or for long time periods Satellites provide complete coverage at regular intervals Landsat & SPOT data used extensively to monitor sediment and chlorophyll concentrations, phytoplankton and pollution in marine and fresh-water environments; also to map water depths

19
Meteorological Satellites Provides more often coverage but at lower resolution (also means less expensive than Landsat & SPOT) Designed primarily to collect weather data, but often used for natural resource monitoring over large areas NOAA Satellites Advanced Very High Resolution Radiometer (AVHRR)
 Designed primarily to collect weather data, but often used for natural resource monitoring over large areas NOAA Satellites Advanced Very High Resolution Radiometer (AVHRR)")
20
AVHRR Spatial resolution of 1.1 km Swath width of 2400 km Provides daily global coverage Used to monitor snow cover, assess snow depths, monitor floods, detect & map forest fires, monitor crop conditions, monitor dust and sand storms, identify geologic activities like volcanic eruptions, for mapping regional drainage networks, physiography & geology

21
Different Sensors and Resolutions sensor spatial spectral radiometric temporal ---------------------------------------------------------------------------------------------------------------- AVHRR 1.1 and 4 KM 4 or 5 bands 10 bit 12 hours 2400 Km.58-.68,.725-1.1, 3.55-3.93 (0-1023) (1 day, 1 night) 10.3-11.3, 11.5-12.5 (micrometers) Landsat MSS 80 meters 4 bands 6 bit 16 days 185 Km.5-.6,.6-.7,.7-.8,.8-1.1 (0-63) Landsat TM 30 meters 7 bands 8 bit 14 days 185 Km.45-.52,.52-.6,.63-.69, (0-255).76-.9, 1.55-1.75, 10.4-12.5, 2.08-2.3 um SPOT P 10 meters 1 band 8 bit 26 days 60 Km.51-.73 um (0-255) (2 out of 5) SPOT X 20 meters 3 bands 8 bit 26 days 60 Km.5-.59,.61-.68,.79-.89 um (0-255) (2 out of 5)
 (1 day, 1 night) , (micrometers) Landsat MSS 80 meters 4 bands 6 bit 16 days 185 Km.5-.6,.6-.7,.7-.8, (0-63) Landsat TM 30 meters 7 bands 8 bit 14 days 185 Km ,.52-.6, , (0-255).76-.9, , , um SPOT P 10 meters 1 band 8 bit 26 days 60 Km um (0-255) (2 out of 5) SPOT X 20 meters 3 bands 8 bit 26 days 60 Km.5-.59, , um (0-255) (2 out of 5)")
22
12 Steps of Digital Image Processing 1)State the objective of the project 2) Acquire data 3) Assess data quality 4)Correct the data 5)Enhance the data 6)Correlate the data with ancillary data
State the objective of the project 2) Acquire data 3) Assess data quality 4)Correct the data 5)Enhance the data 6)Correlate the data with ancillary data")
23
12 Steps of Digital Image Processing (Cont.) 7)Select training area 8)Determine the spectral characteristics of the training area 9)Classify the data 10) Evaluate the results of the classification 11) Refine training areas and classifications if necessary 12) Communicate the results
 7)Select training area 8)Determine the spectral characteristics of the training area 9)Classify the data 10) Evaluate the results of the classification 11) Refine training areas and classifications if necessary 12) Communicate the results")
24
Important URL's http://www.mapmart.com/ http://www.globalmapper.com/ http://www.digitalglobe.com/ http://www.landinfo.com/satprices.htm

Similar presentations

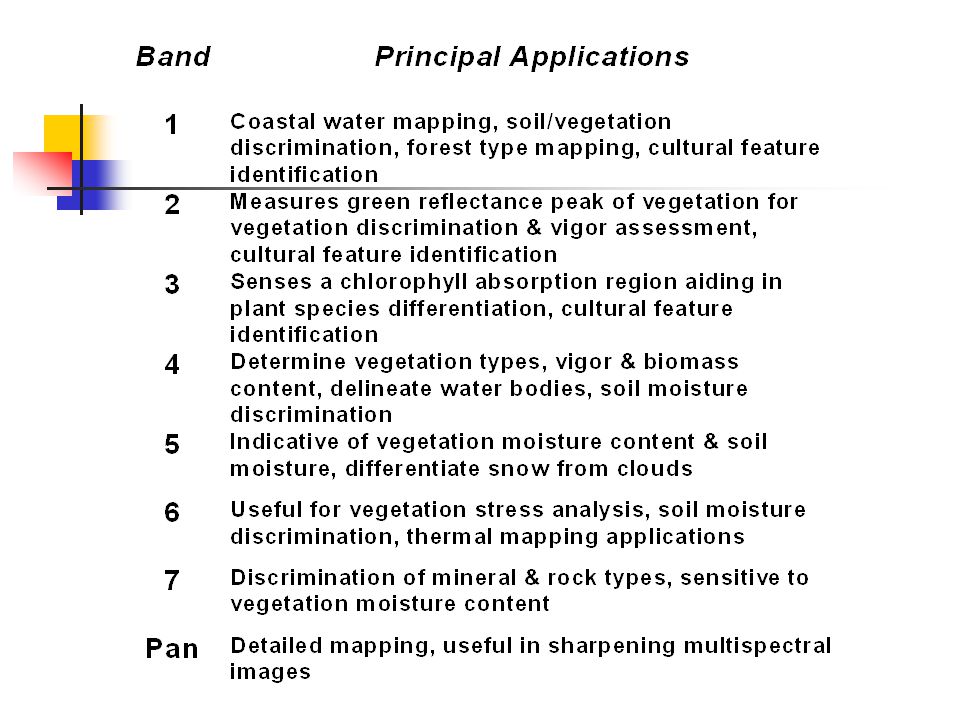

 Image Quality Assessment Radiometric Correction Geometric Correction Image Classification Introduction.>")

, infrared (BW, Color) –RADAR (SLAR, SAR) –LIDAR (light detection and ranging)>")


-Polar Orbiting Environmental Satellite (POES) Orbital characteristics.>")


