Download presentation
Presentation is loading. Please wait.

1
Estimating ocean-atmosphere carbon fluxes from atmospheric oxygen measurements Mark Battle (Bowdoin College) Michael Bender & Nicolas Cassar (Princeton) Roberta Hamme (U BC), Ralph Keeling (SIO) Cindy Nevison (NCAR) UNESCO Surface Ocean CO 2 Variability and Vulnerabilities Workshop April 12, 2007 Funding from: NSF, NOAA GCRP, BP-Amoco, NASA, UNESCO
 Michael Bender & Nicolas Cassar (Princeton) Roberta Hamme (U BC), Ralph Keeling (SIO) Cindy Nevison (NCAR) UNESCO Surface Ocean CO 2 Variability and Vulnerabilities Workshop April 12, 2007 Funding from: NSF, NOAA GCRP, BP-Amoco, NASA, UNESCO")
2
On the agenda: Oxygen, O 2 /N 2, APO and Carbon Fluxes What can (did) one do with APO? –The ancient past (Keeling, Stephens) –The recent past (Gruber, Tohjima, Battle, Naegler) –The present: Models (Nevison) –The present: Data (Tohjima, Hamme) –The present: Data & Models (Rödenbeck)
 –The recent past (Gruber, Tohjima, Battle, Naegler) –The present: Models (Nevison) –The present: Data (Tohjima, Hamme) –The present: Data & Models (Rödenbeck).")
3
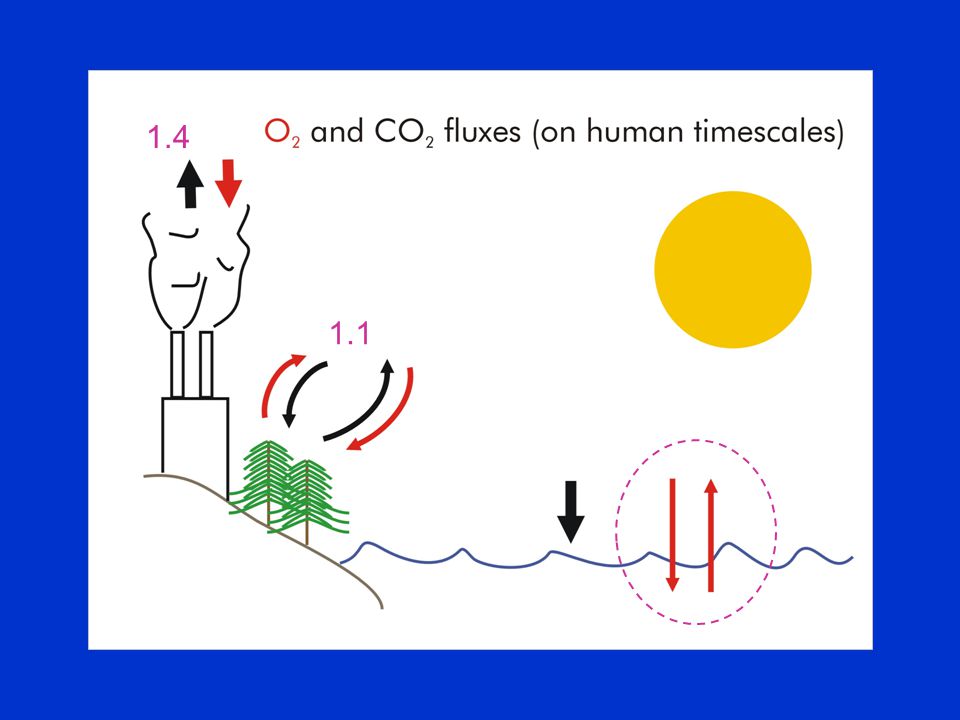
What determines the amount of O 2 in the atmosphere?

4
1 st order description of long-term fluxes

5
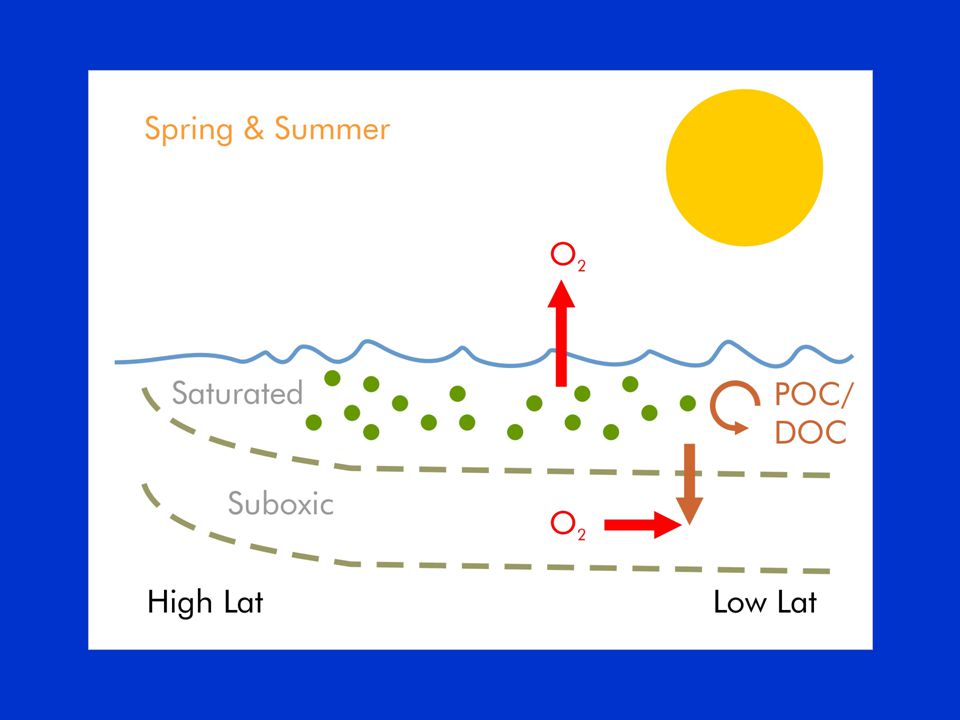
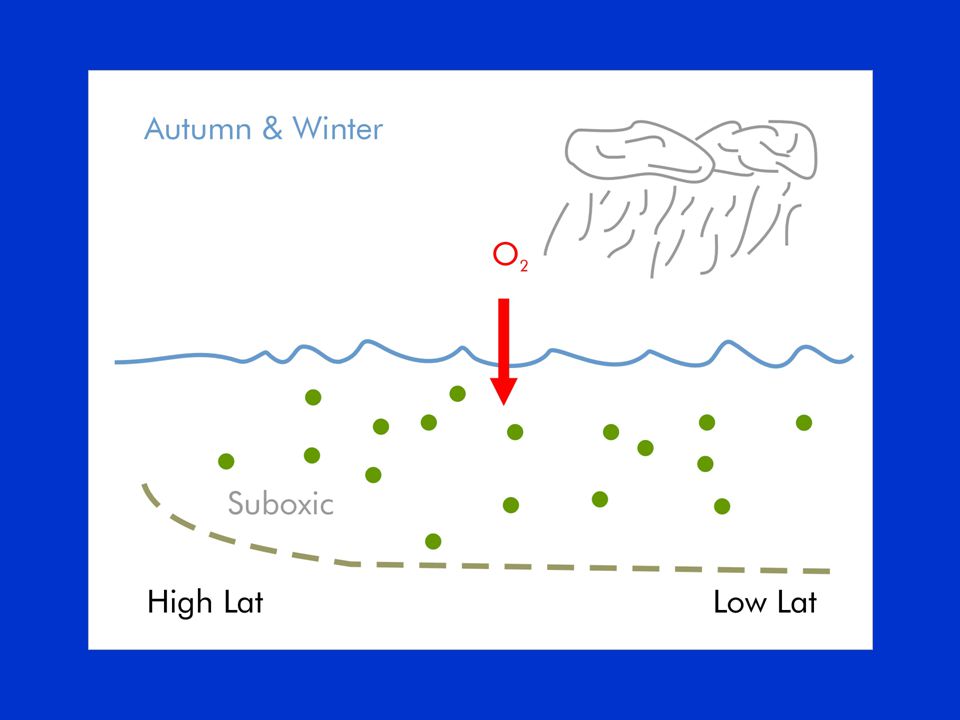
More detail on the oceans Seasonality…

6
1.4 1.1
9
More detail on the oceans Seasonality and secular trends

13
Atmospheric Potential Oxygen APO O 2 + 1.1 CO 2 APO reflects air/ocean O 2 & CO 2 fluxes Land biota doesn’t change APO Fossil fuels change APO a little

14
O 2 /N 2 & APO changes are small O 2 /N 2 per meg (O 2 /N 2sa – O 2 /N 2st )/(O 2 /N 2st ) x10 6 1 per meg = 0.0001% = 0.001 per mil 1 PgC FF 3.2 per meg O 2 /N 2 0.66per meg APO 1 PgC into oceans 2.5per meg APO* *assuming no corresponding O 2 flux
/(O 2 /N 2st ) x per meg = % = per mil 1 PgC FF 3.2 per meg O 2 /N 2 0.66per meg APO 1 PgC into oceans 2.5per meg APO* *assuming no corresponding O 2 flux")
15
What controls APO? Ocean biology (light, nutrients, etc.) Ocean chemistry (O 2 & CO 2 equilibration) Ocean temperature (solubility & stratification) Ocean circulation (shallow & deep) Atmospheric transport Fossil fuel (a little)
 Ocean chemistry (O 2 & CO 2 equilibration) Ocean temperature (solubility & stratification) Ocean circulation (shallow & deep) Atmospheric transport Fossil fuel (a little).")
16
A brief history of time APO

17
In the beginning…

18
Stephens et al., 1998 Models don’t get interpolar gradient right (physics?) Equatorial data would be nice.
 Equatorial data would be nice.")
19
The next chapter…

20
fluxes of CO 2 and O 2 atmospheric transport atmospheric composition at observing stations pCO 2, dissolved O 2, PO 4 & heat fluxes

21
Gruber et al., 2001 Eliminate OBGC Model. Results seem Independent of Ocean physics Interpolar gradient getting better Equatorial data Would be nice.

22
New data!

23
Tohjima, et al. 2005

25
Still more new data!

26
Princeton & Scripps data

27
Equatorial bulge is confirmed… Battle et al. 2006

28
Equatorial bulge is confirmed… Battle et al. 2006 and the interpolar gradient looks good too.

29
…but it’s evolving Battle et al., 2006

30
…and more modeling work

31
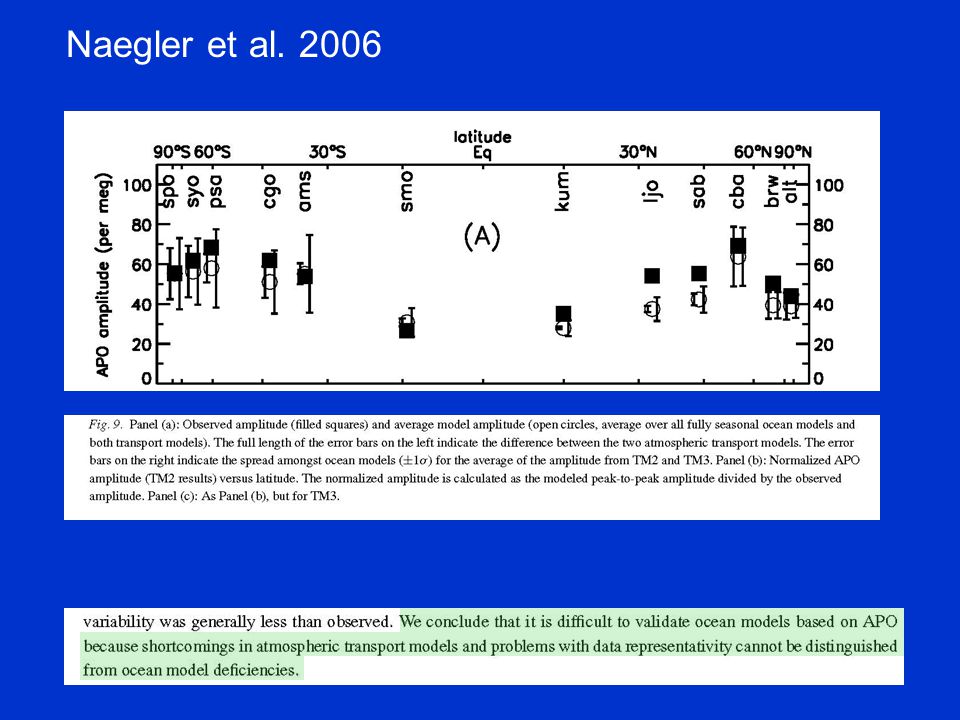
Naegler et al. 2006

33
Work in progress: Fresh ideas and fresh data…

34
C. Nevison (NCAR) work in progress, with S. Doney & N. Mahawold Model study with OBGCM & ATM Seasonal cycle comparison Annual mean gradient comparison Emphasis on quantifying transport errors

35
Ocean Ecosystem Model+OGCM (Doney) fluxes of CO 2 and O 2 MATCH (NCEP winds 1979-2004) atmospheric composition at observing stations CASA land bio (also w/ fire) fossil fuel
 fluxes of CO 2 and O 2 MATCH (NCEP winds ) atmospheric composition at observing stations CASA land bio (also w/ fire) fossil fuel")
36
C. Nevison (NCAR) work in progress, with S. Doney & N. Mahawold Ocean O 2 and CO 2 fluxes from WHOI ecosystem model. Set of Carbon/O 2 fluxes with IAV in ocean, land and transport, all NCEP driven MATCH has stronger rectifier than ATMs previously used (TM3, TM2, GCTM)
.")
37
Seasonal results from WHOI/MATCH Nevison (in progress)
")
38
Fidelity of seasonal cycles Nevison (in progress)
")
39
Fidelity of seasonal cycles Nevison (in progress) mod / obs relative phasing
 mod / obs relative phasing")
40
Fidelity of seasonal cycles Nevison (in progress)
")
41
Fidelity of seasonal cycles Nevison (in progress) Model skill depends on hemisphere Palmer
 Model skill depends on hemisphere Palmer")
42
latitudinal gradients in WHOI/MATCH Gruber ’01/MATCH WHOI/MATCH Nevison (in progress) ATM uncertainties trump OBGCM fluxes again Gruber/TM3 Gruber/MATCH Battle data WHOI/MATCH
 ATM uncertainties trump OBGCM fluxes again Gruber/TM3 Gruber/MATCH Battle data WHOI/MATCH")
43
Tohjima et al. (Tellus B, submitted) Repeat carbon sink partitioning Look at APO variability
 Repeat carbon sink partitioning Look at APO variability")
44
Atmosphere-ocean partition Tohjima et al. (submitted)
")
45
~20 month smoothing Interannual variability in APO

46
Tohjima et al. (submitted) ~20 month smoothing Variability reflects O 2 fluxes; not carbon. 12 Pg C/yr? Of course not.

47
Atmosphere-ocean partition APO variability Tohjima et al. (submitted)
")
48
Further evolution of the interpolar gradient ~2-year smoothing

49
Spatial structure of APO is genuinely time- dependent ~2-year smoothing

50
Spatial structure of APO is genuinely time- dependent Neighboring stations move independently ~2-year smoothing

51
Spatial structure of APO is genuinely time- dependent Neighboring stations move independently Watch out for end-effects ~2-year smoothing

52
Hamme, Keeling & Paplawsky (AGU, 2006) Interhemispheric temporal variability Mechanisms
 Interhemispheric temporal variability Mechanisms")
53
Work of Hamme et al. will be available upon publication (expected in late 2007)
")
54
Broad conclusions: APO reflects (too) many oceanic properties Dataset is good but not great Interpreting ocean models complicated by atmospheric transport
 many oceanic properties Dataset is good but not great Interpreting ocean models complicated by atmospheric transport")
55
More detailed conclusions A model combo can get seasonality right, but still miss annual averages Some indications that winter ventilation plays a big role Apparent global signal of NAM May be an El Niño signal too

56
O 2 and CO 2 fluxes are related, but not intimately. The degree of linkage depends on temporal and spatial scale.

Similar presentations


 Achievements and challenges Nicolas Gruber Environmental Physics, ETH Zürich, Zurich, Switzerland. Using input from.>")

>")
 Sara Mikaloff Fletcher (UCLA) Michael Bender (Princeton) Ralph Keeling.>")

 Michael Bender (Princeton) Melissa B. Hendricks.>")
 Michael Bender (Princeton) Ralph Keeling (Scripps Institute of Oceanography) Pieter.>")

 Michael Bender (Princeton) Melissa B. Hendricks (Princeton) David.>")


