Download presentation
Presentation is loading. Please wait.

1
Measurements and Models of Oceanic O 2 and CO 2 Fluxes Mark Battle (Bowdoin College) Sara Mikaloff Fletcher (UCLA) Michael Bender (Princeton) Ralph Keeling (SIO) Nicolas Gruber (UCLA) Pieter Tans (NOAA/CMDL) Melissa B. Hendricks (Princeton) David T. Ho (Princeton/Columbia) Carrie Simonds (Bowdoin College) Robert Mika (Princeton) Andrew Manning (SIO) Bill Paplawsky(SIO) AGU Fall 2004 OS11C-08 Funding from: NSF NOAA GCRP BP-Amoco AGU poster Fall 2003 A52B-0793
 David T. Ho (Princeton/Columbia) Carrie Simonds (Bowdoin College) Robert Mika (Princeton) Andrew Manning (SIO) Bill Paplawsky(SIO) AGU Fall 2004 OS11C-08 Funding from: NSF NOAA GCRP BP-Amoco AGU poster Fall 2003 A52B")
2
On the agenda: What is APO? Historical context Our dataset From sparse data to meridional gradients Modeling Data-model comparison

3
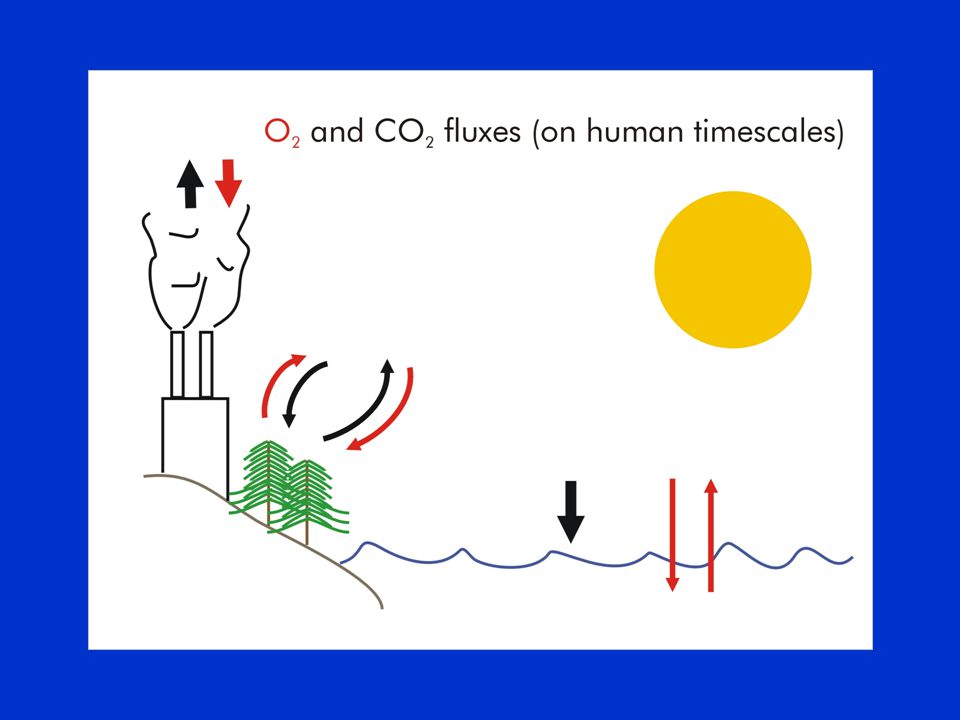
Atmospheric Potential Oxygen APO O 2 + 1.1 CO 2 APO changes solely due to oceanic processes* * This is almost true

5
1.4 1.1

6
1.4 1.1

9
Atmospheric Potential Oxygen APO O 2 + 1.1 CO 2 APO responds to oceanic O 2 & CO 2 fluxes Land biota doesn’t change APO Fossil fuels change APO a little

10
In the beginning…

11
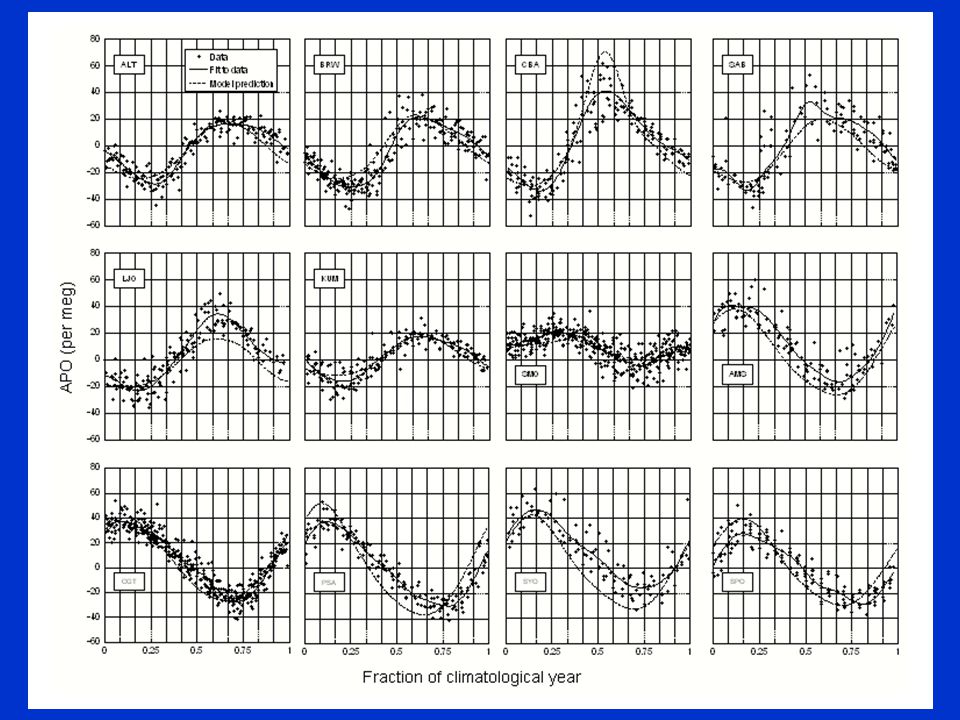
Stephens et al., 1998 Models don’t get interpolar gradient right (physics?) Equatorial data would be nice.
 Equatorial data would be nice.")
12
The next chapter…

13
Gruber et al., 2001 Eliminate BGC Model. Results seem Independent of Ocean physics Equatorial data Would be nice.

14
We have equatorial data!

15
Sampling locations used in this work

16
Ships of opportunity

17
NOAA ship Ka’imimoana

18
Uneven spatio-temporal data density

20
Annual-mean gradients from sparse data? 2-D interpolation (latitude and time): Create gradients at specific times through year Average the gradients over climatological year
: Create gradients at specific times through year Average the gradients over climatological year.")
21
3 examples of gradients…

22
A weighted average of all gradients

23
Annual-mean gradients from sparse data? 2-D interpolation (latitude and time): Create gradients at specific times through year Average the gradients over climatological year Seasonal Cycles: Sine fits to data at each sampling latitude Annual means from sine fits
: Create gradients at specific times through year Average the gradients over climatological year Seasonal Cycles: Sine fits to data at each sampling latitude Annual means from sine fits.")
25
Annual means from seasonal cycles

26
New data deserve a new model Aseasonal O 2 : Ocean inversion (Gruber 2001) Aseasonal N 2 : Heat inversion (Gloor 2001) Oceanic CO 2 : pCO 2 (Takahashi 1999) Seasonal O 2 and N 2 : Ocean heat fluxes (Garcia and Keeling 2001) FF CO 2 and O 2 : CDIAC (Marland 2000) Atmospheric Transport: TM3.8 Winds: NCEP 1995 – 2000 (repeated and averaged)
 Aseasonal N 2 : Heat inversion (Gloor 2001) Oceanic CO 2 : pCO 2 (Takahashi 1999) Seasonal O 2 and N 2 : Ocean heat fluxes (Garcia and Keeling 2001) FF CO 2 and O 2 : CDIAC (Marland 2000) Atmospheric Transport: TM3.8 Winds: NCEP 1995 – 2000 (repeated and averaged)")
27
Data-model comparison: 2-D interpolation

28
Data-model comparison: seasonal cycles

29
Is this different from old models? The models really are different!

30
What has changed? Atmospheric Transport: –Was GCTM –Is now TM3 Seasonal O 2 & N 2 : –Was Najjar & Keeling/Esbensen & Kushnir –Is now Garcia and Keeling

31
In summary… Data coverage much greater Equatorial “bulge” exists Interpolar gradient smaller Newest model gives much better overall agreement with data Past disagreements primarily due to atmospheric transport Disagreement persists at SYO, SAB and CBA Watch for a publication soon.

32
UCLA model annual mean APO

33
Merging PU & SIO datasets

34
Problems at Cold Bay

35
Time slices: Data Time slices: Model

36
Data quality at Sable Island

Similar presentations


 Zane Davis, Ryan Hart, Jayme Woogerd, Jacob Scheckman,>")

, S.E Mikaloff-Fletcher (1), A.Jacobson (2), M. Gloor (2), J. L. Sarmiento (2), T. Takahashi.>")
 Workshop.>")


 Michael Bender (Princeton) Melissa B. Hendricks.>")


 Michael Bender (Princeton) Ralph Keeling (Scripps Institute of Oceanography) Pieter.>")

 Michael Bender & Nicolas Cassar (Princeton)>")