Download presentation
Presentation is loading. Please wait.

1
Simulations of carbon transport in CCM3: uncertainties in C sinks due to interannual variability and model resolution James Orr (LSCE/CEA-CNRS and IPSL, France) Co-authors: B. Govindasamy & P. Duffy (LLNL/DOE), and J. A. Taylor (ANL/DOE) Funding: LLNL LDRD et LLNL URP sabbatical program TransCom Workshop Jena, Germany 12—15 May 2003
, and J. A. Taylor (ANL/DOE) Funding: LLNL LDRD et LLNL URP sabbatical program TransCom Workshop Jena, Germany 12—15 May")
2
Resolution: ~ 50 km CCM3: T239

3
Resolution: ~ 300 km CCM3: T42

4
*How to measure model improvement? Quantitative improvement for T170 Key relationship: *Taylor, K. E., J. Geophys. Res., 106, D7, 7183-7192, 2001 Duffy et al.., Climate Dyn.., submitted, 2003

5
TRANSCOM-1 Models *Law et al. (1996, GBC)
")
6
Fossil Emissions Scenario (TRANSCOM3) *Gurney et al. (2002, Final TRANSCOM3 Report)
 *Gurney et al. (2002, Final TRANSCOM3 Report)")
7
Neutral Biosphere Scenario (TRANSCOM) Transcom1 (1996)Transcom3 (2002) *Gurney et al. (2002, Final TRANSCOM3 Report)*Law et al. (1996, GBC)
*Law et al. (1996, GBC).")
8
Rectifier correlated with N.H. Land Sink *Gurney et al (2002): Rectifier is the major uncertainty regarding the magnitude of the Northern Hemisphere C sink 16 different annual mean model responses to purely seasonal forcing Interhemispheric difference in Rectifier (ppmv) N. H. Land Sink (Pg C yr 1 ) *
: Rectifier is the major uncertainty regarding the magnitude of the Northern Hemisphere C sink 16 different annual mean model responses to purely seasonal forcing Interhemispheric difference in Rectifier (ppmv) N. H. Land Sink (Pg C yr 1 ) *.")
9
Objectives of this study 1.Test sensitivity of rectifier to horizontal resolution 2.Investigate interannual variability of rectifier in CCM3 model.

10
Simulations TRANSCOM-3 Boundary Contidtions: Fossil Emissions: Andres Ocean : observed air-sea flux (Takahashi et al., 1999) “Neutral Biosphere” (or Rectifier from CASA model) Other: Rn-222
 Neutral Biosphere (or Rectifier from CASA model) Other: Rn-222")
11
Some model details: 18 Vertical levels Climatological SST forcing Three-year spin-up Change horizontal resolution only Simulation Grid Cells SizeApprox Grid Size Years of Simulation T2164x325.6°600 km27 T3196x483.8°450 km21 T42128x642.8°300 km23 T63192x961.9°225 km16 T85256x1281.4°150 km21 T170512x2560.7°75 kmIn Progress T239720x3600.5°50 km

12
Taylor Diagram: Precipitation (Effect of Resolution)
")
13
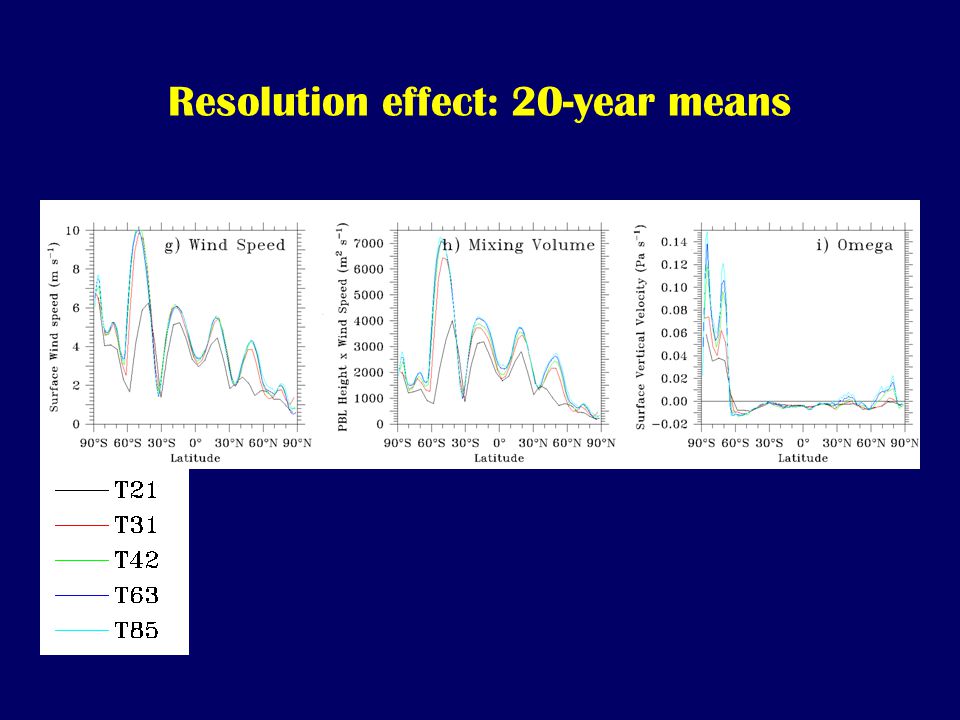
Resolution effect: 20-year means

15
Rectifier in CCM3 (T42) has large interannual variability *Normalized to South Pole
 has large interannual variability *Normalized to South Pole")
16
Variability = f(resolution) T42T31T21 T85T63
 T42T31T21 T85T63")
17
Interannual Variability: Zonal Mean (T42)
")
18
TRANSCOM-3 Stations

19
Interannual Variability: TransCom3 Stations (T42)
")
20
Spatial distribution of interannual rectifier? Mean Std. Dev. Range Rectifier: T42 (1983-2001)
")
21
Causes of interannual variability in the rectifier Mechanisms invoked to explain seasonal rectifier: Changes in local PBL height (Denning, 1995) Changes in wind direction (Taguchi, 1996) Changes in wind speed/”mixing volume” (Taylor, 1998) Meridional transport –Pearman and Hyson (1980) –Keeling et al. (1989)
.")
22
Interannual Varib. of PBL Height (m): CCM3 T42 Annual Means (1983—2002)
: CCM3 T42 Annual Means (1983—2002)")
23
Winter differences drive interannual variability

25
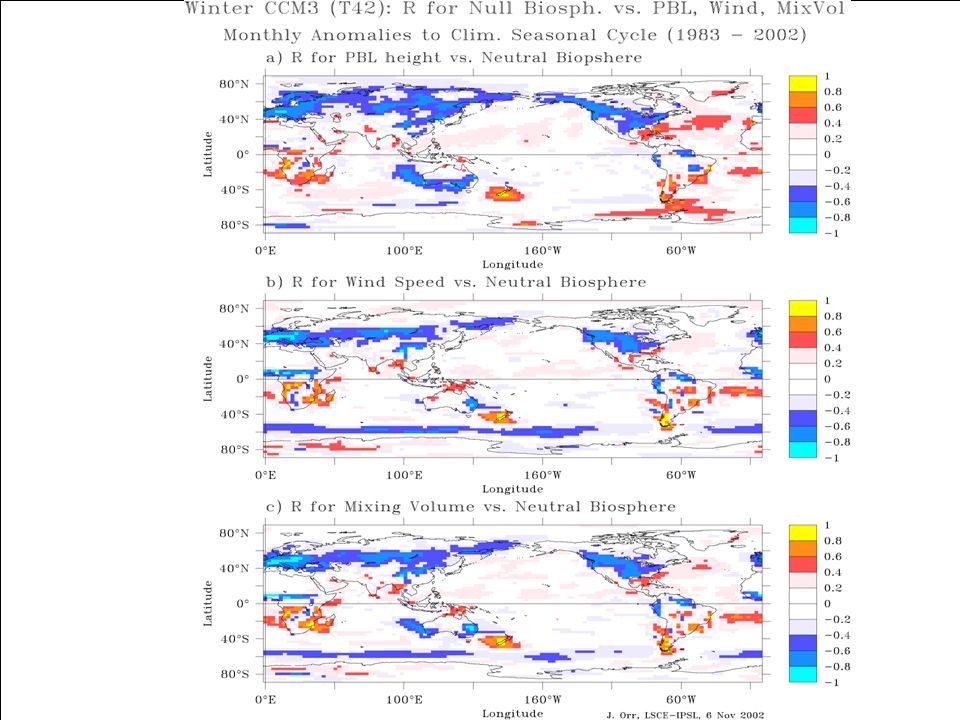
R 2 for winter monthly anomalies of rectifier vs. surface wind speed (arrows: climatological winter surface winds)
.")
26
“Neutral Biosphere” : seasonal boundary condition (mol C cm -2 yr -1 ) *TRANSCOM3 Boundary Condition (also used in this study)
 *TRANSCOM3 Boundary Condition (also used in this study)")
27
Maximum in Rectifier occurs North of maximum in N.B. forcing

28
Rectification: Horizontal Control Source Sink Source+SinkSource-Sink *Taguchi (1996, JGR, 101, 15099-15109)
")
29
Seasonal Prevailing Surface Winds: CCM3, T42 (1983—2002) NE: Region of Maximum Interannual Rectifier SW: Region of High Corr. (wind, pbl, rectifier)
.")
30
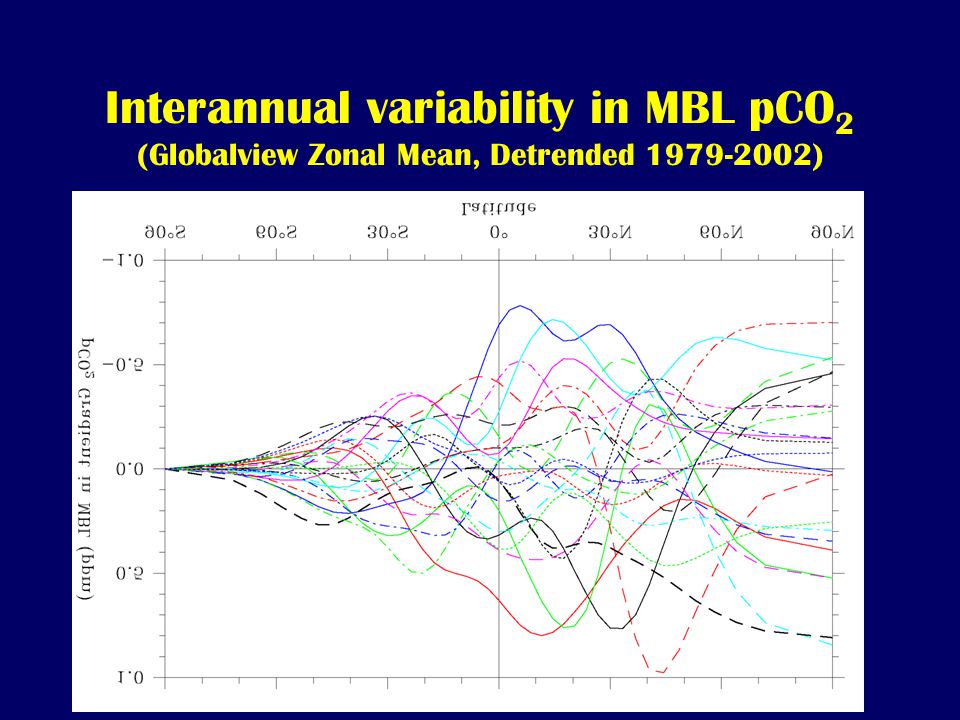
Interannual variability in MBL pCO 2 (Globalview Zonal Mean, Detrended 1979-2002)
")
32
Conclusions: Resolution effect: differences but no clear tendency –Systematic bias due to insufficient resolution? –Interannual variability increases with model resolution –Need long high-resolution simulations Interannual variability of the rectifier: large in CCM3 –Importance of interannual variability of horizontal transport –Comparable to the range of TRANSCOM models –Comparable to observed interannual variability of pCO2 in MBL –Atm. CO 2 Growth rate = f(SMS, Interannual Var. in Transport) –Interannual variability in transport likely to differ among models Inversions with AGCM not appropriate Effect of Nudging? Different reanalysis products; different models? Call for new efforts to constrain effect of interannual variability in atmospheric transport on inverse estimates of C sources and sinks
 –Interannual variability in transport likely to differ among models Inversions with AGCM not appropriate Effect of Nudging. Different reanalysis products; different models. Call for new efforts to constrain effect of interannual variability in atmospheric transport on inverse estimates of C sources and sinks.")
Similar presentations


 Workshop.>")


, L. Merlivat (1) and K.>")

 tell us – What are trends in the current observational.>")


 Michael Bender & Nicolas Cassar (Princeton)>")


, 1053, doi:10.1029/2001GB001593,>")

