Download presentation
Presentation is loading. Please wait.

1
Lake Superior North Shore Climate Jim Zandlo State Climatology Office DNR-Waters 2006

2
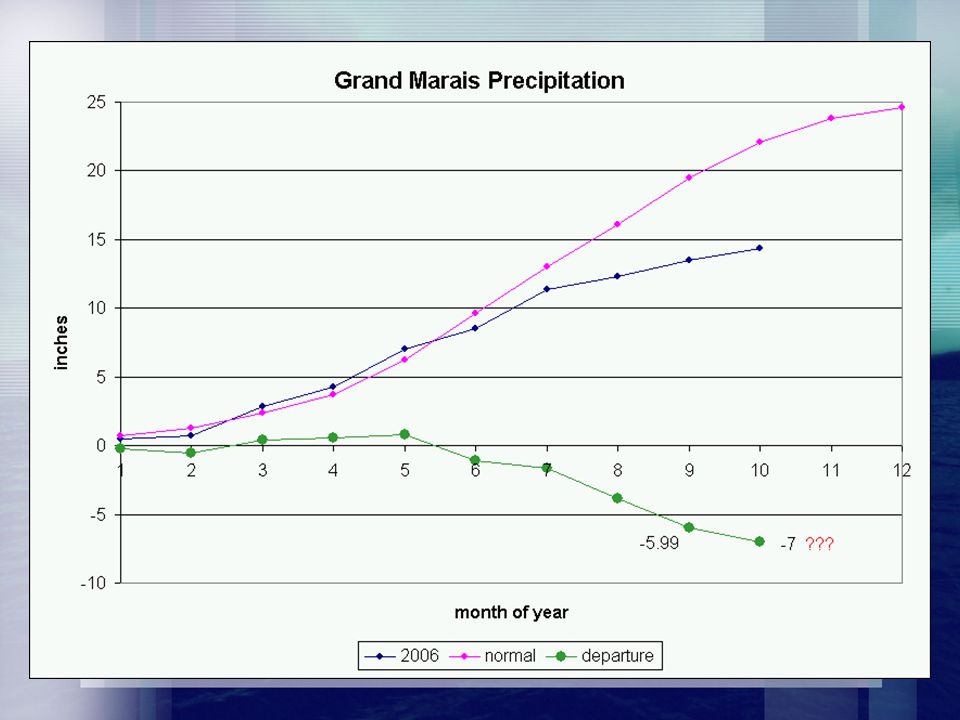
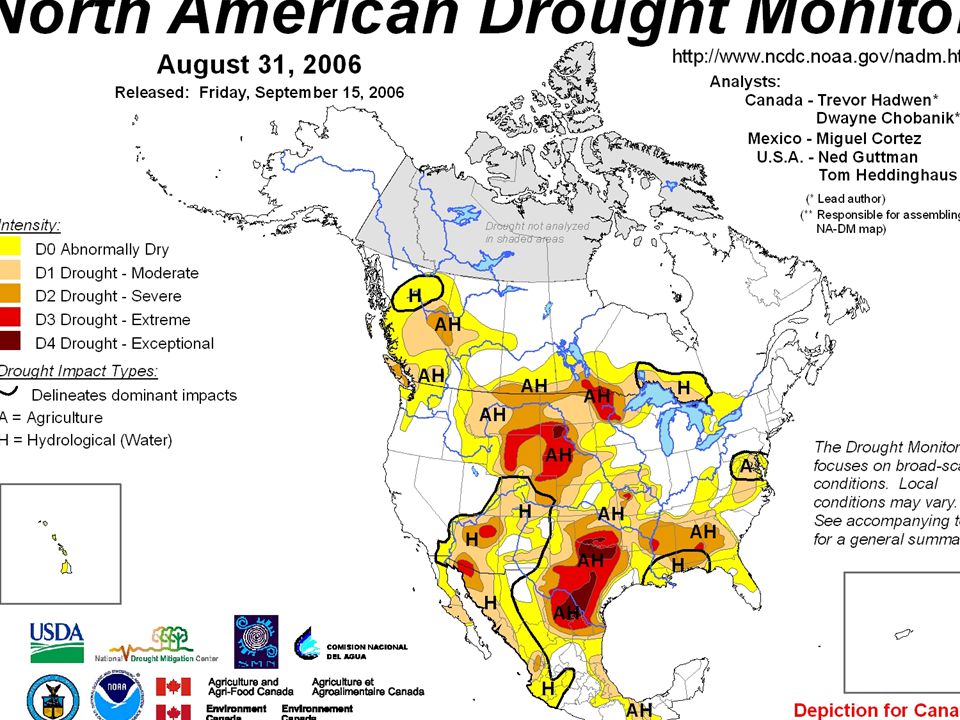
Superior Climate 2005-06 snow season Dry summer, low lake

3
Superior Climate 2005-06 snow season –More-or-less ‘normal’ precipitation spring runoff was (probably) more-or-less ‘normal’ –Snowfall pattern very similar to 4-year SnowRules! result –climate.umn.edu/SnowRules then click on 2005-06 map

4
A slow start in NE (again) …
 …")
5
Snowfall Dec 13-19, 2005

6
… right past ‘normal’ snow depth

7
Snowfall Nov 2005 – Apr 2006

8
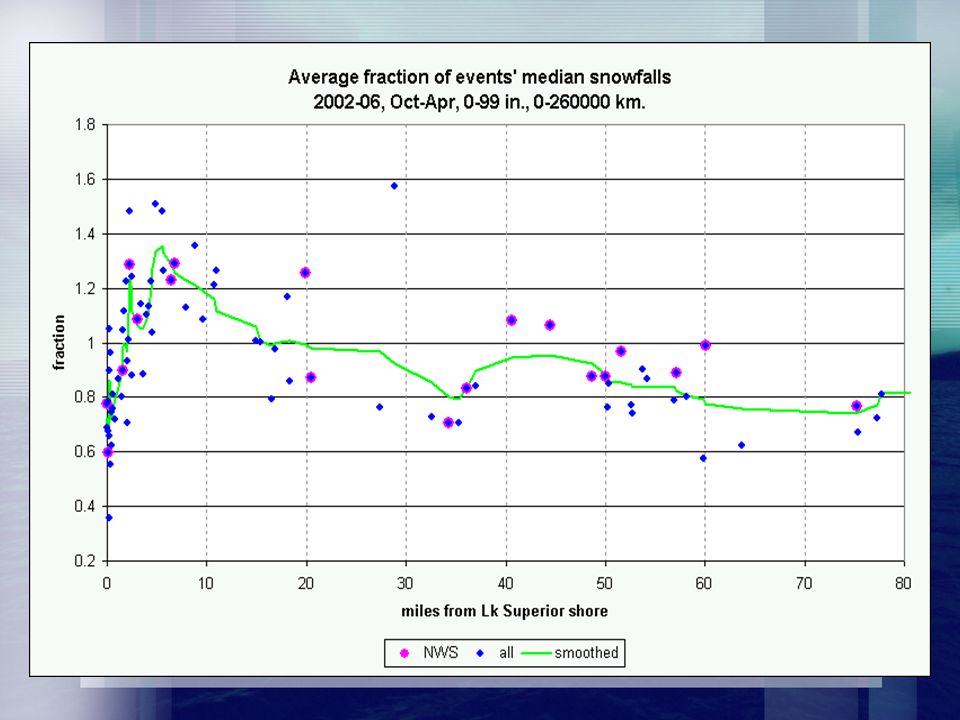
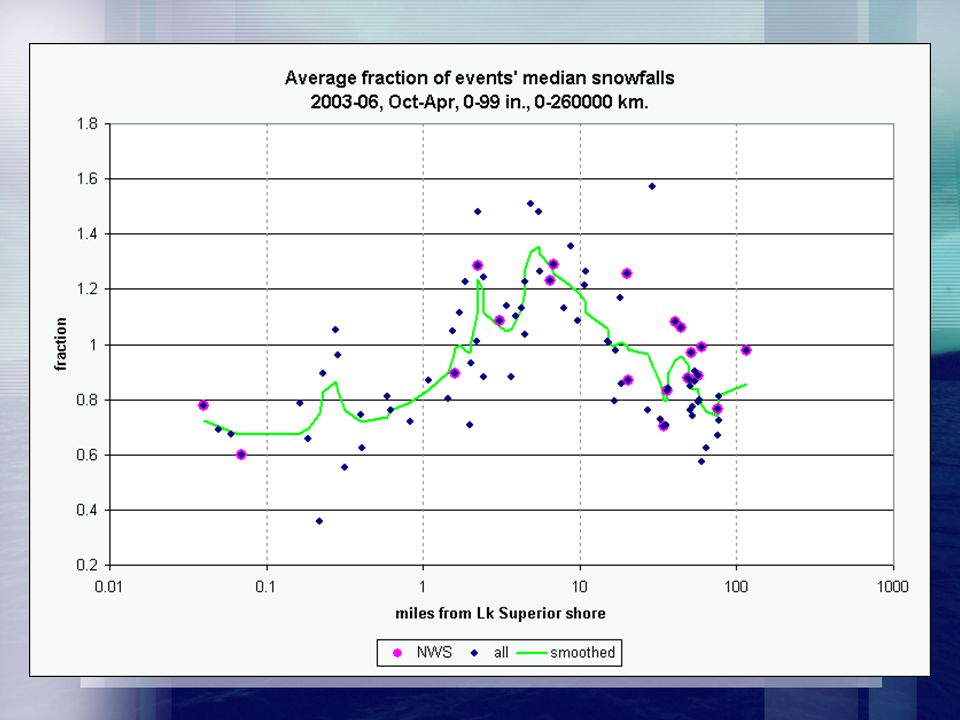
Superior Climate 2005-06 snow season –Snowfall transect updated Fraction of median (was fraction of max) Log-of-distance spreads out values close to Lake Superior –climate.umn.edu/SnowRules then click on 2005-06 map
 Log-of-distance spreads out values close to Lake Superior –climate.umn.edu/SnowRules then click on map")
11
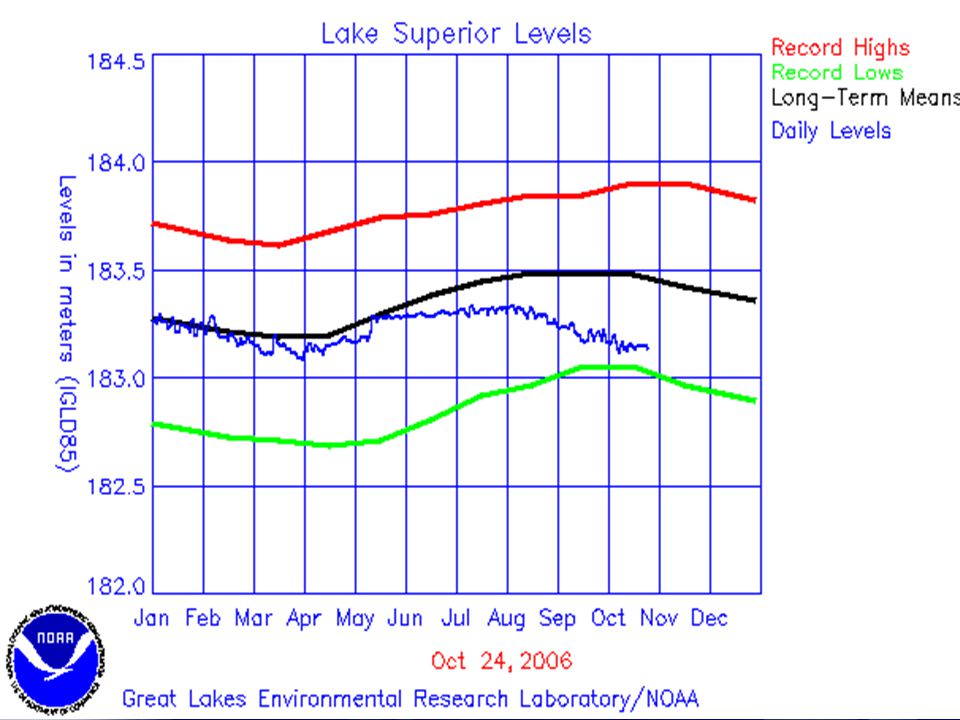
Superior Climate 2005-06 snow season Dry summer –Low Lake Superior –Basic hydrology GLERL time series

16
Superior Climate 2005-06 snow season Dry summer –Near record low water levels (1925-26) on Lake Superior –Basic hydrology Summer is primary recharge period for Lake Superior GLERL time series What happens next?
 on Lake Superior –Basic hydrology Summer is primary recharge period for Lake Superior GLERL time series What happens next")
17
A range of almost 4 feet in the observational record. Lake Level:

18
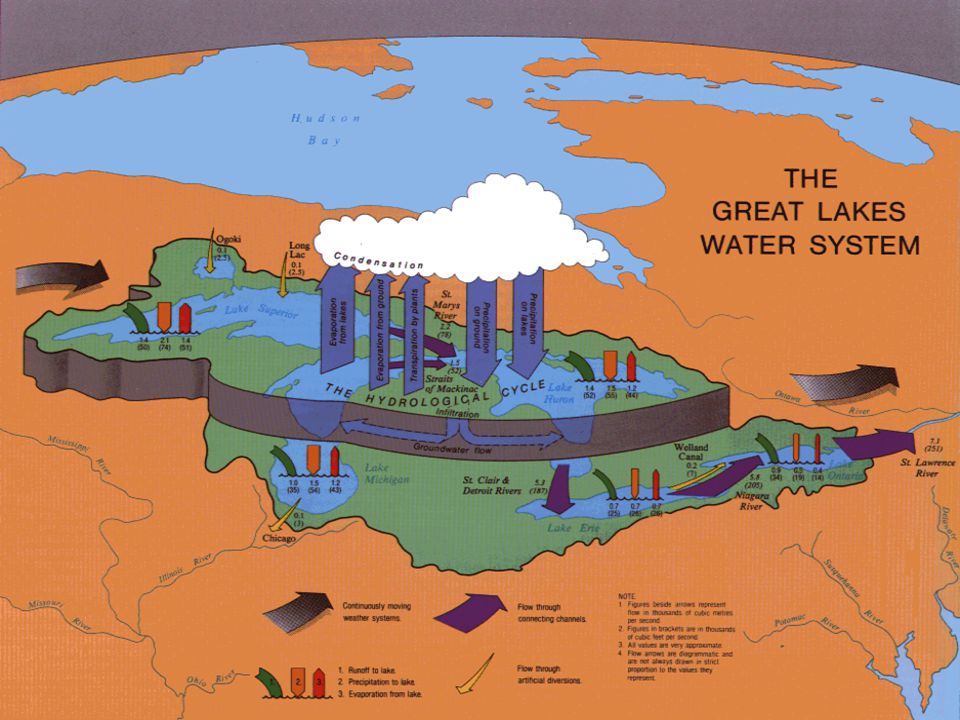
Lake level = old lake level + precipitation on lake + runoff from surrounding land (flow in) - lake evaporation - flow out at outlet (Sault Saint Marie, MI) + / - groundwater flow Basic Lake Hydrology
 - lake evaporation - flow out at outlet (Sault Saint Marie, MI) + / - groundwater flow Basic Lake Hydrology")
19
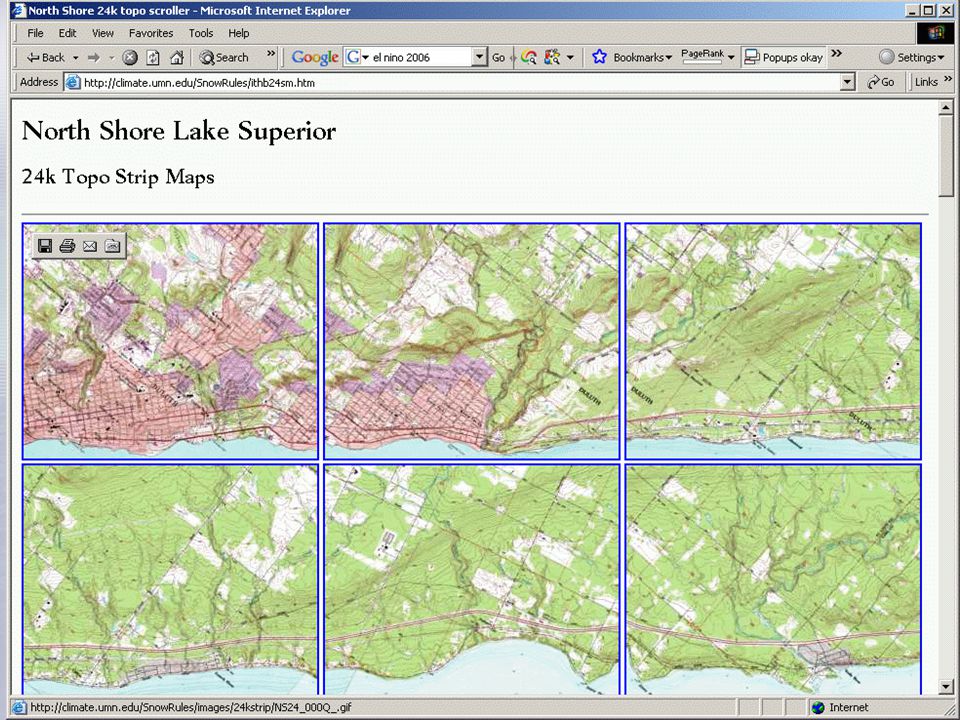
Geography and General Hydrology - large, ‘state-sized’ watershed - ‘narrow’ along American shore

20
Water for runoff, cisterns

21
Water coming in … Runoff 37% Precipitation 59% on lake Diversion 4% …must go out (most of the time) St. Mary’s River 57% Evaporation 43% Deposition 0.2%

22
Water coming in … Runoff 1.7 ft Precipitation 2.7 ft Diversion 0.2 ft …varies Deposition 0.2% Year ending 11/1985 had 10% more water Year ending Feb 2001 had 15% less water Precipitation 3.1 ft Precipitation 2.6 ft Runoff 1.8 ft Runoff 1.1 ft

23
Water coming in … Runoff 1.7 ft Precipitation 2.7 ft Diversion 0.2 ft …varies Deposition 0.2% Year ending 11/1985 had 10% more water Year ending Feb 2001 had 15% less water Precipitation 3.1 ft Precipitation 2.6 ft Runoff 1.8 ft Runoff 1.1 ft

24
Water coming in … Runoff 1.7 ft Precipitation 2.7 ft Diversion 0.2 ft …varies Deposition 0.2% Year ending 11/1985 had 10% more water Year ending Feb 2001 had 15% less water Precipitation 3.1 ft Precipitation 2.6 ft Runoff 1.8 ft Runoff 1.1 ft

25
Future developments? (What happens next?) Superior Climate
 Superior Climate")
27
Lake Superior evaporation …

28
is not the same as evapotranspiration from nearby land surfaces

29
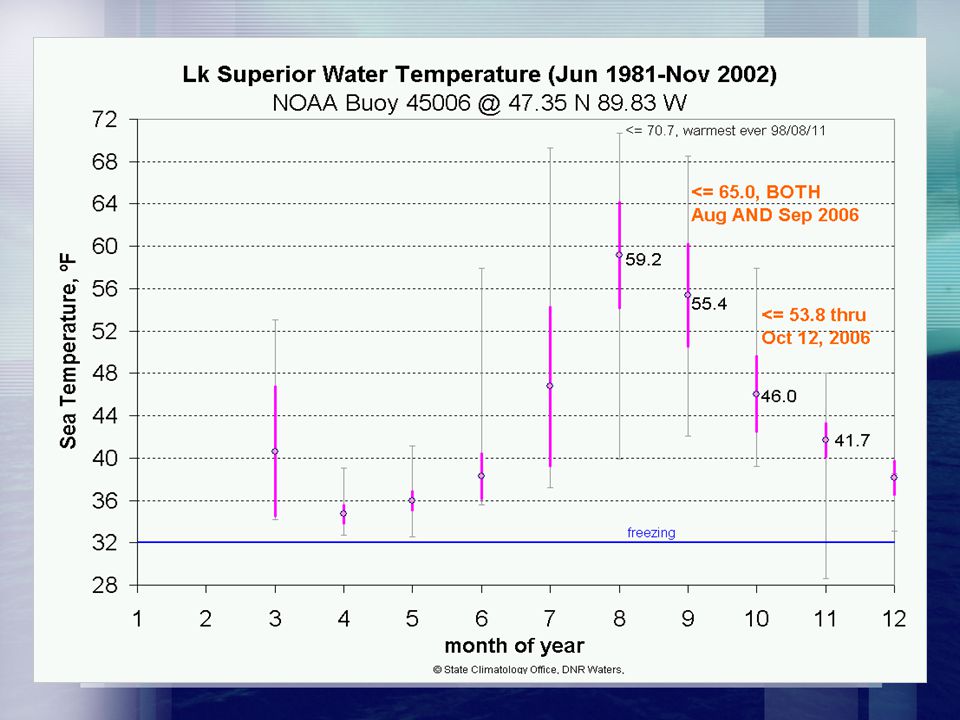
NOAA Buoys -meteorological parameters -sea measurement -wave info -water temperature -

32
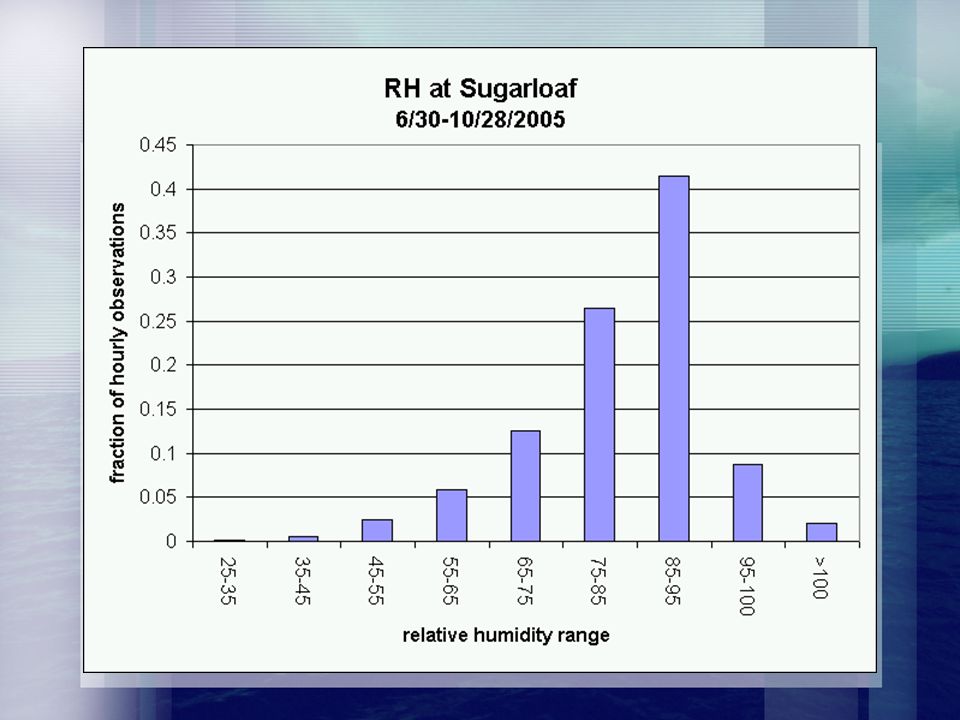
Lake Evaporation equation Evaporation = factor * D ‘factor’ varies with weather, surface conditions, etc. ‘D’ is the difference in vapor pressure between two different air masses If this year’s atmospheric humidity was essentially ‘normal’ (don’t know yet) then using the above equation, evap would have been about 0.5 foot more than ‘normal’ this Aug-Oct.
 then using the above equation, evap would have been about 0.5 foot more than ‘normal’ this Aug-Oct..")
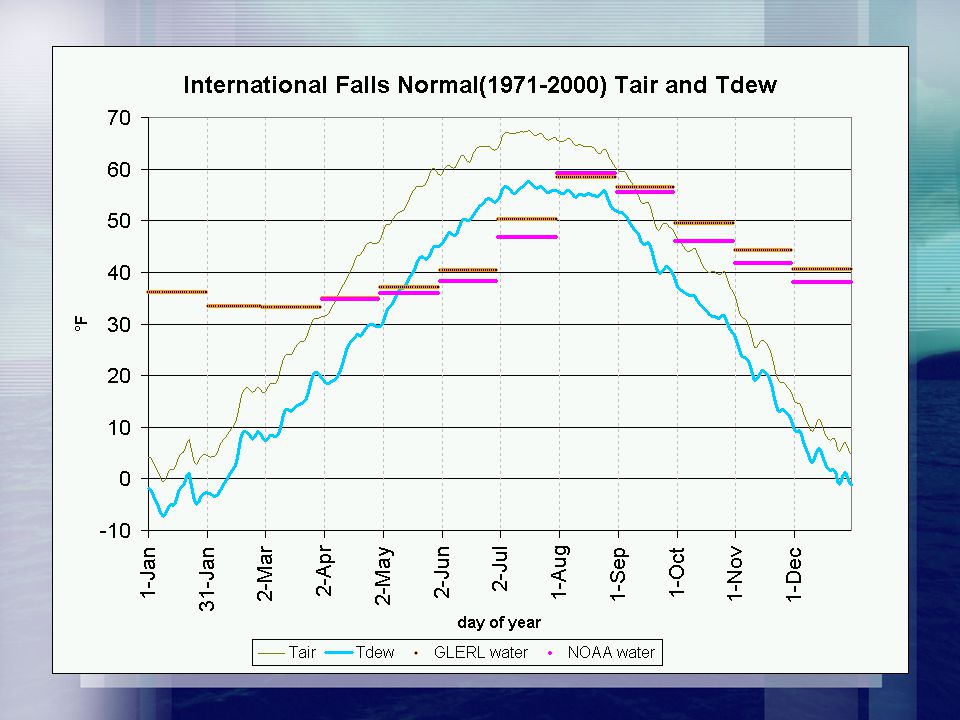
33
Lake Evaporation equation September water at 9+°F ’above normal’ has cooled to a little more than 5+°F by Oct 23. The water will tend toward 32°F (and be ‘more normal’) as winter progresses. If water temperature becomes ‘normal’ by mid- winter, an additional 0.2 feet or more than ‘normal’ can be expected to evaporate from the lake this winter.
 as winter progresses. If water temperature becomes ‘normal’ by mid- winter, an additional 0.2 feet or more than ‘normal’ can be expected to evaporate from the lake this winter..")
34
A range of almost 4 feet in the observational record. Lake Level: Where will it actually end up?

35
Winter 2006-07 Outlook (a strong ‘el nino’ influence)
")
36
Let it snow! Varley

38
Lake Superior North Shore Climate Jim Zandlo State Climatology Office DNR-Waters 2006 (thermochrons)
")
39
Thermochrons, transects Thermochrons, the dime sized devices that measure and store thousands of temperatures, are being used throughout the SnowRules! study area to gather temperatures where the snow falls, namely on snowboards. They are also being used to get air and water temperatures at a few other locations. See the data at climate.umn.edu/SnowRules

40
f ° F at 5/28/2006 12:00

42
Let it snow!

47
Superior Climate 2005-06 snow season Dry summer –Near record low water levels (1925-26) on Lake Superior –Basic hydrology Summer is primary recharge period for Lake Superior GLERL time series What happens next?
 on Lake Superior –Basic hydrology Summer is primary recharge period for Lake Superior GLERL time series What happens next")
48
Let it snow!

49
A range of almost 4 feet in the observational record. Lake Level:

50
Superior Climate Geography and Hydrology Summarizing the observations –Normal Temperature –Satellite-based measurements –Is it ‘elevation’ or ‘the lake’ –Normal Precipitation –Snowfall patterns –Temperature versus snow

51
Great Lakes Hydrology (climate) Basin maps: limited detail Balance of incoming/outgoing –Superior evaporation smaller fraction of precipitation than other great lakes Lake levels are ‘integrator’
 Basin maps: limited detail Balance of incoming/outgoing –Superior evaporation smaller fraction of precipitation than other great lakes Lake levels are ‘integrator’")
52
Cold! Cool Dry

54
Evapo-transpiration Evapo- transpi- ration

55
Runoff

56
A range of almost 4 feet in the observational record. Lake Level:

57
Hydrology is ‘forced’ by climate How do patterns arise? –‘weather patterns’ –cool/warm water nearby –topography (Water flows downhill) topo temp evap runoff –All the above interacting (!) What do patterns of ‘climate’ variables look like?
 topo temp evap runoff –All the above interacting (!) What do patterns of ‘climate’ variables look like .")
58
Wind – winter transect Inland: mostly N-NW or S-SW Shore: strong tendency to ‘follow’ Can transport air masses across the shoreline Hibbing Grand Marais airport Grand Marais shore

59
Wind – winter along shore ‘Everywhere’ along shore has strong tendency for ‘along shore’ winds in winter Two Harbors Silver Bay Grand Marais shore

60
Wind – seasons at Grand Marais Tendency to be ‘along shore’ less in summer

61
Air moisture (air mass)
")
62
Normal Temperature Biggest near shore influences near equinoxes –Land near seasonal extremes –Lake ‘lags’ land by a month or two Detail limited by 25-mile NWS observer spacing winter(DJF) spring(MAM) summer(JJA) fall(SON)
 spring(MAM) summer(JJA) fall(SON)")
63
Satellite-based ice observations Most of Minnesota averages less than 2 months. Much of north shore not until Feb ‘ice out’ by early to mid-March

64
20 years of buoy data at red circle. No mid- winter buoy data is available. Commonly open water in mid-winter means a large wet surface near 32 degrees is often near the north shore anytime during winter.

65
Land versus ‘sea’ Two Harbors and Grand Marais temps ‘buoyed up’ in winter, ‘anchored’ to lower values in summer. Water maximum lags land maximum.

66
Land versus ‘sea’ Shore virtually identical in winter to MSP 150 miles south! At Babbitt about 6 F cooler than MSP year-round. Land versus ‘sea’

67
Temperature is also affected by elevation. Some of the steepest gradients of the Great Lakes are along Minnesota’s north shore.

68
Thermochrons, transects Thermochrons are dime sized devices that measure and store thousands of temperatures. A contact sensor is later used to download the data.

69
‘Board’ versus ‘air’

70
Sea breeze by day …

71
Land breeze at night

72
Normal Precipitation Everywhere in Minnesota… –Summer is wettest –Winter is driest North shore ‘bands’ most apparent fall, winter –Warmer lake provides energy and moisture winter(DJF) spring(MAM) summer(JJA) fall(SON)
 spring(MAM) summer(JJA) fall(SON)")
73
Snow fraction peak

74
Tettegouche SP transect

75
Let it snow!

Similar presentations


 Small geographic area Can change rapidly.>")

