Download presentation
Presentation is loading. Please wait.

1
Population Genetics Ch. 23 and Beyond; Lab/Lecture Same

2
Math Calisthenics I Ladybug Population Generation One Calculate TOTAL # A AA = 200 Aa = 100 aa = 200 Calculate Total # a

3
Math Calisthenics I Ladybug Population Generation One Calculate TOTAL # A (200 X 2) + (100 X 1) Total A = 500 AA = 200 Aa = 100 aa = 200 Calculate Total # a (200 X 2) + (100 X 1) Total a = 500
 + (100 X 1) Total A = 500 AA = 200 Aa = 100 aa = 200 Calculate Total # a (200 X 2) + (100 X 1) Total a = 500")
4
Calculate TOTAL # A (200 X 2) + (100 X 1) Total A = 500 Convert to % A Calculate Total # a (200 X 2) + (100 X 1) Total a = 500 Convert to % a
 + (100 X 1) Total A = 500 Convert to % A Calculate Total # a (200 X 2) + (100 X 1) Total a = 500 Convert to % a")
5
Calculate TOTAL # A (200 X 2) + (100 X 1) Total A = 500 Convert to % A 500/1000 = 0.5 (AVOID USING 50%) Calculate Total # a (200 X 2) + (100 X 1) Total a = 500 Convert to % a 500/1000 = 0.5 (AVOID USING 50%)
 + (100 X 1) Total A = 500 Convert to % A 500/1000 = 0.5 (AVOID USING 50%) Calculate Total # a (200 X 2) + (100 X 1) Total a = 500 Convert to % a 500/1000 = 0.5 (AVOID USING 50%)")
6
Ladybug Population Generation Two Calculate TOTAL # A AA = 300 Aa = 100 aa = 100 Calculate Total # a

7
Ladybug Population Generation Two Calculate TOTAL # A (300 X 2) + (100 X 1) Total A = 700 AA = 300 Aa = 100 aa = 100 Calculate Total # a (100 X 2) + (100 X 1) Total a = 300
 + (100 X 1) Total A = 700 AA = 300 Aa = 100 aa = 100 Calculate Total # a (100 X 2) + (100 X 1) Total a = 300")
8
Calculate TOTAL # A (300 X 2) + (100 X 1) Total A = 700 Convert to % A Calculate Total # a (100 X 2) + (100 X 1) Total a = 300 Convert to % a
 + (100 X 1) Total A = 700 Convert to % A Calculate Total # a (100 X 2) + (100 X 1) Total a = 300 Convert to % a")
9
Calculate TOTAL # A (300 X 2) + (100 X 1) Total A = 700 Convert to % A 700/1000 = 0.7 Calculate Total # a (100 X 2) + (100 X 1) Total a = 300 Convert to % a 300/1000 = 0.3
 + (100 X 1) Total A = 700 Convert to % A 700/1000 = 0.7 Calculate Total # a (100 X 2) + (100 X 1) Total a = 300 Convert to % a 300/1000 = 0.3")
10
In the language of population genetics, p = % DOMINANT ALLELES q = % RECESSIVE ALLELES pq Ladybug Generation 1 Ladybug Generation 2

11
In the language of population genetics, p = % DOMINANT ALLELES q = % RECESSIVE ALLELES pq Ladybug Generation 1 0.5 Ladybug Generation 2 0.70.3

12
Class brainstorming - what might cause a shift in allele frequencies (% A/a or p/q)?
")
13
Hardy-Weinberg (1908) predicted allele frequencies would NOT change if…
 predicted allele frequencies would NOT change if…")
14
LARGE POPULATION

15
Genetic Drift: allele % fluctuations due to TOO SMALL SAMPLE - BOTTLENECK

16
Hardy-Weinberg (1908) predicted allele frequencies would NOT change if… LARGE POPULATION NO MIGRATION
 predicted allele frequencies would NOT change if… LARGE POPULATION NO MIGRATION")
17
Hardy-Weinberg (1908) predicted allele frequencies would NOT change if… LARGE POPULATION NO MIGRATION NO MUTATIONS
 predicted allele frequencies would NOT change if… LARGE POPULATION NO MIGRATION NO MUTATIONS")
18
Hardy-Weinberg (1908) predicted allele frequencies would NOT change if… LARGE POPULATION NO MIGRATION NO MUTATIONS MATING RANDOM
 predicted allele frequencies would NOT change if… LARGE POPULATION NO MIGRATION NO MUTATIONS MATING RANDOM")
19
Hardy-Weinberg (1908) predicted allele frequencies would NOT change if… LARGE POPULATION NO MIGRATION NO MUTATIONS MATING IS RANDOM NO SELECTION FOR CERTAIN TRAITS
 predicted allele frequencies would NOT change if… LARGE POPULATION NO MIGRATION NO MUTATIONS MATING IS RANDOM NO SELECTION FOR CERTAIN TRAITS")
20
Predicting and Detecting Variation

21
For dom/rec traits, which is only genotype you know for certain based on phenotype?

22
HW developed a useful predictive equation: p 2 + 2pq + q 2 = 1

23
Let’s say you want to predict the # carriers of a new recessive disease allele. Math Calisthenics II Epidemiology Data from Monmouth aa = 1600/10,000 Calculate p Calculate qCalculate p 2 & 2pq

24
Let’s say you want to predict the # carriers of a new recessive disease allele. Math Calisthenics II Epidemiology Data from Monmouth aa = 1600/10,000 Calculate p Calculate q q 2 = 1600/10,000 = 0.16 = 0.4 = q Calculate p 2 & 2pq

25
Let’s say you want to predict the # carriers of a new recessive disease allele. Math Calisthenics II Epidemiology Data from Monmouth aa = 1600/10,000 Calculate p p + q = 1… SO 1 - 0.4 = p 0.6 = p Calculate q q 2 = 1600/10,000 = 0.16 = 0.4 = q Calculate p 2 & 2pq

26
Let’s say you want to predict the # carriers of a new recessive disease allele. Math Calisthenics II Epidemiology Data from Monmouth aa = 1600/10,000 Calculate p p + q = 1… SO 1 - 0.4 = p 0.6 = p Calculate q q 2 = 1600/10,000 = 0.16 = 0.4 = q Calculate p 2 & 2pq p 2 = (0.6)(0.6) = 0.36 2pq = 2(0.6)(0.4) = 0.48
(0.6) = pq = 2(0.6)(0.4) =")
27
Check Work! Does p 2 + 2pq + q 2 = 1? What does this data mean??? Lab: Aside from disease/carrier status, why is knowing heterozygosity important?

28
Many alleles display polymorphisms detectable at DNA OR PROTEIN LEVEL

29
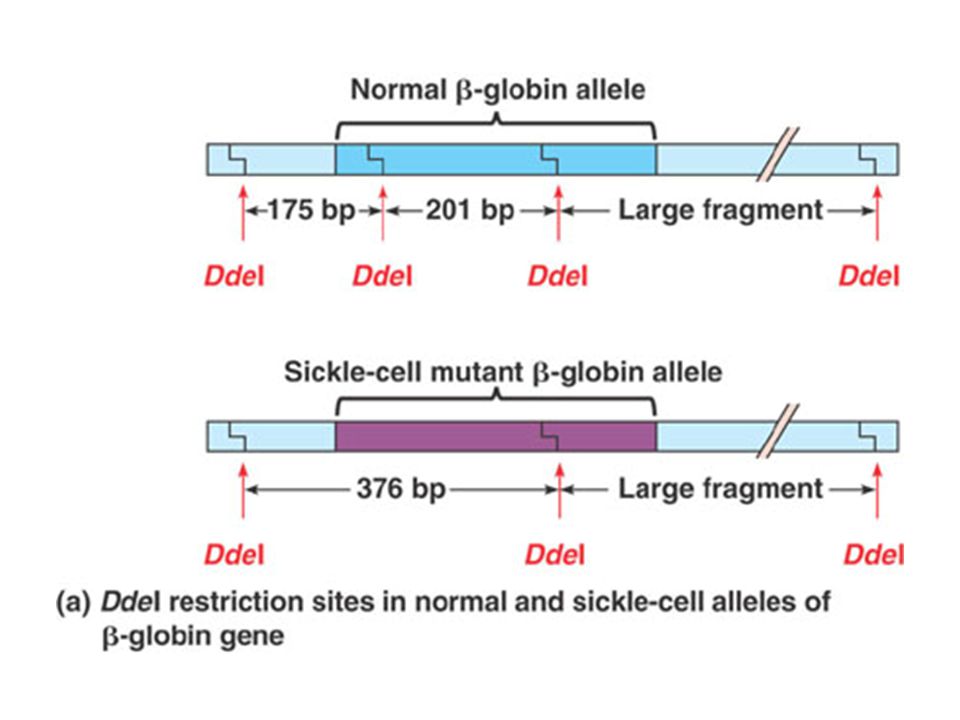
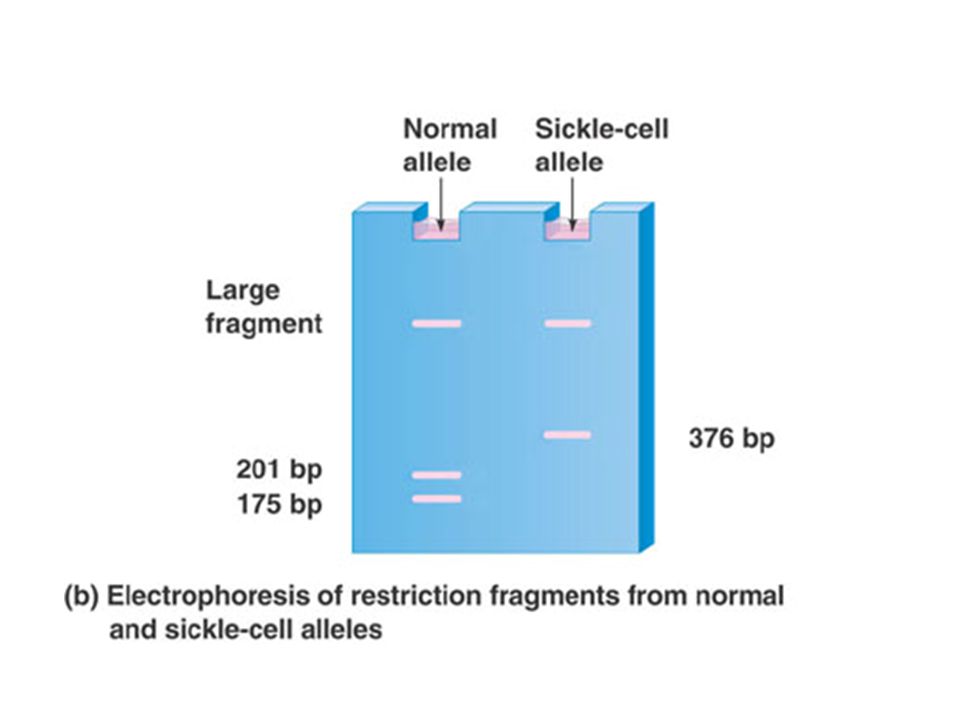
Now consider sickle cell polymorphism…

30
Prokaryotes make protective nucleases called RESTRICTION ENZYMES (20.1-2)
")
31
e.g. DdeI cuts CTTAG - distinguishes hemoglobin alleles (Fig. 20.9)
")
34
In lab, you will explore protein gels of enzyme complexes to predict genotypes.

35
Consider that some enzymes are made of single proteins - MONOMERS Hom/DomHom/RecHet/Dom 1 BAND 2 BANDS

36
Others are made of multiple proteins - e.g. DIMERS, 2 FOLDED CHAINS Hom/DomHom/RecHet/Dom 1 BAND 3 BANDS

37
Population Genetics and Evolution

38
Do any populations meet HW conditions? RARELY AND NOT FOR LONG

39
Evolution: CHANGES in the genetic makeup of a population OVER TIME

Similar presentations


, each with a different frequency of A alleles (px and py). Assume migrants are from population.>")

. Since the Time of Darwin Darwin did not explain how variation originates or passed on The genetic principles.>")


 Galapagos Islands Many similar species had slight differences Favorable variations allow.>")


