Download presentation
Presentation is loading. Please wait.

1
Communicating With Your Physicians Through Dashboard Data Developing a Practice Dashboard MGMA Anesthesia Administration Assembly May 2010 Joe Laden MGMA member since 1981 AAA Member since inception Business Manager Anesthesia Associates of Louisville, PSC joeladen@aalouisville.com

2
Following this session you will be able to: Develop a strategy to produce an effective practice dashboard Identify key information that should be communicated to physicians Gain insight as to the spreadsheets and graphic software available

3
6/16/2015 12:09:24 AM Anesthesia practice administrators are responsible for gathering, interpreting and disseminating financial data from business systems. The communication of this data must be precise, concise and understandable.

4
What information is important for physicians and their management of their practices? How can this be presented in the most efficient and effective manner?

5
What is an Anesthesia Practice Dashboard?

6
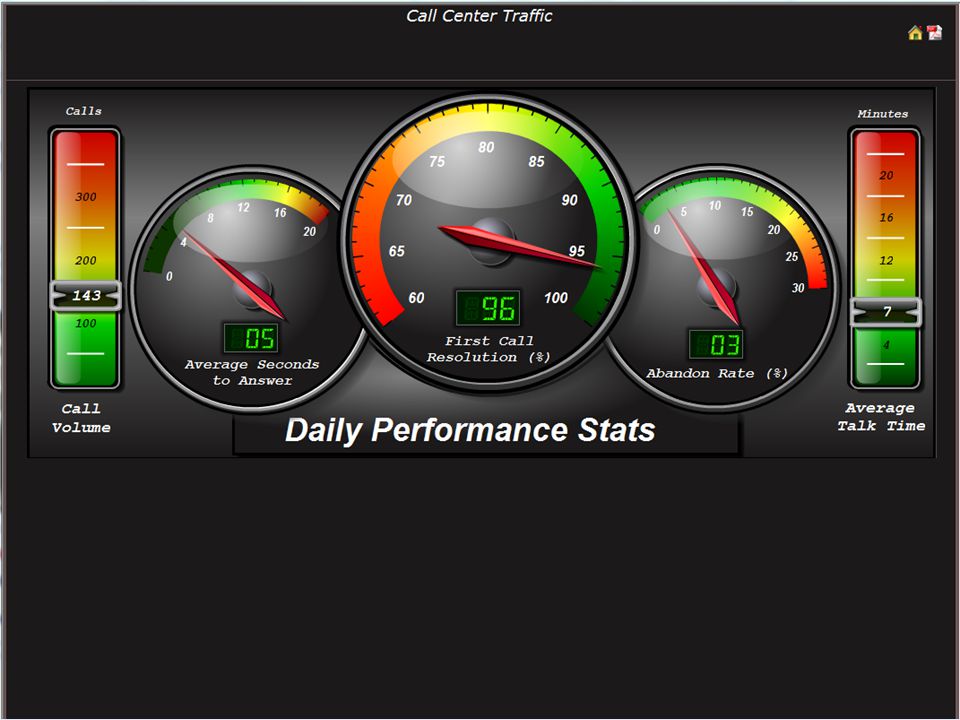
An anesthesia business dashboard can be any form of display that quickly communicates business practice management information to anesthesiologists.

7
In other words... I can’t define dashboard, but I know one when I see it.

8
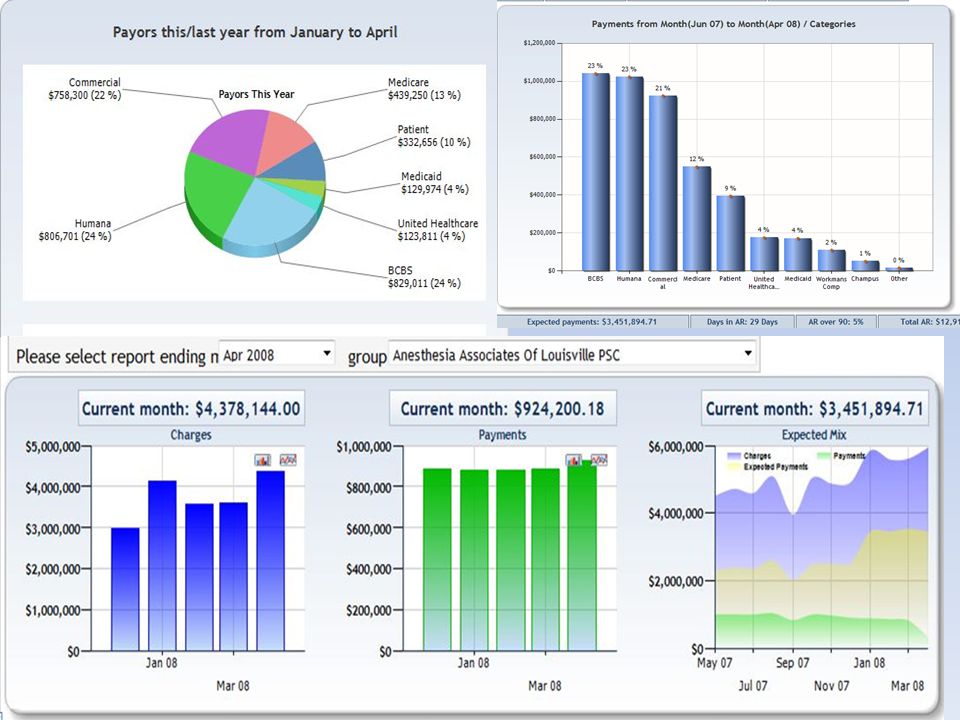
Examples of Anesthesia Dashboards

9
From Practice Management System Billing Software

11
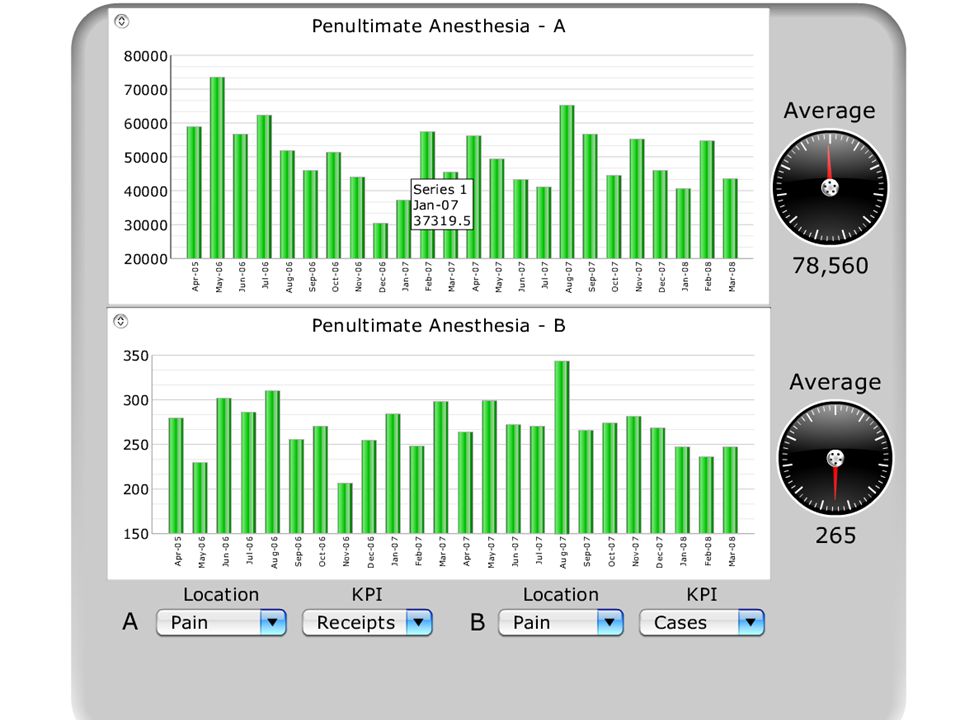
Constructed by Practice

12
July 2010

13
April 2010

15
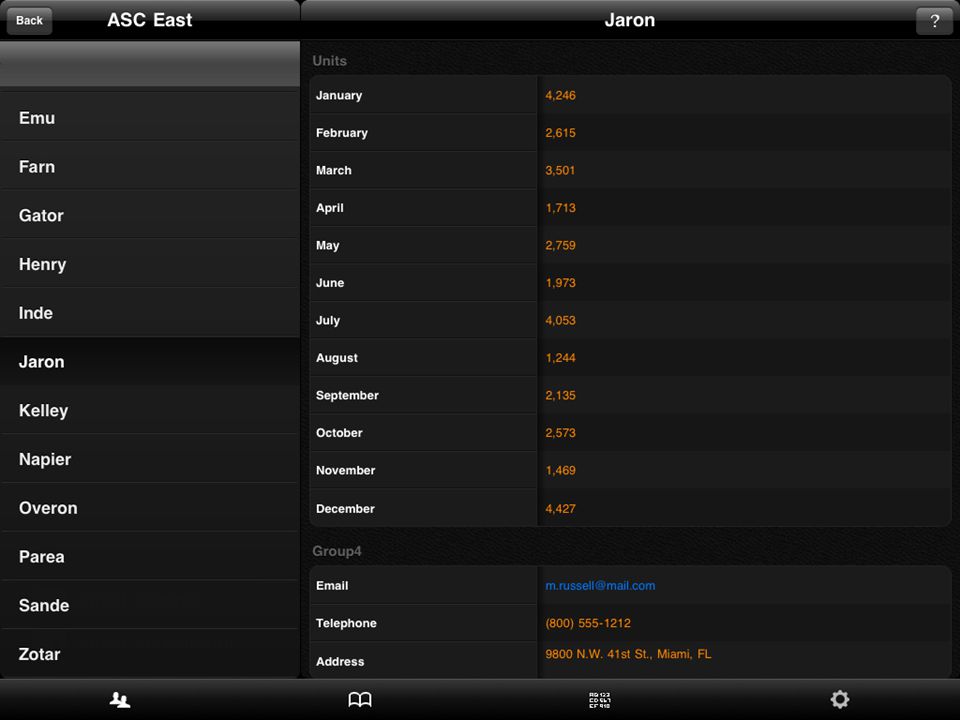
Anesthesia Associates of the United States – May 2010

17
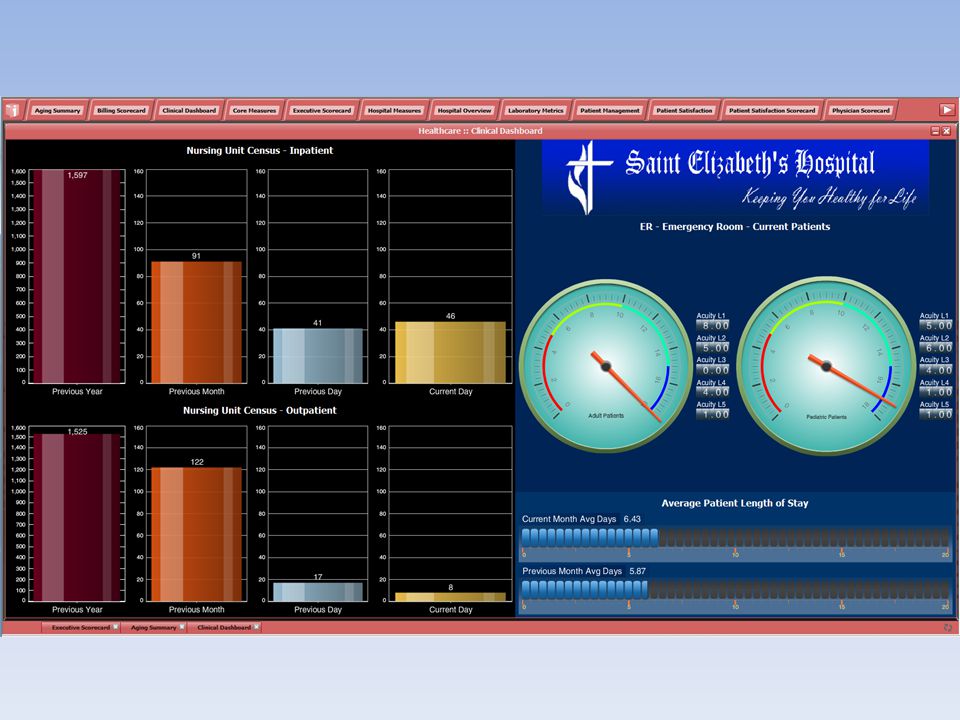
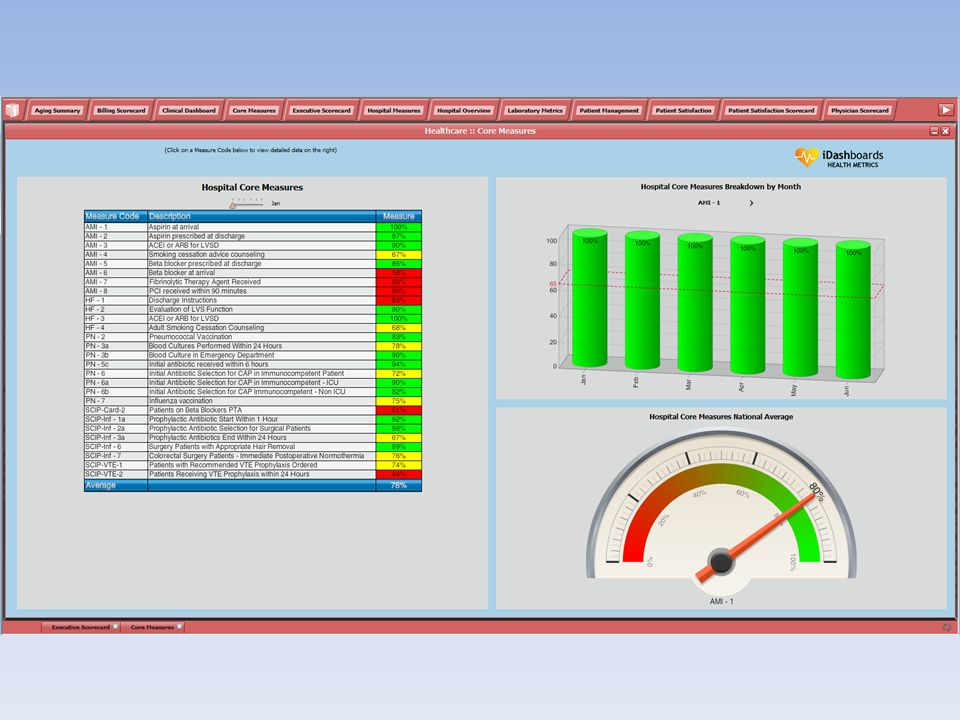
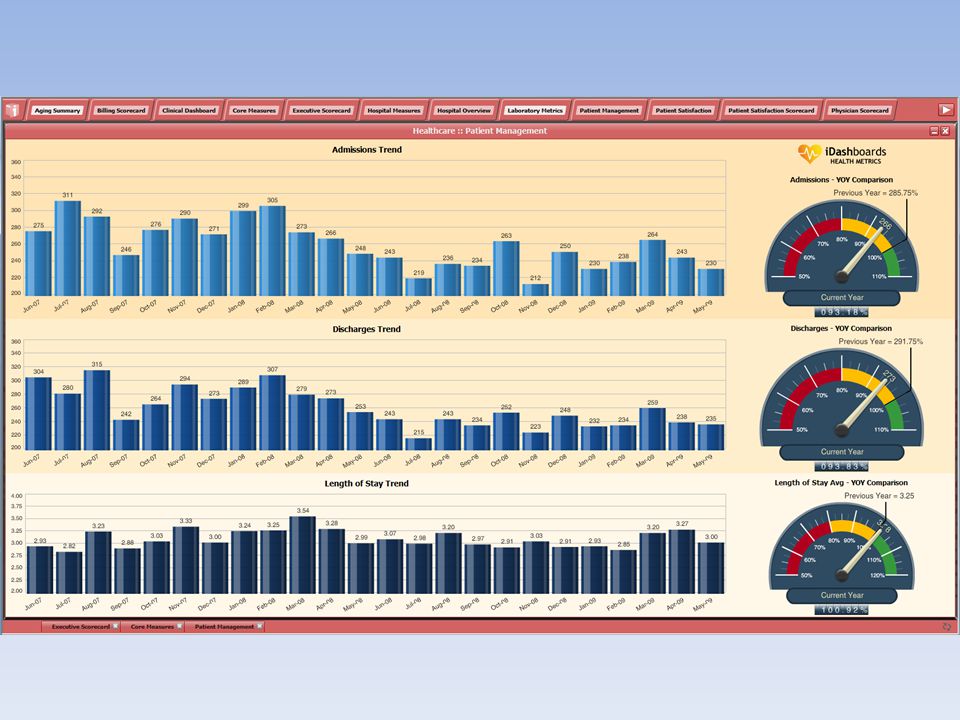
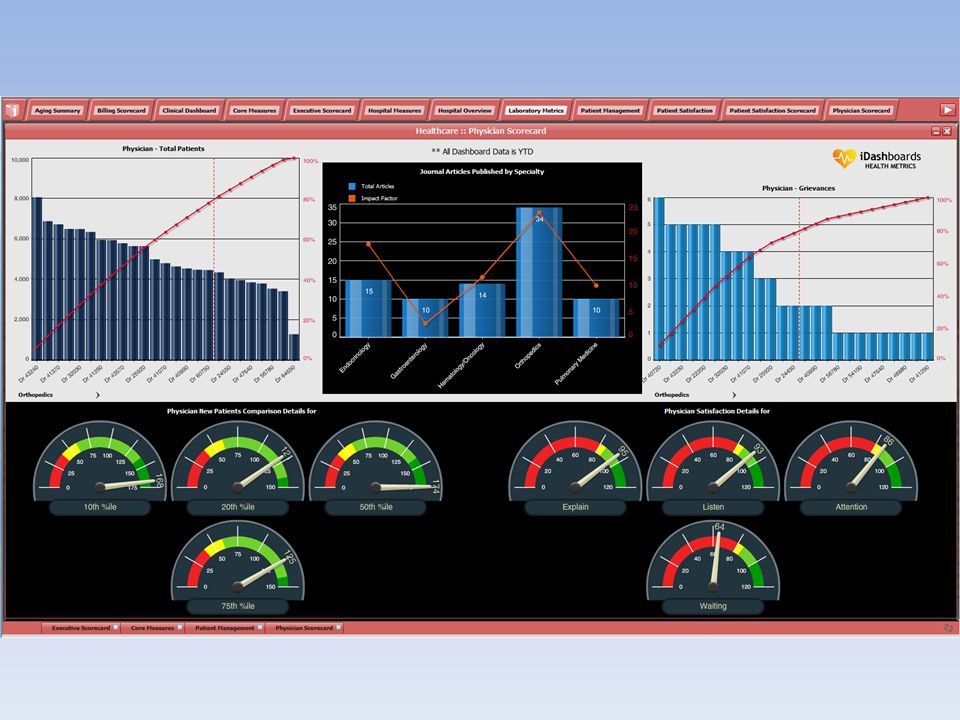
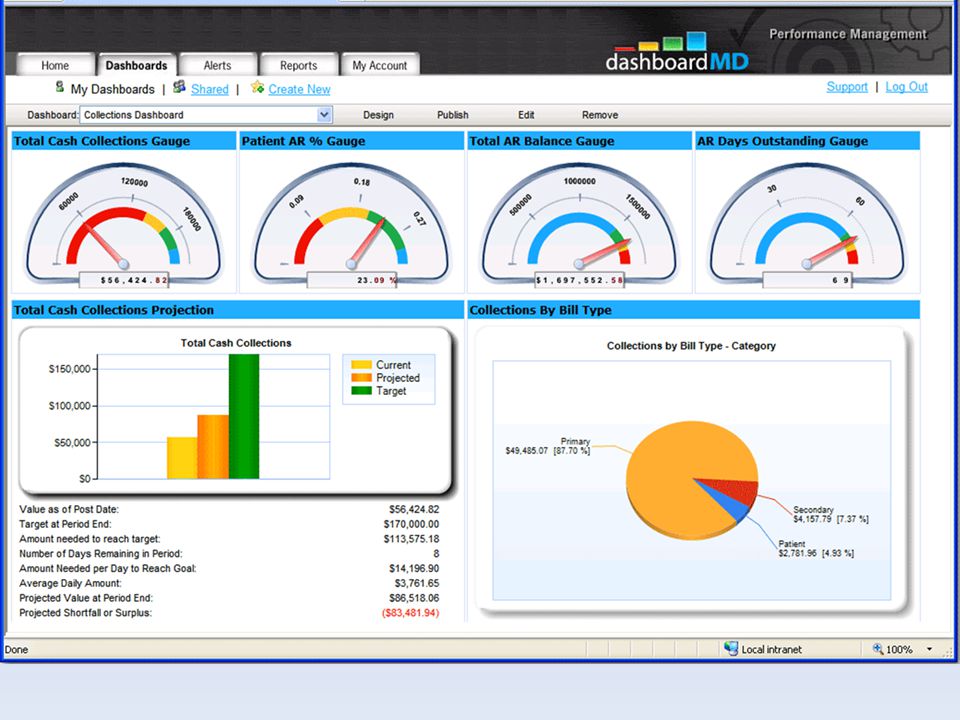
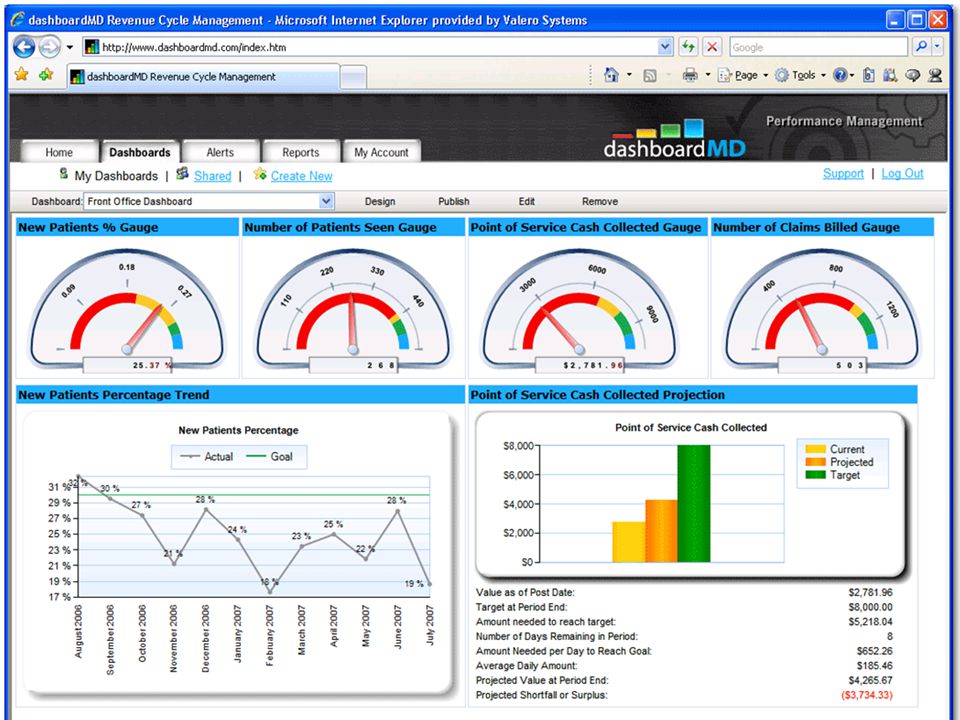
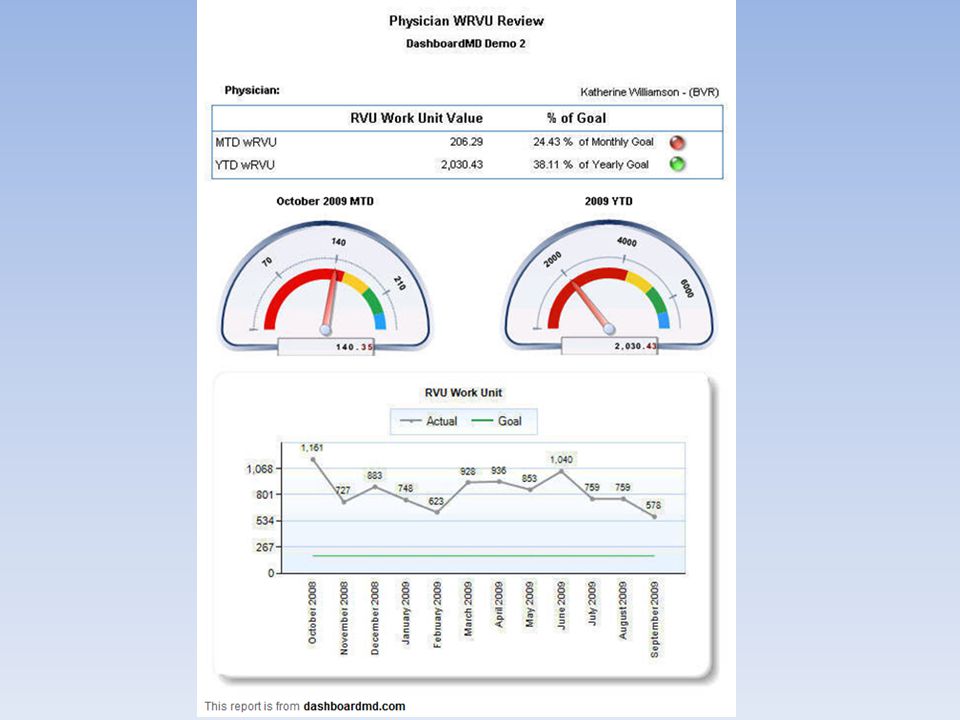
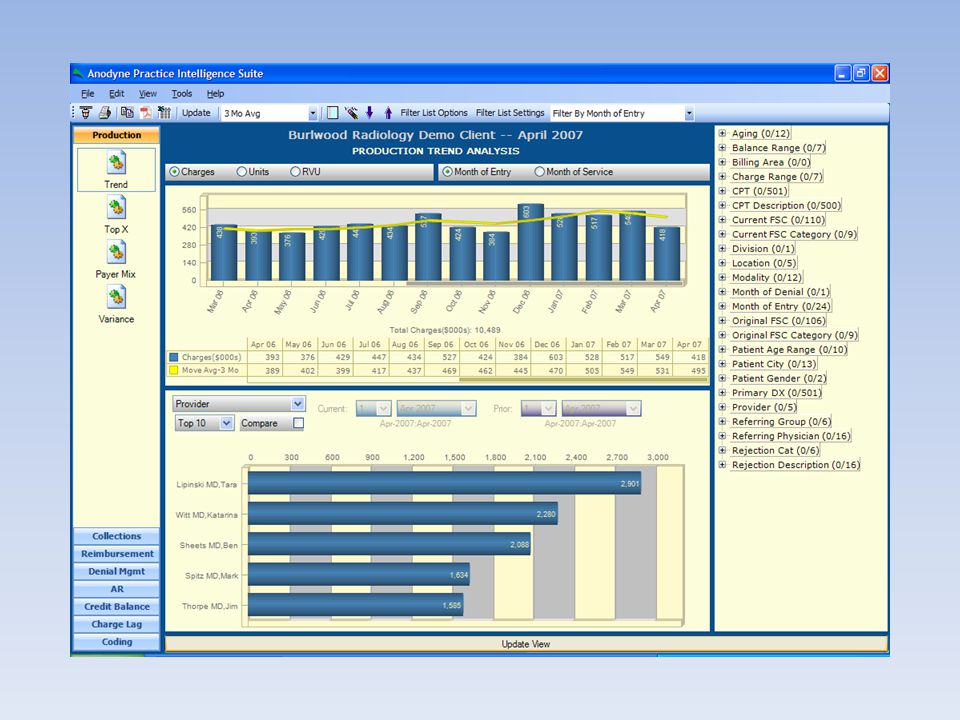
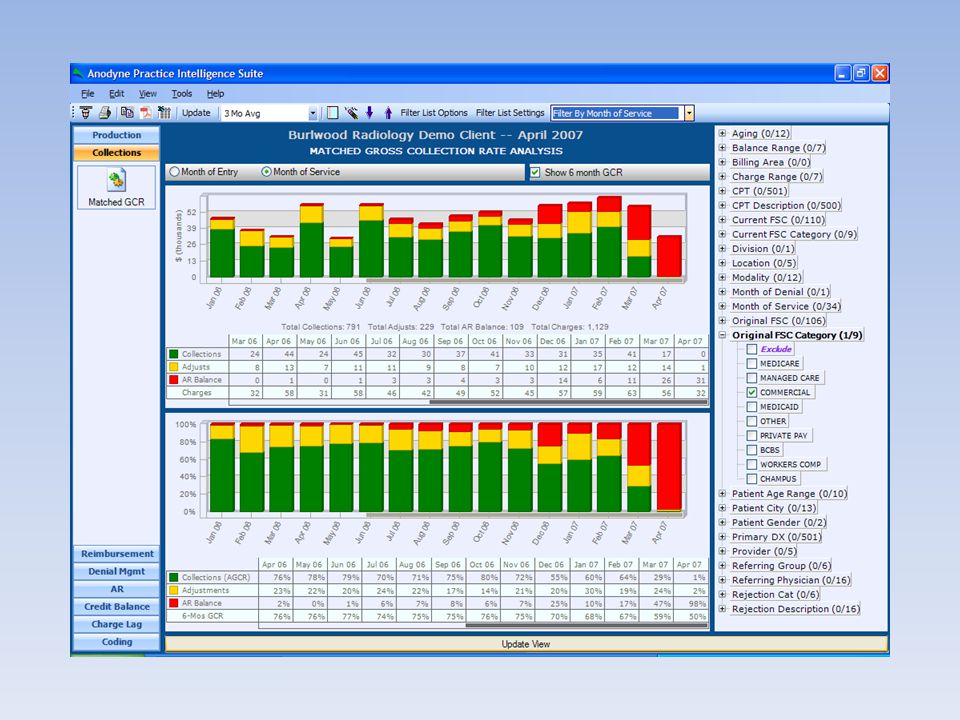
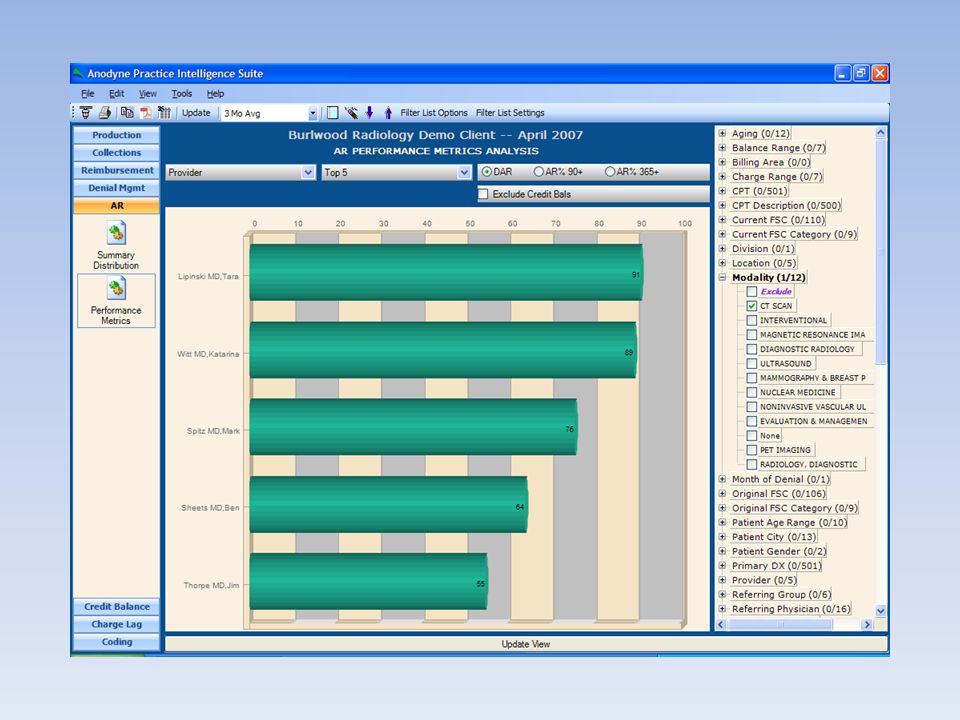
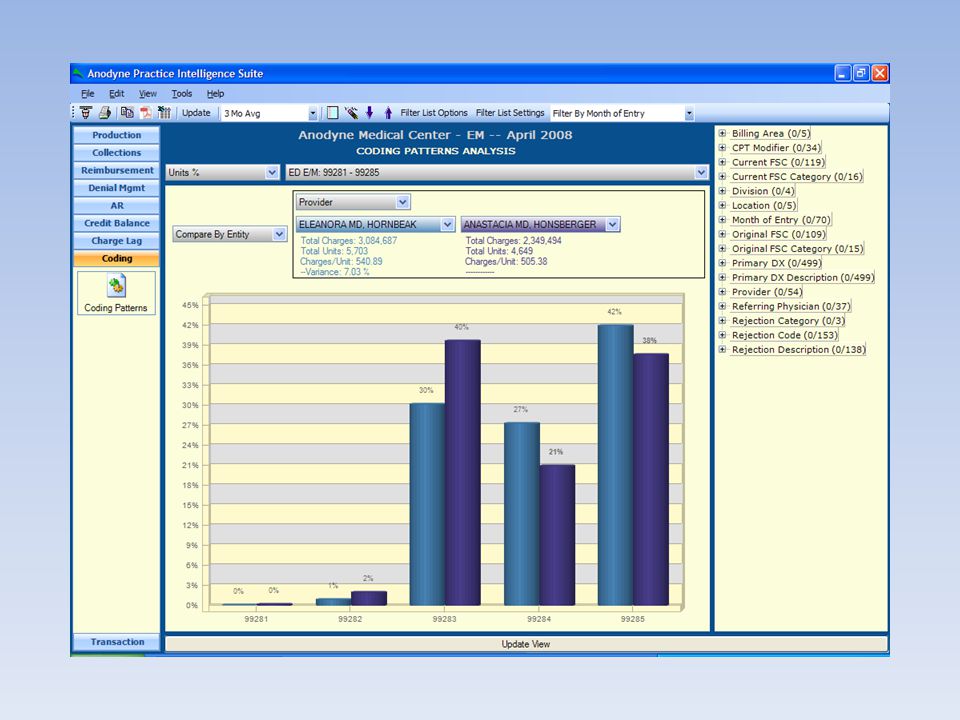
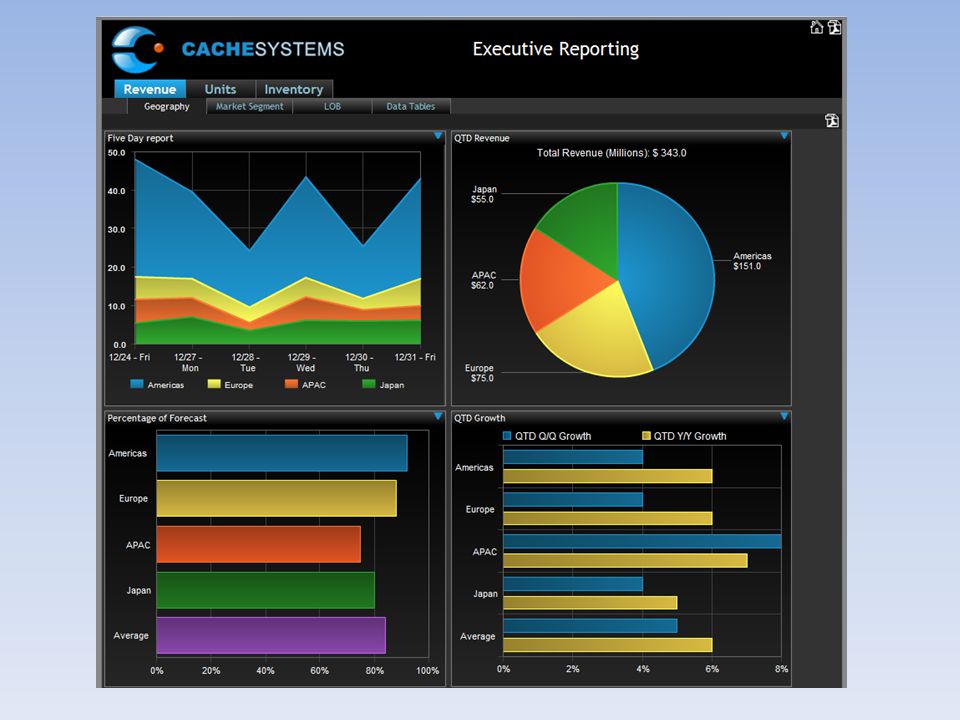
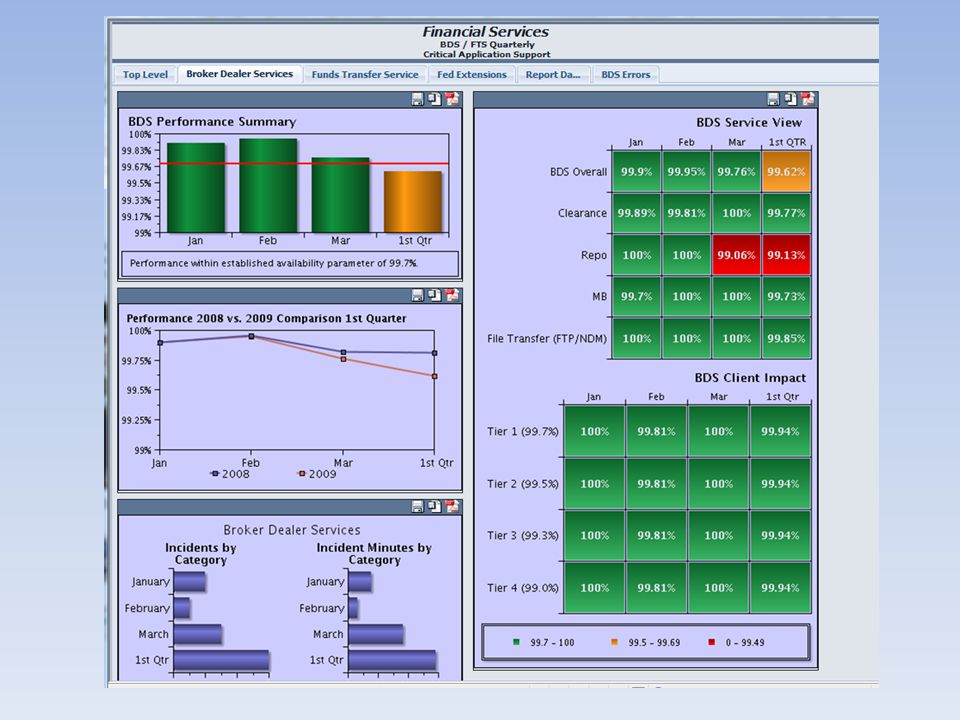
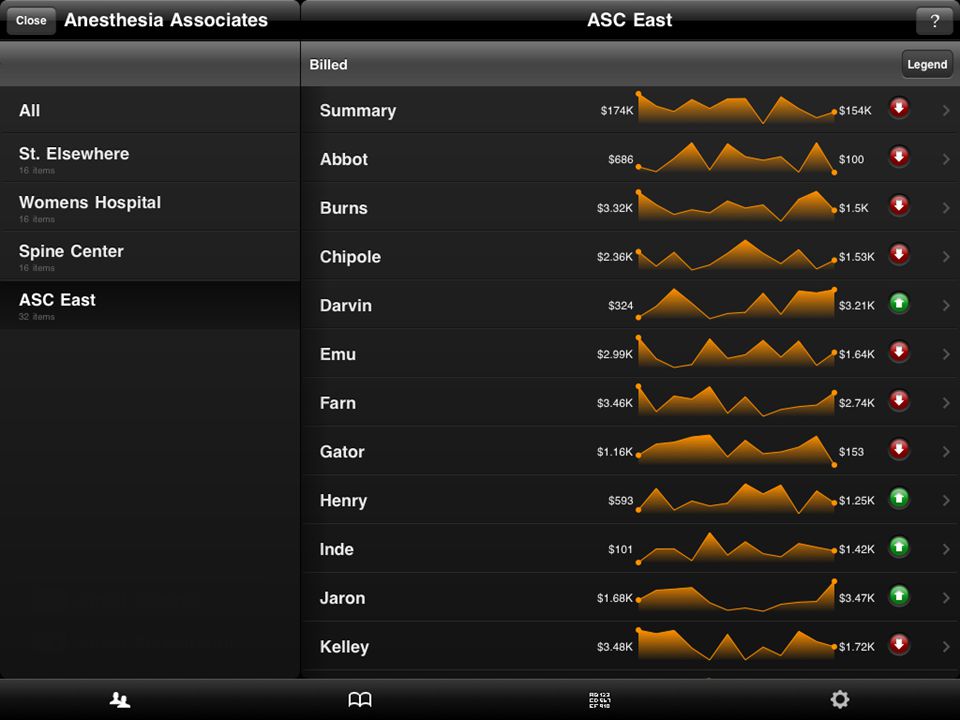
From Third Party Dashboard Company

35
To communicate with physicians effectively, the dashboard should have a sufficient number of data points, but not too many.

36
6/16/2015 12:09:24 AM Dashboard Data Sources Billing System Reports Accounting System Reports o General Ledger o Payroll User Constructed Spreadsheets Currently Produced by Practice

37
Where are Anesthesia Dashboards Available today? Anesthesia Billing Software Vendors Anesthesia Billing Companies Anesthesia Practice Management Companies Report Hosting Companies DashboardMD iDashboards Anodyne DIY for Small – Medium Size Groups

38
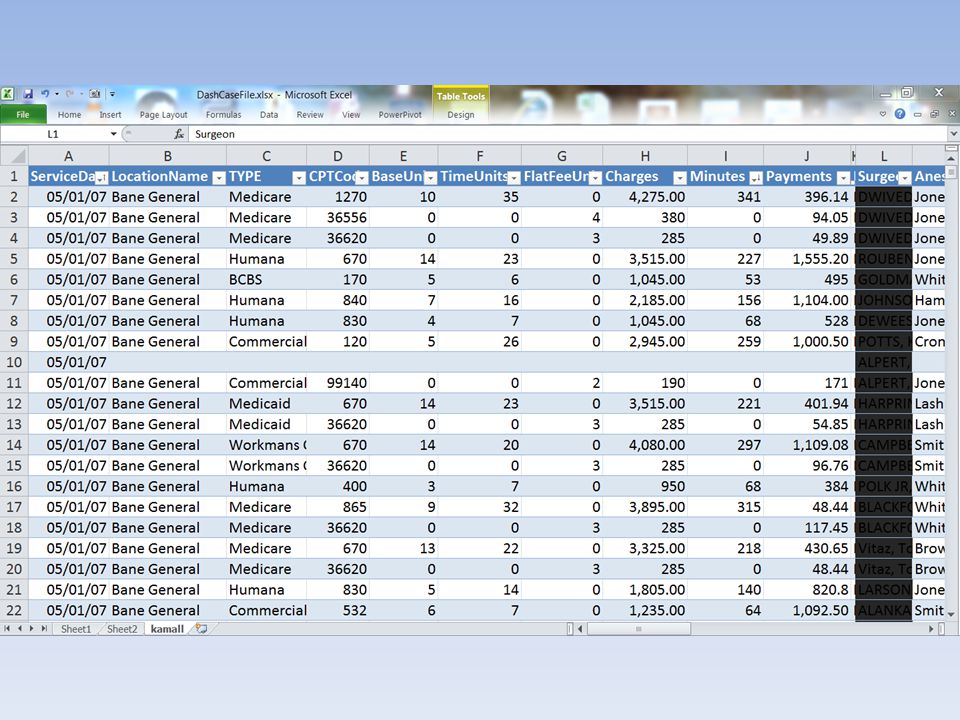
Sources of Data for The Dashboard

39
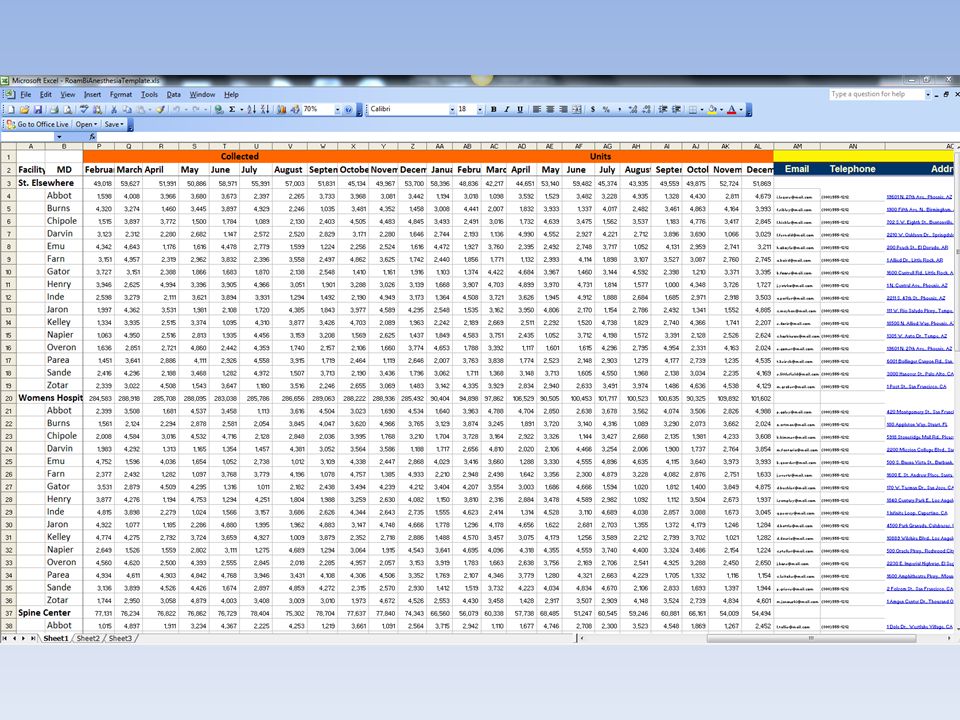
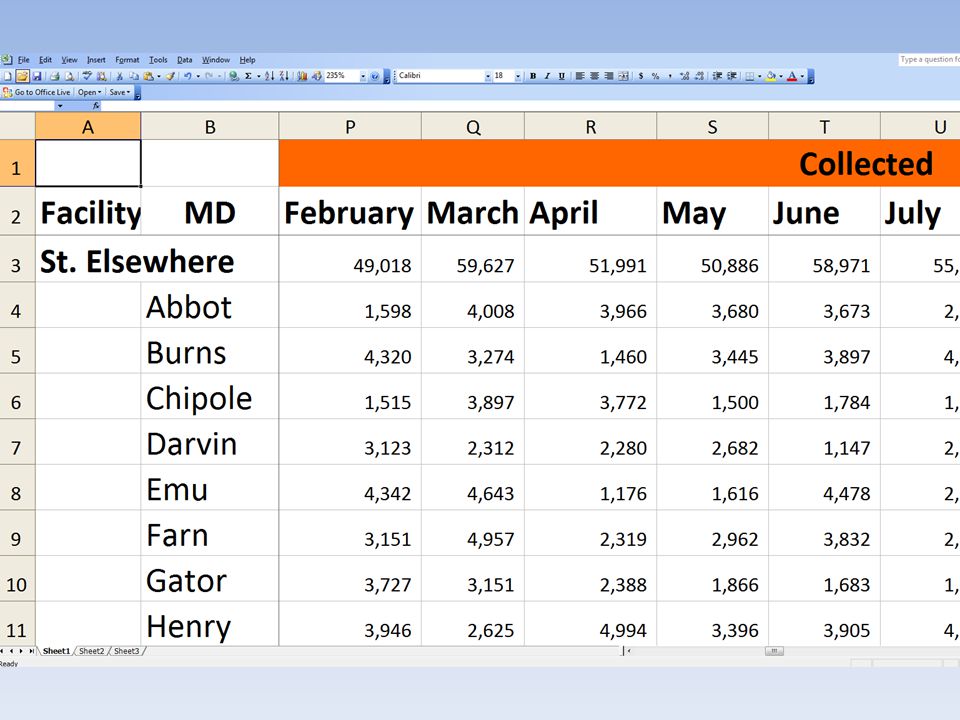
1. Excel Spreadsheets prepared by You

44
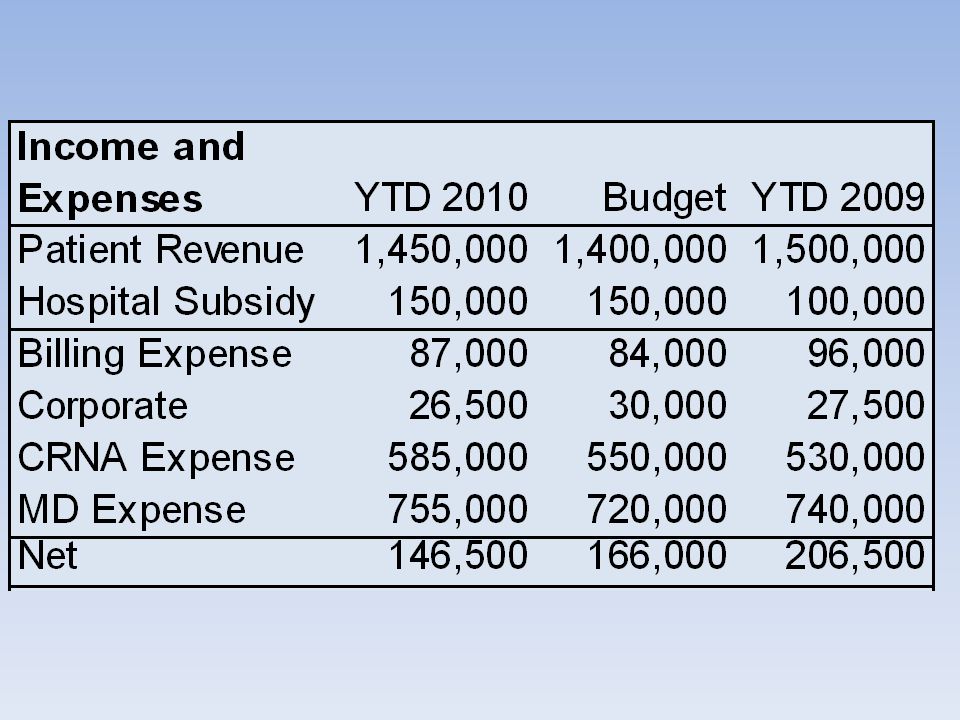
YTD-2010BudgetYTD-2009 Patient Revenue145,000140,000160,000 Hospital Subsidy15,000 10,000 Billing Expense8,7008,4009,600 Corporate Expense2,6503,0002,750 CRNA Expense58,50055,0005,300 MD Expense75,50072,00074,000 Net14,65016,60078,350 Mini Income/Expense Statement

46
Production and Receipts All Locations JuneYTDTrail 12 201020092010200920102009 Cases9509256,1005,92512,50011,700 2.7% 3.0% 6.8% Units11,40011,10073,20071,100150,000140,400 2.7% 3.0% 6.8% Minutes137,750134,125884,500859,1251,812,5001,696,500 2.7% 3.0% 6.8% Gross1,425,0001,387,5009,150,0008,887,50018,750,00017,550,000 2.7% 3.0% 6.8% Receipts467,400455,1003,001,2002,915,1006,150,0005,756,400

47
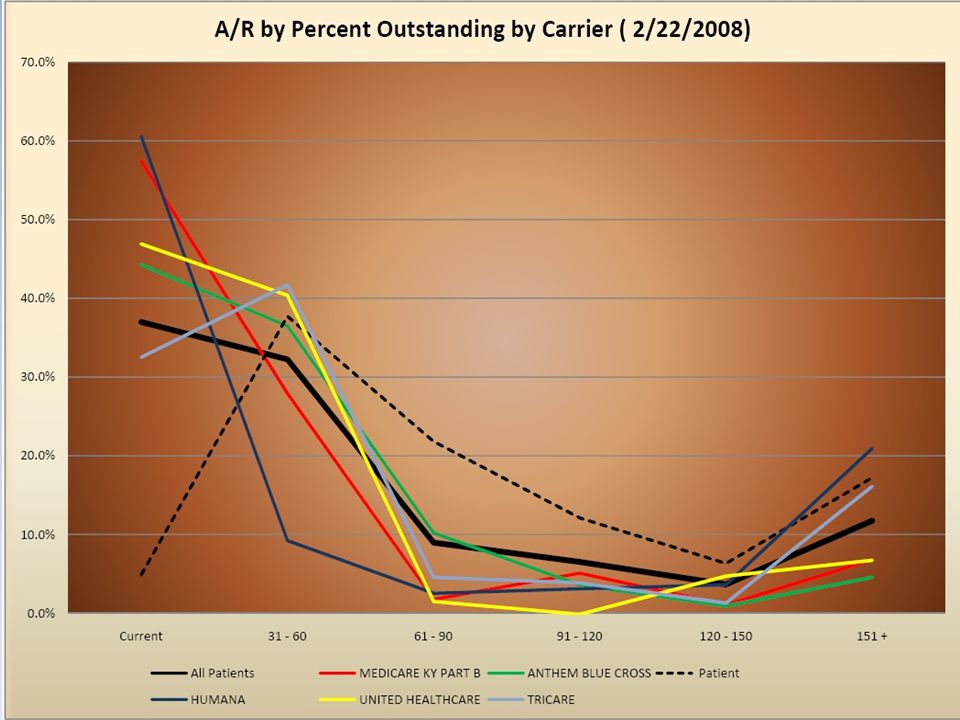
CategoryCurrent31 - 6061 - 9091 - 120120 - 150151 + ALL PATIENTS37.0%32.2%8.9%6.5%3.7%11.7% MEDICARE57.5%27.9%1.7%5.1%1.0%6.8% BLUE CROSS44.3%36.5%10.2%3.6%0.9%4.6% PATIENT4.9%37.7%21.8%12.1%6.3%17.2% HUMANA60.6%9.2%2.5%3.1%3.6%20.9% TRICARE32.5%41.7%4.5%3.8%1.3%16.1% UNITED HEALTH46.9%40.4%1.5%-0.2%4.7%6.7% A/R By Percent Outstanding by Carrier

51
6/16/2015 12:09:24 AM

52
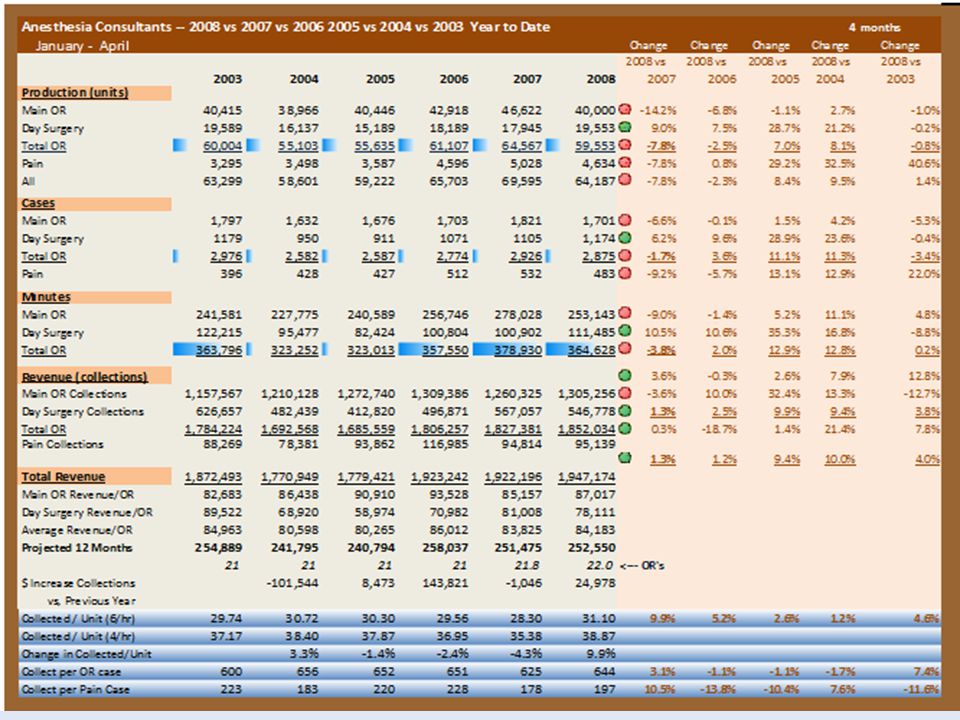
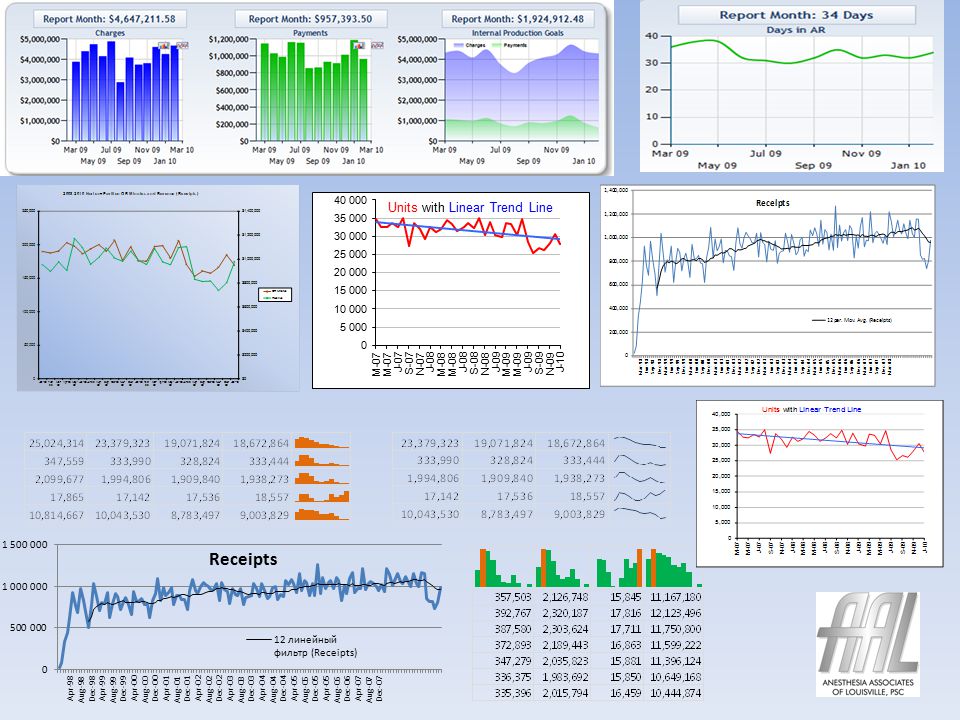
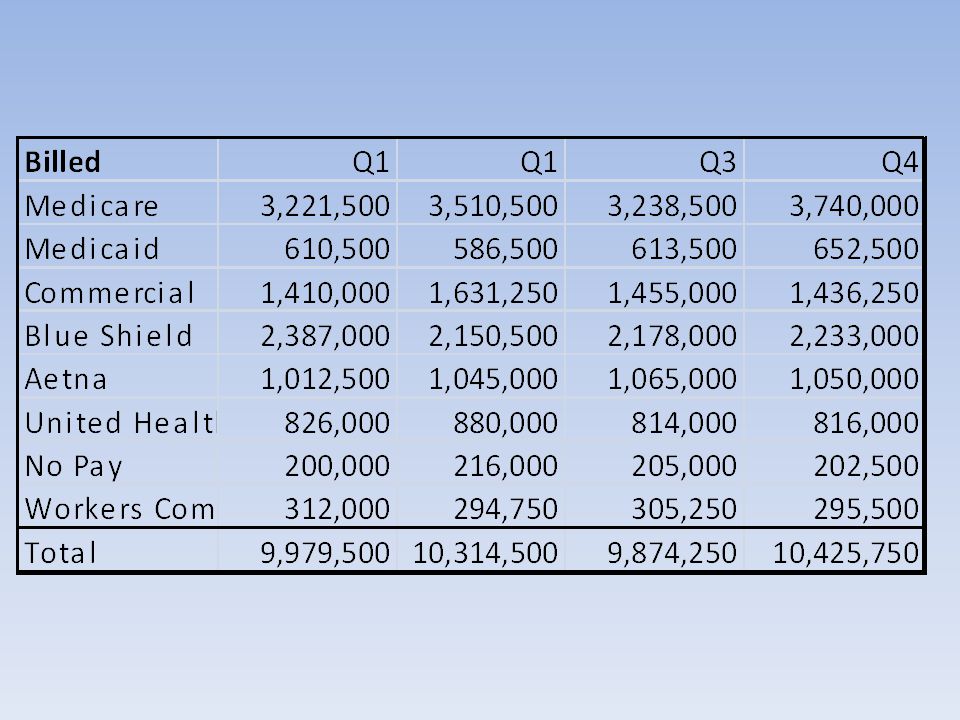
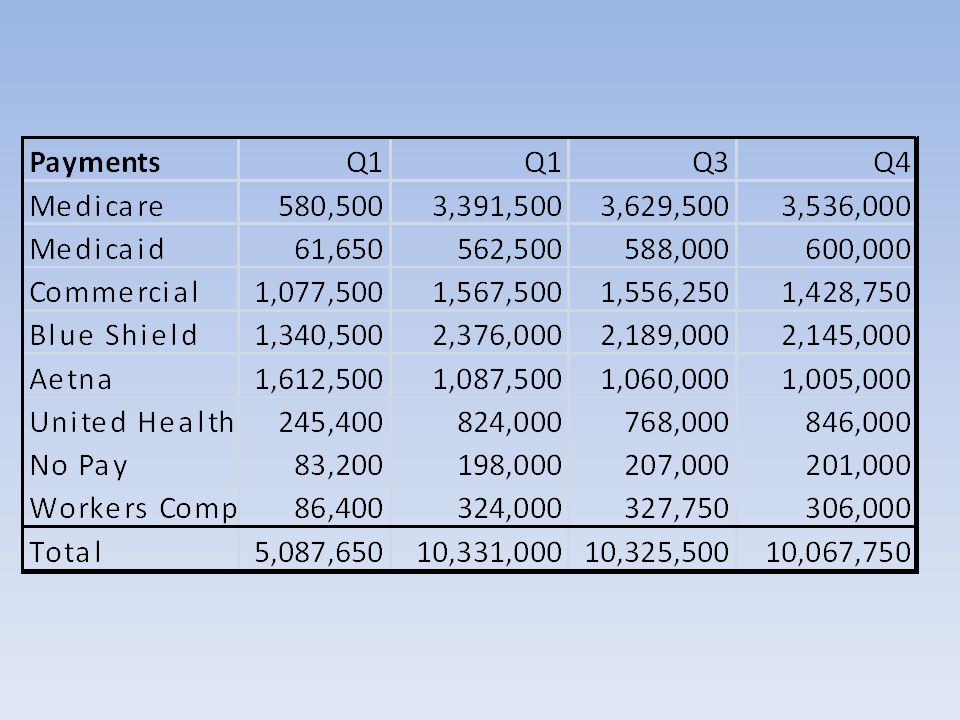
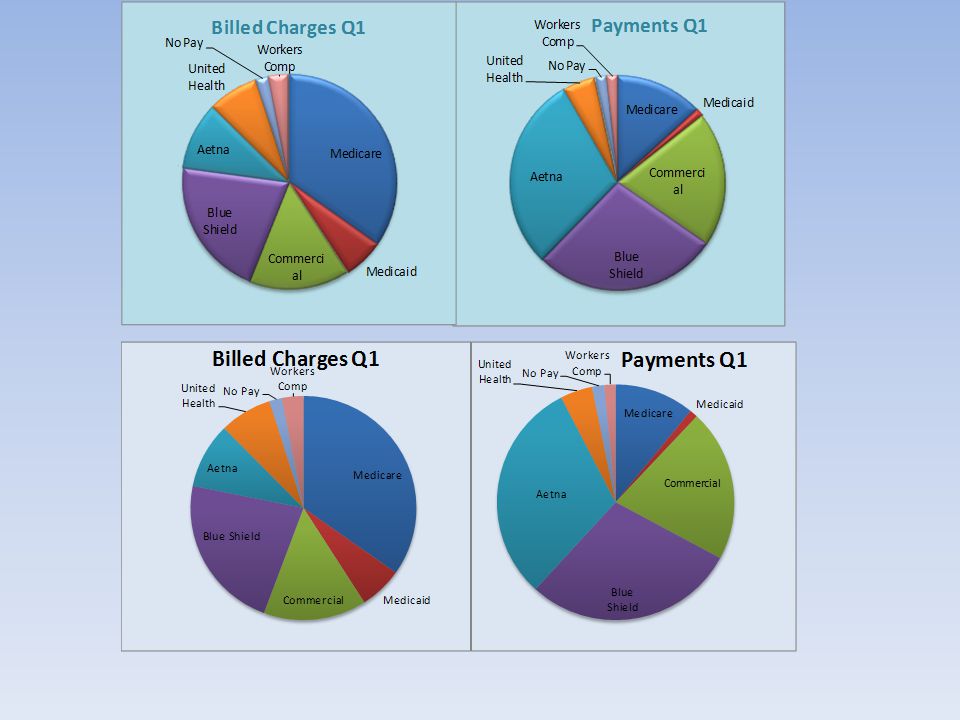
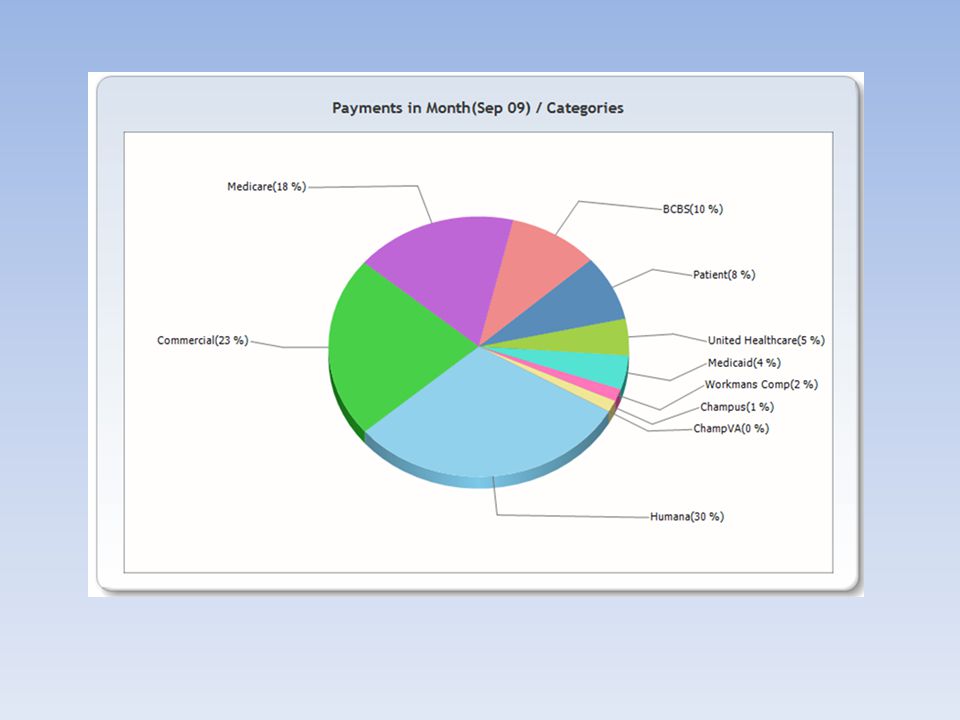
Tabular Data vs. Graphic Display

53
Excel 2010 Sparkline

54
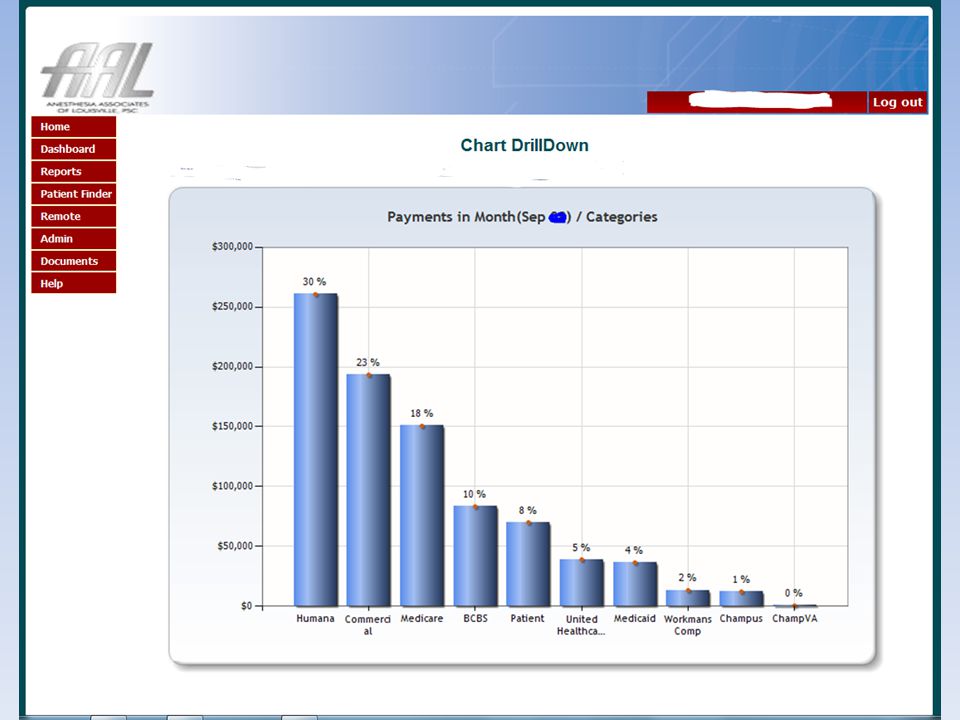
2. Reports and Displays from Billing System

59
3. Accounting System Reports

61
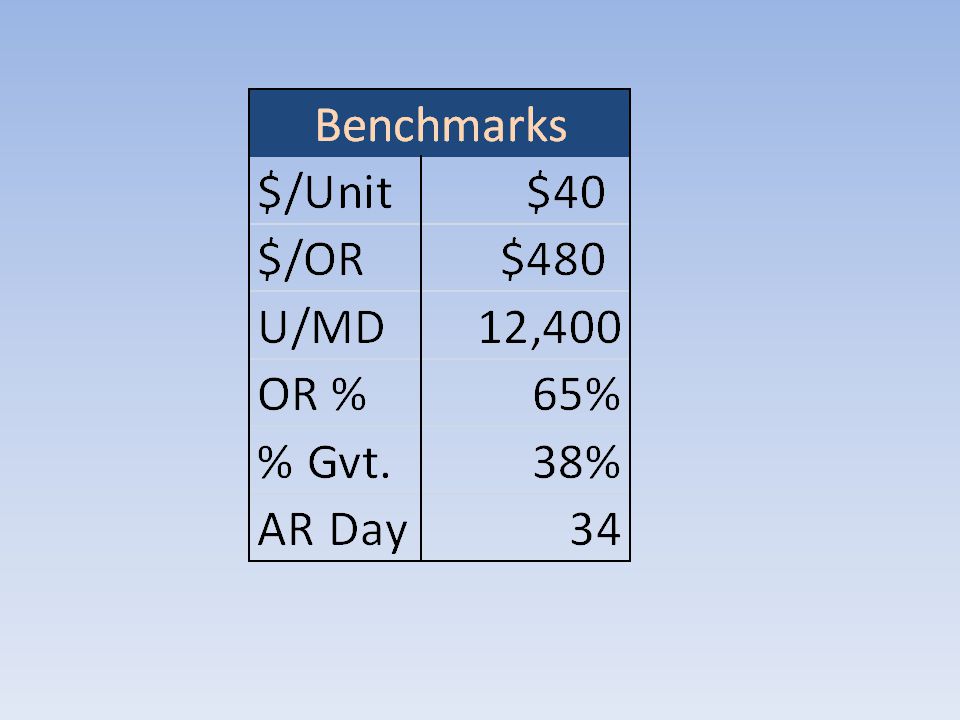
4. Benchmarks and Goals

62
Benchmarks Revenue per Unit$40 Revenue per OR$475k Units per MD12,400 Units per OR14,500 OR Utilization65% % Government Payers38% A/R Days46 A/R % over 90 Days18%

64
Internal Practice Goals Revenue per Month$1,500k Revenue per MD575k OR Utilization68% CRNA OT< 40 hrs./wk Weekend Hours< 24 Cases @ ASC 1400/week

66
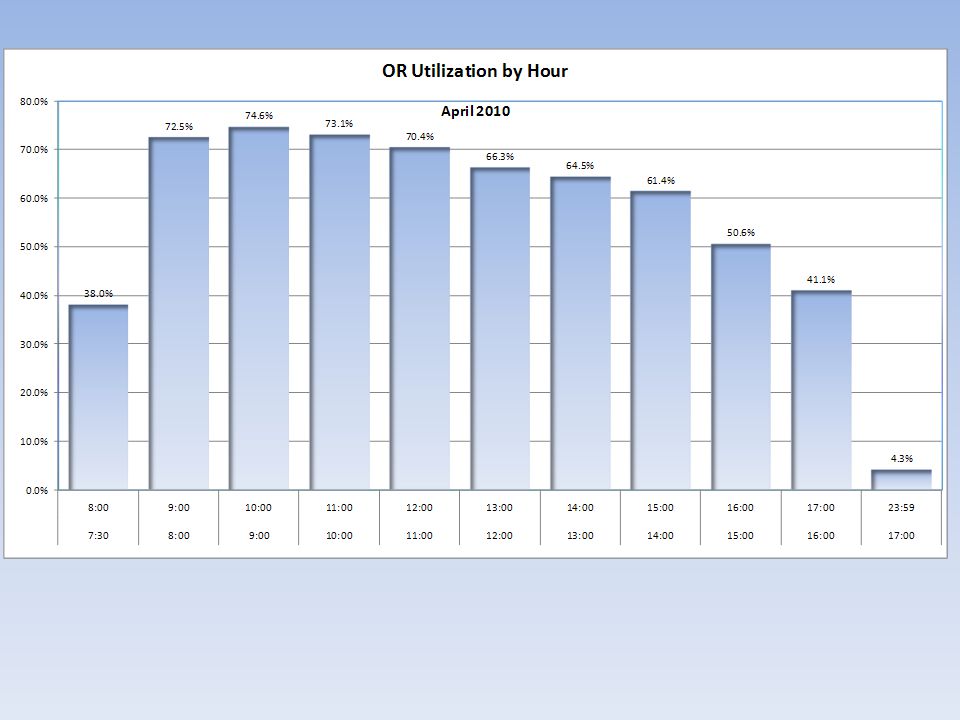
April 2010

67
67 10:56 PM Creating Dashboards Can Be Difficult Many Sources Varied Source Formats Tools not easy to use Compact Layout Complex Formatting Determining relevant data Relevant data may change Different Audiences

68
How Do We Easily Make a Powerful Dashboard?

69
6/16/2015 12:09:24 AM Construction Software Excel 2003,2007,2010 Word PowerPoint PDF Creation Software Snipping Tool (screen capture) Snagit Jing
 Snagit Jing")
70
Why Excel as Primary DIY Tool? You Probably Own Excel Low Cost Universality Excellent Data Exchange Charts Pivot Tables Ease of Use Training Available Advanced, Mature Product Runs on PC or Mac

71
Excel 2010 New Features Sparklines Cell Bars Slicers PowerPivot DAX Formulas

72
Steps to Prepare You Dashboard Determine Your Audience Review Current One Page Reports Decide Which Key Performance Indicators to Display Determine if Billing System Data Can Be Easily Copied. Decide on Dashboard Construction Tools

73
One Approach to Constructing Your Own Dashboard

74
Cut and Paste Dashboard Construction 1. Start with blank PowerPoint Slide 2. Display components to place on dashboard 3. Capture components with Snipping Tool or Copy & Paste 4. Paste onto slide 5. Resize and reposition 6. Add Logo, Background Other Beautifying Graphs 7. Print as a PDF and distribute.

76
Construction Demo Video

77
More Difficult Method 1: Prepare all elements of spreadsheet on one worksheet in Excel from multiple worksheets with tables and graphs and use Excel Camera to produce dashboard. Example follows.....

78
Excel Camera Example Video

79
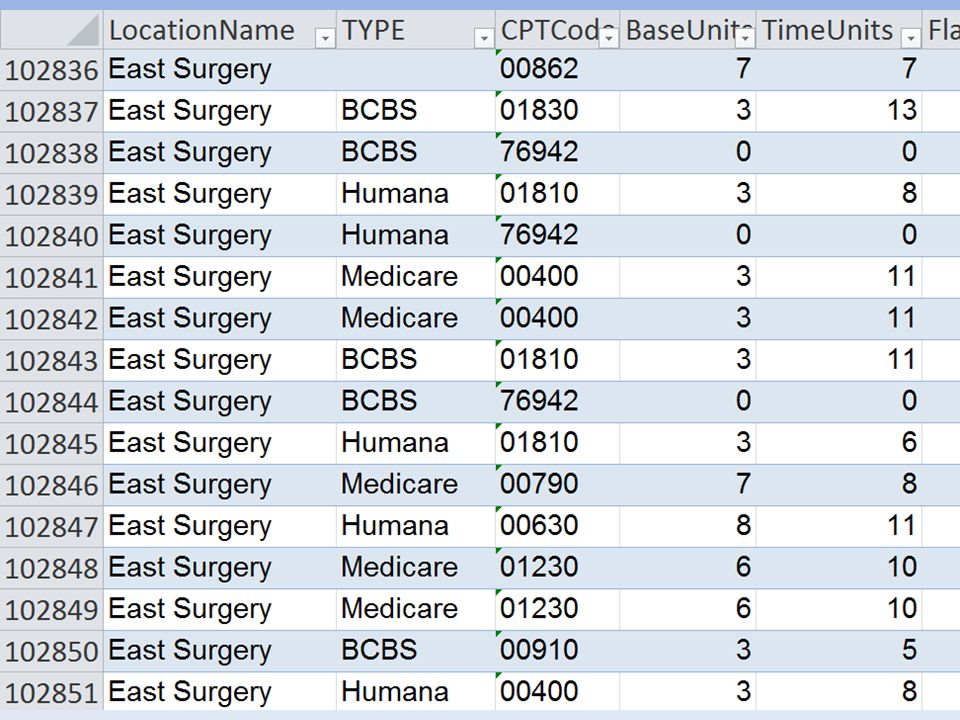
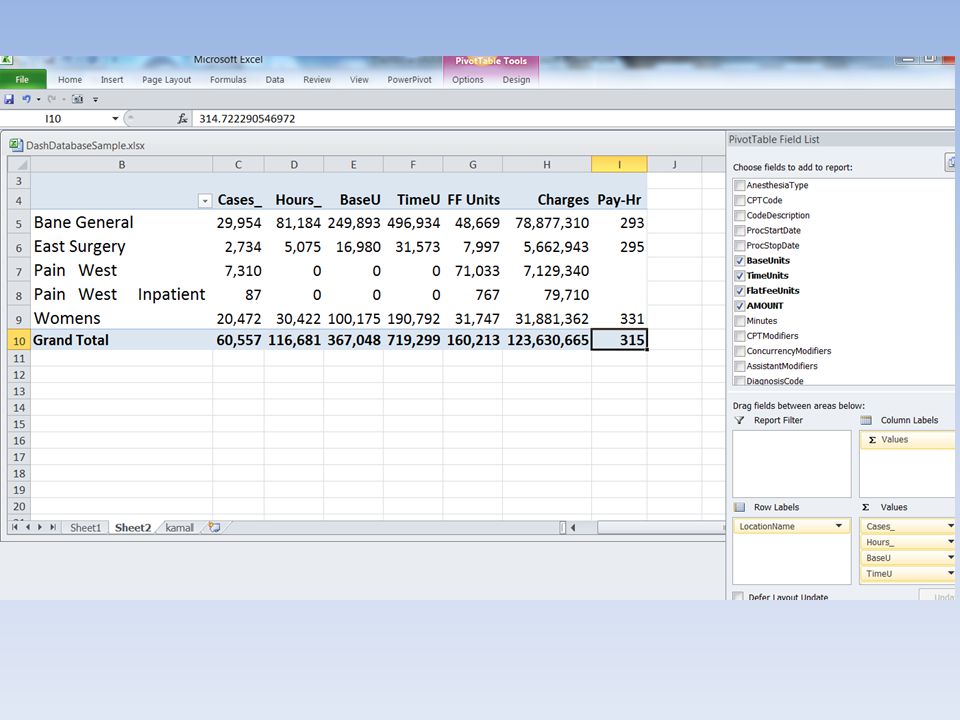
More Difficult Method 2: Dynamic tables and charts in Excel prepared on dashboard sheet from pivot tables based on externally imported data. Advantage: Dashboard automatically update when current data is imported. Example follows.....

84
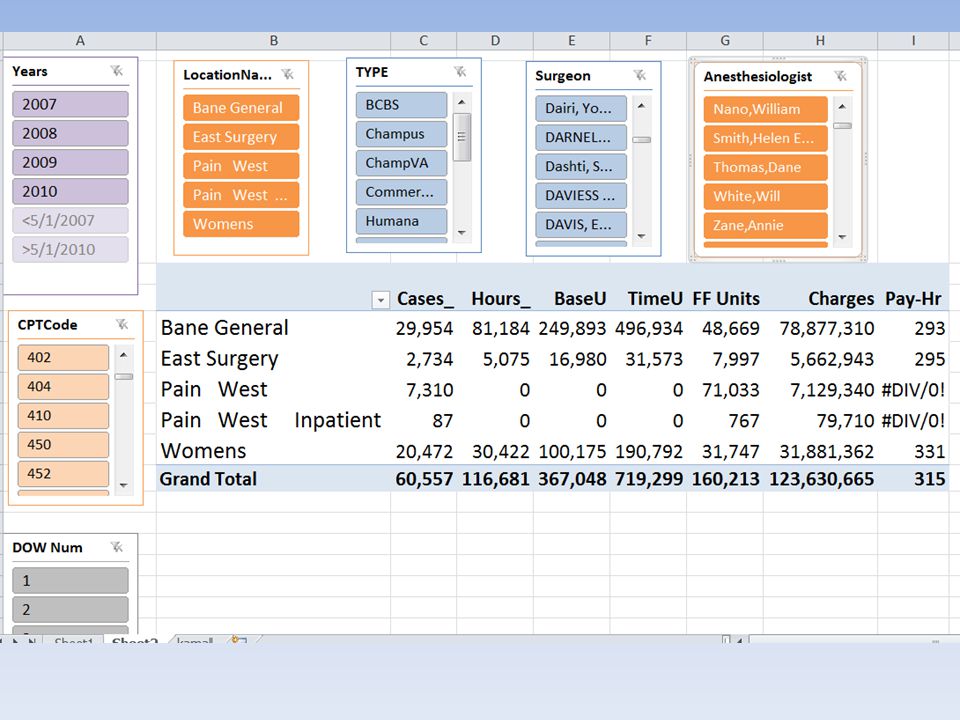
Excel 2010 Pivot Table With Slicers Video

85
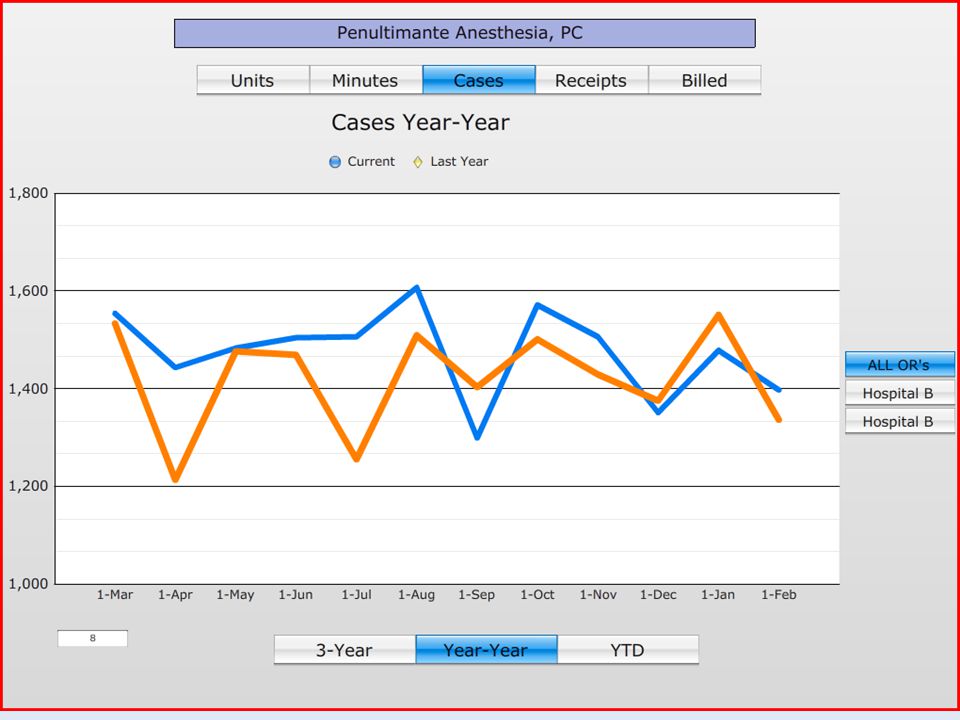
Third Party Dashboard Solutions Interface With Practice Management Systems Produce Dashboard Reports Automatically Store Report Data Independently Provide Web Access and Distribution Services Can Be Time Consuming to Set Up There will be a Cost Examples: www.DashBoardMD.com www.iDashboards.com www.anodynehealth.com

86
Additional Methods to Produce Your Own Dashboard Xcelsius/Engage Expensive & Complicated but powerful Download to Handheld Device Custom Programming IT expertise and expense, specialized software (Dundas)
")
95
Presentation & Delivery Methods Physical Paper Company Web Site PowerPoint Slide Spreadsheet (Excel) DVD Secure USB Drive (with dataset) Mobile Device, iPhone, iPad
 DVD Secure USB Drive (with dataset) Mobile Device, iPhone, iPad")
96
What Needs to Be Communicated to Physicians?

97
6/16/2015 12:09:24 AM Types of information Production Cases, Units, Minutes Gross Billing Payments, W/O, Adjustments Accounts Receivable Charges/Payments/WO General Ledger/Income &Expenses Payroll

98
6/16/2015 12:09:24 AM What Do Doctors Want to Know The future How the past will predict the future What if things go on as in the recent past What can be changed to improve finances What are areas of concern

99
What Can Anesthesiologists Do With Dashboard Information? Monitor Anesthesiologist/ACT Work Output: (Units / Minutes / Cases) Monitor Reimbursement for Work Performed (Payments/Unit or Hour) Monitor Collection Efficiency (AR Days) Monitor Hospital Efficiency (O.R. Utilization) Make decisions about staffing Determine need for hospital subsidies
 Monitor Reimbursement for Work Performed (Payments/Unit or Hour) Monitor Collection Efficiency (AR Days) Monitor Hospital Efficiency (O.R. Utilization) Make decisions about staffing Determine need for hospital subsidies.")
100
100 Key Metrics Revenue Per O.R. Revenue Per Unit Billed O.R. Utilization Rate % Hours Billed/Worked After Normal OR Shift CRNA Cost per Hour/Unit Billed MD:CRNA Ratios (Concurrency) Weeks Worked per Year Units per Hour Units Billed per MD FTE
 Weeks Worked per Year Units per Hour Units Billed per MD FTE.")
101
Internal Comparisons Facility vs. Facility MD vs. MD Payer vs. Payer Surgeon vs. Surgeon Time-Based Month, Quarter, Year, Week Trailing 12 months Period vs. Previous Period

102
External Benchmark Comparisons MGMA Physician Compensation and Production Survey MGMA Single Specialty Cost Report Survey – Anesthesia ASA Payer Survey

103
KPI Top and Bottom Top 10 and Bottom 10: Surgeons (collected per hour) Anesthesiologists (units per year) CRNA’s (hours billed/ hours paid) Payers (collected per unit) ASA Codes (units per case)
 Anesthesiologists (units per year) CRNA’s (hours billed/ hours paid) Payers (collected per unit) ASA Codes (units per case)")
104
Other Combinations Units per case, MD, CRNA, Hour Revenue per O.R., MD, Case, Hour Units, Hours and revenue per Surgeon Operating Room or Facility

105
Questions Anesthesiologists Ask: How is the business going? What will the end of the year look like? Will your dashboard provide answers?

106
Take Away Ideas Dashboards take time, talent and toil to make Resist the urge to favor flash over function. Encourage your vendors to produce dashboards Often a paper report with limited graphics is best

107
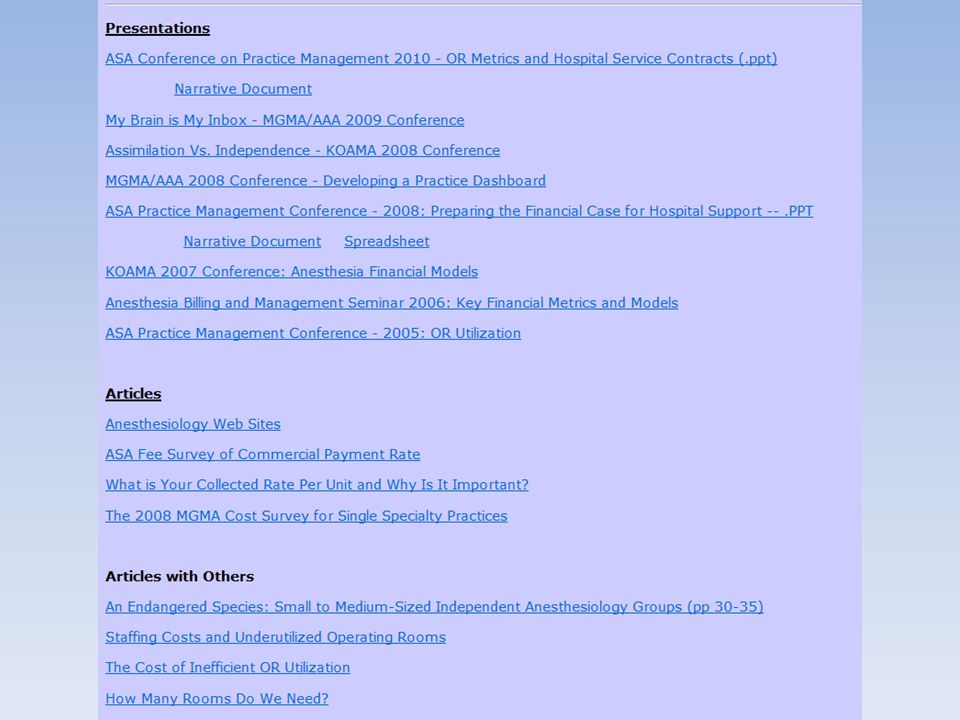
Additional Resources The Effective Use Of Electronic Dashboards To Promote & Improve Overall Practice Performance: An Exploration Into The Use of Electronic Dashboards In A Group Practice Setting. ACMPE Paper by David G. Owens, FACMPE. Available on the MGMA web site Dashboard To Monitor Clinical Productivity of Anesthesiology Groups Amr E. Abouleish, M.D., M.B.A., Jody A. Locke, M.A., et al. Click Here For Web Link

108
Dashboard Resources On the Web MGMA Excel Community www.DashboardsByExample.com Youtube: ExcelIsfun www.perceptualedge.com www.edwardtufte.com www.exceluser.com xcelsius.com www.dashboardmd.com www.idashboards.com www.anodynehealth.com www.dundas.com www.dashboardspy.com www.mrexcel.com www.corda.com Cognos / DataClarify www.TableauSoftware.com

109
This Presentation Will Be Available To Download at: www.joeladen.com

111
Have We Met the Objectives? Develop a strategy to produce an effective practice dashboard Identify key information that should be communicated Gain insight as to the spreadsheets and graphic software available Please Complete Your Evaluation

112
For Questions, Comments, Help or to Share Your Ideas : Joe Laden, Business Manager Anesthesia Associates of Louisville, PSC 332 W Broadway Louisville, Kentucky 40202 Office: (502) 583-0909 Cell (502) 403-7489 www.joeladen.com joeladen@aalouisville.com
 Cell (502)")
Similar presentations


 Acknowledgements – Ali Parvin (CCS)>")