Download presentation
Presentation is loading. Please wait.

1
Travel Industry Trends & Best Practices
Presentation to Travel Industry Trends & Best Practices November 6, 2014

3
Introductions Tom McIntyre - President – Passageways division Lisa Hoehn - Vice President national Corporate Sales Kristina dunn - Director of corporate development

4
Who We Are Passageways Travel – Founded in 1980 by Tom McIntyre
ALTOUR Founded in 1991 by Alexandre Chemla Combined forces in 2012 Over 1,200 Travel Professionals Over $1.6 Billion Total Sales 2013 2013 – 13th Travel Weekly Power List of agencies nationwide 52 Offices in the US / UK / France– Global HDQ – New York City Sister companies: ALTOUR AIR and ALTOUR Tech

5
Our Diverse Menu Specializing in Corporate Travel Management

6
ALTOUR & American Express
ALTOUR is the largest member of the American Express US Representative Travel Network. Preferred hotel negotiated rates and car rental discount programs Global travel consolidation and industry benchmarking data Ability to book all American Express Card associated programs, Platinum, Centurion and Gold, to take advantage of promotions such as International 2 for 1 Air Program “Pay with Points” - Members will be able to use points when booking through ALTOUR anytime, any place. Air – Cruise – Tour, etc. (No seat restrictions or blackout dates) Card Members can earn points on American Express Vacation products Through our affiliation with American Express, we are able to offer the “best of both worlds”: the tools and programs of a “Mega Agency” and the reputable, excellent, individual service and customized program management of a privately, independently owned agency.
 Card Members can earn points on American Express Vacation products. Through our affiliation with American Express, we are able to offer the best of both worlds : the tools and programs of a Mega Agency and the reputable, excellent, individual service and customized program management of a privately, independently owned agency.")
8
2014 Top Business Travel Trends

9
Beyond Rates: Additional 2014 perspective

21
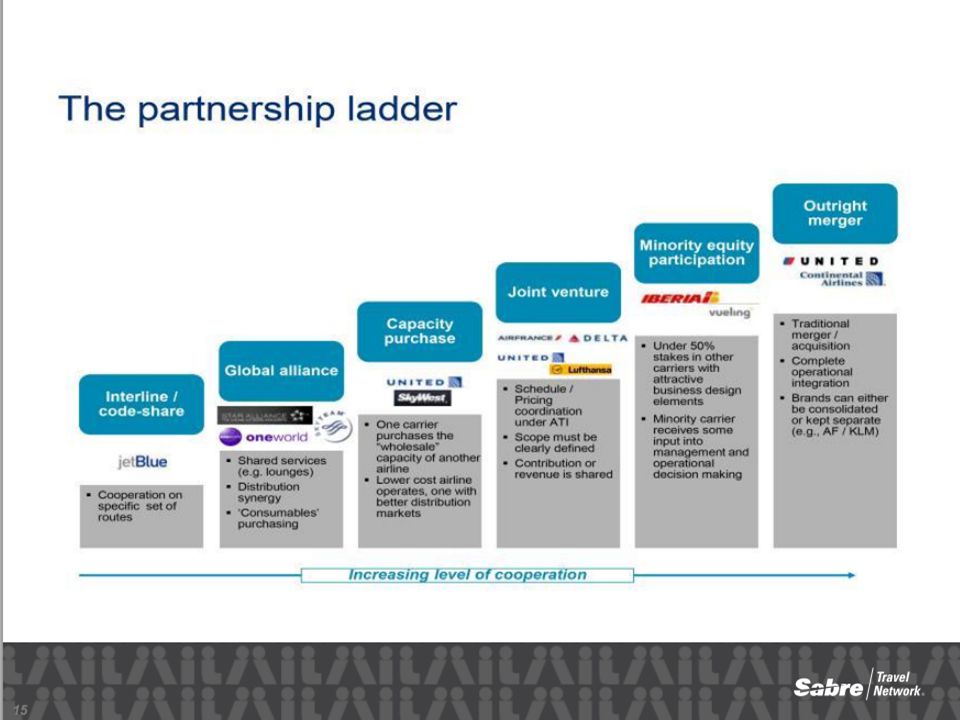
American Airlines Merged American
US Airways 2013

22
Airline Industry: Cost Drivers
Key Points Top 3 Drivers Account For 64.3% of Total Airline Costs. The top three cost drivers for ninety five percent of the world’s airlines, are: fuel, personnel and the cost of aircraft, which together account for an average of 64.3% of an airline’s total cost structure. Dependence on oil production, labor agreements and a duopoly in aircraft manufacturing prevent airlines from having any substantive impact on these cost drivers. With revenues fixed by competitive ticket pricing and the majority of their costs out of their control, airlines are challenged to maintain earnings and gain competitive advantage by controlling less than 35% of their cost structure. Cost Drivers Source:

23
Airline Industry: Baggage Fees
SAMPLE Airline Industry: Baggage Fees Baggage Fees by Airline 2013 Airlines ranked by 2013 baggage fee revenue, dollars in thousands (000) Updated: May 5, 2014 Rank Airline 1Q 2Q 3Q 4Q 2013 1 Delta 191,986 217,072 226,243 197,882 833,183 2 United 143,252 158,012 170,186 153,371 624,821 3 US Airways 130,470 139,306 130,564 127,251 527,591 4 American 123,115 132,698 127,070 122,814 505,697 5 Spirit 47,741 53,499 57,488 53,233 211,961 6 Southwest 42,727 42,500 32,411 25,902 143,540 7 Allegiant 33,594 33,038 28,957 16,864 112,453 8 Alaska 20,671 24,249 28,580 22,533 96,033 9 JetBlue 17,893 17,863 19,622 18,938 74,316 10 Hawaiian 16,563 17,753 19,115 16,603 70,034 11 Frontier 14,212 14,186 18,659 22,169 69,226 12 Virgin America 12,205 15,557 16,149 14,614 58,525 13 Sun Country 4,926 3,592 3,825 3,238 15,581 14 Mesa 1,014 966 1,056 888 3,924 15 Island Air Hawaii 635 851 874 840 3,200 16 American Eagle** -13 All 801,004 871,142 880,786 797,140 3,350,072 Source: Bureau of Transportation Statistics, Schedule P-1.2 * American Eagle's third-quarter 2013 report represents a baggage-handling expense and is subject to revision. Source:
 Updated: May 5, Rank. Airline. 1Q. 2Q. 3Q. 4Q Delta. 191, , , , , United. 143, , , , , US Airways. 130, , , , , American. 123, , , , , Spirit. 47, , , , , Southwest. 42, , , , , Allegiant. 33, , , , , Alaska. 20, , , , , JetBlue. 17, , , , , Hawaiian. 16, , , , , Frontier. 14, , , , , Virgin America. 12, , , , , Sun Country. 4,926. 3,592. 3,825. 3, , Mesa. 1, , , Island Air Hawaii , American Eagle** -13. All. 801, , , ,140. 3,350,072. Source: Bureau of Transportation Statistics, Schedule P-1.2. * American Eagle s third-quarter 2013 report represents a baggage-handling expense and is subject to revision. Source:")
24
Airline Industry: Cancellation/Change Fees
SAMPLE Airline Industry: Cancellation/Change Fees Reservation Cancellation/Change Fees by Airline 2013 Airlines ranked by 2013 reservation cancellation/change fee revenue, dollars in thousands (000) Updated: May 5, 2014 Rank Airline 1Q 2Q 3Q 4Q 2013 1 Delta 198,596 212,432 225,898 203,144 840,070 2 United 176,989 197,293 198,715 183,516 756,513 3 American 132,050 134,524 134,381 120,077 521,032 4 US Airways 83,584 84,352 81,602 77,791 327,329 5 JetBlue 36,727 34,733 36,306 38,668 146,434 6 Alaska 21,833 22,221 23,922 22,002 89,978 7 Spirit 7,962 7,816 8,165 8,602 32,545 8 Virgin America 7,723 8,280 8,302 7,918 32,223 9 Southwest 9,254 7,092 6,646 2,364 25,356 10 Hawaiian 4,672 4,293 4,596 4,370 17,931 11 Frontier 3,023 3,115 3,414 3,642 13,194 12 Allegiant 2,297 2,474 2,281 1,996 9,048 13 Sun Country 466 434 536 500 1,936 Island Air Hawaii 128 123 107 122 480 All 685,304 719,182 734,871 674,712 2,814,069 Source: Bureau of Transportation Statistics, Schedule P-1.2 Source:
 Updated: May 5, Rank. Airline. 1Q. 2Q. 3Q. 4Q Delta. 198, , , , , United. 176, , , , , American. 132, , , , , US Airways. 83, , , , , JetBlue. 36, , , , , Alaska. 21, , , , , Spirit. 7,962. 7,816. 8,165. 8, , Virgin America. 7,723. 8,280. 8,302. 7, , Southwest. 9,254. 7,092. 6,646. 2, , Hawaiian. 4,672. 4,293. 4,596. 4, , Frontier. 3,023. 3,115. 3,414. 3, , Allegiant. 2,297. 2,474. 2,281. 1,996. 9, Sun Country ,936. Island Air Hawaii All. 685, , , ,712. 2,814,069. Source: Bureau of Transportation Statistics, Schedule P-1.2. Source:")
25
Airline Industry: Price of Air Travel versus Other Goods & Services
Price of Air Travel Versus Other Goods and Services Product (Unit) 1978* 2000 2013 2013 vs. 1978 2013 vs. 2000 Walt Disney World (One Day Pass, Adult)0 $6.50 $46 $95 1362% 107% College Education: Public, Undergraduate (Year)1 $688 $3,508 $8,893 1193% 154% College Education: Private, Undergraduate (Year)1 $2,958 $16,072 $30,094 917% 87% National Football League Game (Ticket)9 $9.67 $48.97 $81.54 743% 67% Prescription Drugs (BLS Index)2 61.6 285.4 442.58 618% 55% Major League Baseball Game (Ticket)10 $3.98 $16.22 $27.48 590% 69% Gasoline (Gallon, Unleaded)4 $0.67 $1.51 $3.53 426% 134% Vehicle (New)12 $6,470 $24,923 $31,762 391% 27% Single-Family Home (New)5 $55,700 $169,000 $265,900 377% 57% Consumer Price Index (CPI-U)2 65.2 172.2 257% 35% Movie Ticket6 $2.34 $5.39 $8.13 247% 51% Food & Beverage (BLS Index) 72.183 168.35 237.0 228% 41% Postage Stamp (First-Class)7 $0.15 $0.33 $0.46 207% 39% Whole Milk (Index)2 81 156.9 214.68 165% 37% Air Travel (R/T Domestic Fare + Ancillary)8 $187 $316.96 $385.32 106% 22% Air Travel (R/T Domestic Fare Only)8 $186 $314.46 $362.85 95% 15% Apparel: Clothing/Footwear/Jewelry (BLS Index)2 81.3 129.6 127.41 57% -2% Television (BLS Index)2 101.8 49.9 4.58 -96% -91% Cable TV (Monthly)11 N/A $31.22 $65.07 AllEars.net – based on June of each year 1. The College Board – based on beginning of academic year 2. U.S. Bureau of Labor Statistics – includes hedonic “quality-change” adjustments 3. National Automobile Dealers Association – average retail selling price 4. U.S. Department of Energy – Monthly Energy Review, Table 9.4 5. U.S. Census Bureau – median sales price of new homes sold in the United States, including the land 6. National Association of Theatre Owners 7. U.S. Postal Service – Publication 100 8. A4A via U.S. Bureau of Transportation Statistics – shown on a round-trip basis; first column reflects 1979 (1978 data not available) 9. Team Marketing Report Fan Cost Index, average nonpremium ticket 10. Team Marketing Report Fan Cost Index, average nonpremium ticket 11. Federal Communications Commission – 2013 estimated based on growth rate from 12. NADA DATA 2014 * Domestic fare data commences in 1979; international fare data commences in 1990 Sources: Airlines for America:
 1978* vs vs Walt Disney World (One Day Pass, Adult)0. $6.50. $46. $ % 107% College Education: Public, Undergraduate (Year)1. $688. $3,508. $8, % 154% College Education: Private, Undergraduate (Year)1. $2,958. $16,072. $30, % 87% National Football League Game (Ticket)9. $9.67. $ $ % 67% Prescription Drugs (BLS Index) % 55% Major League Baseball Game (Ticket)10. $3.98. $ $ % 69% Gasoline (Gallon, Unleaded)4. $0.67. $1.51. $ % 134% Vehicle (New)12. $6,470. $24,923. $31,762. 391% 27% Single-Family Home (New)5. $55,700. $169,000. $265, % 57% Consumer Price Index (CPI-U) % 35% Movie Ticket6. $2.34. $5.39. $ % 51% Food & Beverage (BLS Index) 228% 41% Postage Stamp (First-Class)7. $0.15. $0.33. $ % 39% Whole Milk (Index) % 37% Air Travel (R/T Domestic Fare + Ancillary)8. $187. $ $385.32 106% 22% Air Travel (R/T Domestic Fare Only)8. $186. $ $ % 15% Apparel: Clothing/Footwear/Jewelry (BLS Index) % -2% Television (BLS Index) % -91% Cable TV (Monthly)11. N/A. $ $ AllEars.net – based on June of each year. 1. The College Board – based on beginning of academic year. 2. U.S. Bureau of Labor Statistics – includes hedonic quality-change adjustments. 3. National Automobile Dealers Association – average retail selling price. 4. U.S. Department of Energy – Monthly Energy Review, Table U.S. Census Bureau – median sales price of new homes sold in the United States, including the land. 6. National Association of Theatre Owners. 7. U.S. Postal Service – Publication A4A via U.S. Bureau of Transportation Statistics – shown on a round-trip basis; first column reflects 1979 (1978 data not available) 9. Team Marketing Report Fan Cost Index, average nonpremium ticket. 10. Team Marketing Report Fan Cost Index, average nonpremium ticket 11. Federal Communications Commission – 2013 estimated based on growth rate from NADA DATA * Domestic fare data commences in 1979; international fare data commences in Sources: Airlines for America:")
28
Car Rental Industry: Overview
SAMPLE Car Rental Industry: Overview Key Points Global industry spend is $30.5 Billion of which 34% is business travel The industry is segmented by business travelers, leisure travelers, car leasing and car sharing Leisure market has grown larger than corporate business market Industry revenue is forecasted to increase 2% for the next 5 years High fuel cost is impacting industry as customers, especially leisure travelers, are finding other alternatives (public transportation) Hertz and Avis expanding off-airport locations to compete with Enterprise Car rental industry adjusted to global recession better than other travel industry categories. They can “right” size fleet to meet demand by disposing vehicles quickly and reduce costs. Source: IBISWORLD, Auto Rental News, Business Travel News
 Hertz and Avis expanding off-airport locations to compete with Enterprise. Car rental industry adjusted to global recession better than other travel industry categories. They can right size fleet to meet demand by disposing vehicles quickly and reduce costs. Source: IBISWORLD, Auto Rental News, Business Travel News.")
29
Rental Car Industry: PPI
– Passenger Car Rental The PPI for passenger car rentals has gone up 22% from 2005 to 2008 indicating increased fleet and fuel cost. In 2008 and 2009, prices have slightly increased and since 2011 prices are still dropping significantly. NAICS All indexes are subject to revision four months after original publication. Source:

30
Car Rental Industry: Market Share
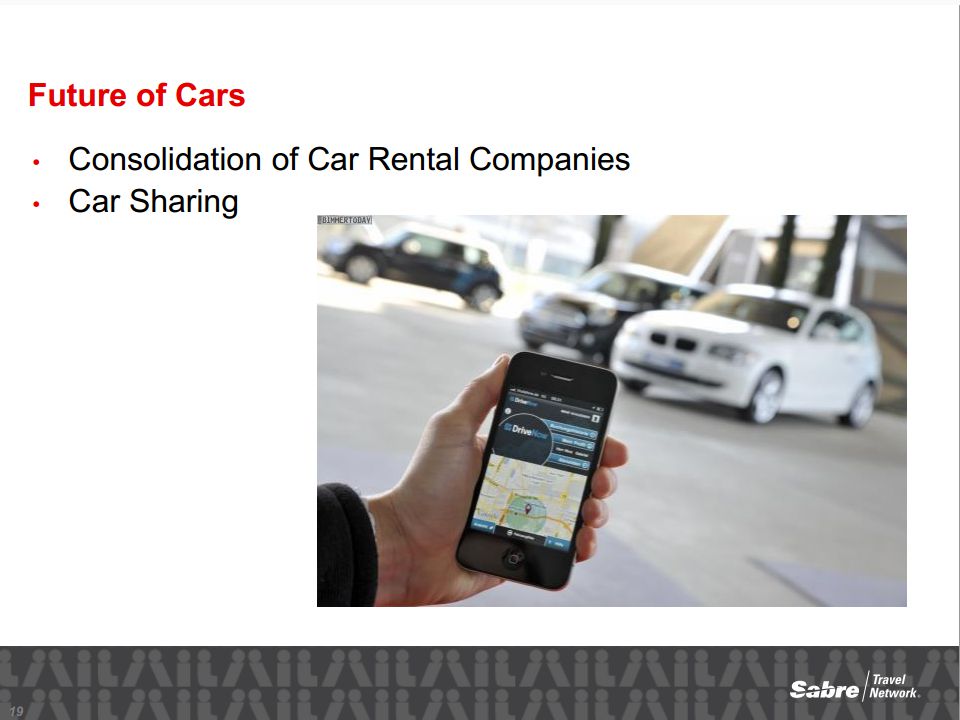
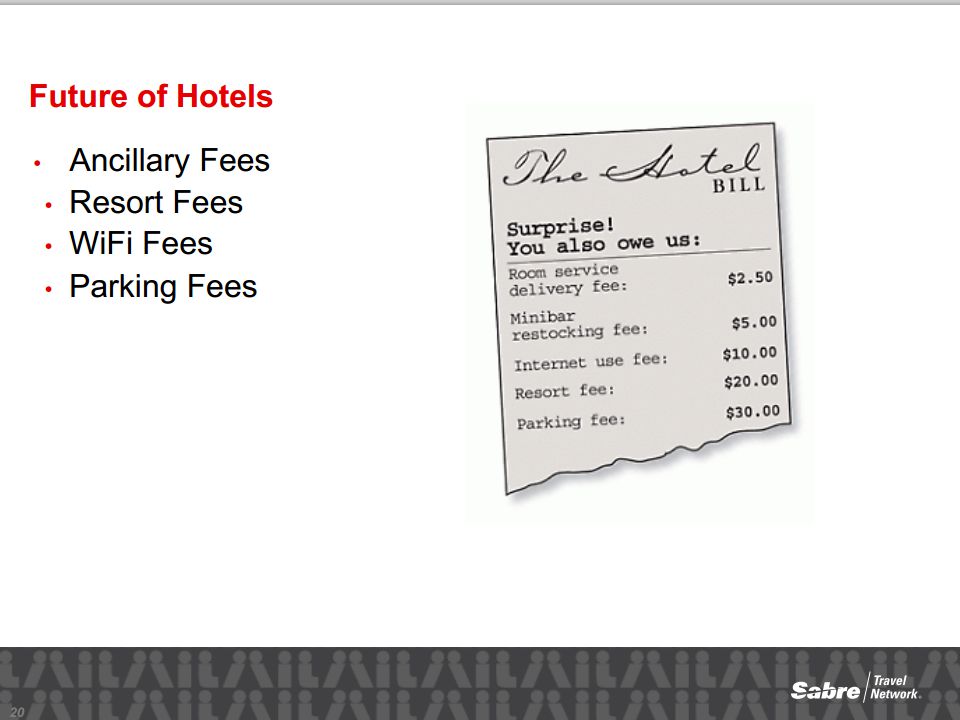
The U.S. car rental market is highly consolidated among a small number of major players and is getting smaller. Top 4 Car Rental Companies By Revenue Key Points After Hertz’s purchase of Dollar Thrifty, the top three rental car companies will make up 95% of the total on-airport US car rental industry revenues Suppliers offer different brands that focus on specialized markets: Corporate Traveler – On-airport convenience – Hertz, Avis and National Leisure Market – On/Off-airport Budget, Dollar Thrifty, and Enterprise Additional Non-US regional players include: Europcar (Europe and Asia Pacific) Sixt (Germany and EMEA) In high risk countries such as India, China, Thailand, Latin America, etc. the business model is to rent a car with driver. Cost is less than a chauffer / limo as a typical rental vehicle is used Car rental companies have implemented a variety of new ancillary fees to help preserve some of the lost revenue in recent times, such as tacking on fees to extend a reservation, eliminating 60 minute grace period, or increasing the cost of a two-day rental “Virtual rental technology” – enables customers to reserve, rent, access and return cars just about anywhere. ZipCar, WeCar, Connect. It is forecasted that that base rates will increase on average between 0% to 2% for business travel rental cars in the U.S. next year. This is big news since US suppliers haven’t been able to increase rates, even slightly. This is due to increasing fleet costs for car rental providers, as their used vehicles sell for less than in recent years as consumers shift toward buying more new and fewer used vehicles. Even so, the highly consolidated market will retain strong competition among suppliers in 2014. Source: Business Travel News Corporate Travel Index 2012
 Sixt (Germany and EMEA) In high risk countries such as India, China, Thailand, Latin America, etc. the business model is to rent a car with driver. Cost is less than a chauffer / limo as a typical rental vehicle is used. Car rental companies have implemented a variety of new ancillary fees to help preserve some of the lost revenue in recent times, such as tacking on fees to extend a reservation, eliminating 60 minute grace period, or increasing the cost of a two-day rental. Virtual rental technology – enables customers to reserve, rent, access and return cars just about anywhere. ZipCar, WeCar, Connect. It is forecasted that that base rates will increase on average between 0% to 2% for business travel rental cars in the U.S. next year. This is big news since US suppliers haven’t been able to increase rates, even slightly. This is due to increasing fleet costs for car rental providers, as their used vehicles sell for less than in recent years as consumers shift toward buying more new and fewer used vehicles. Even so, the highly consolidated market will retain strong competition among suppliers in Source: Business Travel News Corporate Travel Index")
33
Hotel Industry: Chains / Brands
The majority of the global branded properties and revenue are mostly located in North America, Key Points The majority of the global branded properties and revenue are mostly located in North American Major revenue for global chains (such as Marriott, Hilton, etc.) is from franchise and management fees. Business travelers, including executives, are shifting from luxury hotels to more moderate mid-priced hotels Hotel taxes, usually a combination of sales and occupancy taxes along with the occasional flat fee, range from 10% to more than 18%. Hotel costs represent the single largest component of non-air expenses, about 43% of the travel dollar Brands by Service Level Source: PWC Hospitality Directions, Smith Travel Research, CWT Hotel Solutions, Business Travel News, IBISWorld SAMPLE
 is from franchise and management fees. Business travelers, including executives, are shifting from luxury hotels to more moderate mid-priced hotels. Hotel taxes, usually a combination of sales and occupancy taxes along with the occasional flat fee, range from 10% to more than 18%. Hotel costs represent the single largest component of non-air expenses, about 43% of the travel dollar. Brands by Service Level. Source: PWC Hospitality Directions, Smith Travel Research, CWT Hotel Solutions, Business Travel News, IBISWorld. SAMPLE.")
34
Hotels & Motels, Room Rentals
Hotel Industry: PPI – Hotels & Motels, Room Rentals The PPI for hotel rooms have fluctuated during 2012 due to pressures from both buyers and sellers. The 2013 average is 134.7, indicating rates are continuing to rise. NAICS All indexes are subject to revision four months after original publication. Source:

35
Case for Managed Travel Programs

36
Travel Industry: Overview
The Top 50 travel management companies represent over $160 billion in sale revenue Key Points 2013 Top 5 (over $1B in revenue) Travel Management Co’s By Revenues The top 50 travel management companies represent over $160 billion in sales revenue in 2013. Five companies registered more than $20 billion in sales, including a snowballing Priceline, which showed significant increases each year. There were 16 listees with sales of more than $1 billion, up from 14 last year. Expedia, Priceline, AAA Travel, and Travelong receive 90% or more sales revenue from the leisure market. Many of the listees registered surges in year-over-year sales, a couple by acquisitions but most by generating additional revenue from existing clients or winning new clients. Expedia regained top slot over Priceline, Carlson & American Express Source: Travel Weekly Power List 2012,
 Travel Management Co’s By Revenues. The top 50 travel management companies represent over $160 billion in sales revenue in Five companies registered more than $20 billion in sales, including a snowballing Priceline, which showed significant increases each year. There were 16 listees with sales of more than $1 billion, up from 14 last year. Expedia, Priceline, AAA Travel, and Travelong receive 90% or more sales revenue from the leisure market. Many of the listees registered surges in year-over-year sales, a couple by acquisitions but most by generating additional revenue from existing clients or winning new clients. Expedia regained top slot over Priceline, Carlson & American Express Source: Travel Weekly Power List 2012,")
37
Overview of Company 2014 Power List

38
Industry Profile - Objective & Key Questions
Develop an understanding of the current business travel environment as well as the forces shaping future travel services. The results of this profile will shape the your Travel Sourcing Strategy. Key Questions What is the average spend for your peers? Who are the leaders? realistic objectives based on best practices? What are the key cost drivers? Are peers in a state of growth or decline? What are the current travel pricing trends?

39
10 Best Practices for a Managed Travel Program
Select an appropriate travel management company Develop a travel policy Provide training to your travelers Identify vendors who may offer savings Collect travel data and reports Determine level of “Travel Mandate” Understand your Duty of Care requirements Determine a payment program Plan travel oversight Reevaluate your plan at least every two years

40
Strategy Considerations
Examine current travel policies. Enforcement of on-line booking tool, advance booking, preferred hotels and other travel guidelines will result in significant savings. Evaluate your air spend and determine if there are opportunities to negotiate for airline savings – including airline programs designed for small business. Re-examine preferred hotel program opportunities and consolidate markets and room nights to leverage buying power where appropriate Leverage hotel spend for meetings/events in negotiating hotel rates for transient travel Preferred car rental utilization is “best in class”, therefore consider a competitive bid to leverage utilization Consider utilizing teleconferencing as an alternative to reduce overall travel usage

41
High Level Travel Project Plan
Travel Workplan Review April May June July August September Determine process for program implementation Profile Objectives Internally & Externally Develop Procurement Strategy Screen Suppliers & Selection Factors Select TMC or Issue RFP Negotiate & Develop Sourcing Recommendation Implement Agreement Tony

42
Concur Travel & Expense:
A Best Practice Travel Management and Expense Tool

43
Key benefits of Concur tool
Concur Online Booking Fully Customized Preferred Vendors Corporate Policies Expense Report Management Contract Rates Quality Assurance Web Connect Fares Training & support Key benefits of Concur tool Multiple travelers on one reservation Unused ticket tracking Southwest reservations Hold feature Change feature Taxi, ground transportation, and long term parking GoGo In-flight internet passes for discounted rate Electronic receipts for cars and hotels Mobile applications Additional discounts for cars and hotels Many policy and approval capabilities

44
Thank you! Closing – q&A

Similar presentations


 Nick Hurrell CIPS, Manchester and North West Construction, 16 November.>")


 Total 75+ Countries Network - $4.67b EMEA - $2.51b APAC - $1.25b Americas - $914m Offices.>")


