Download presentation
Presentation is loading. Please wait.

1
Managing Non-Interest Income & Non-Interest Expense

2
Issues in Interest Income & Interest Expense
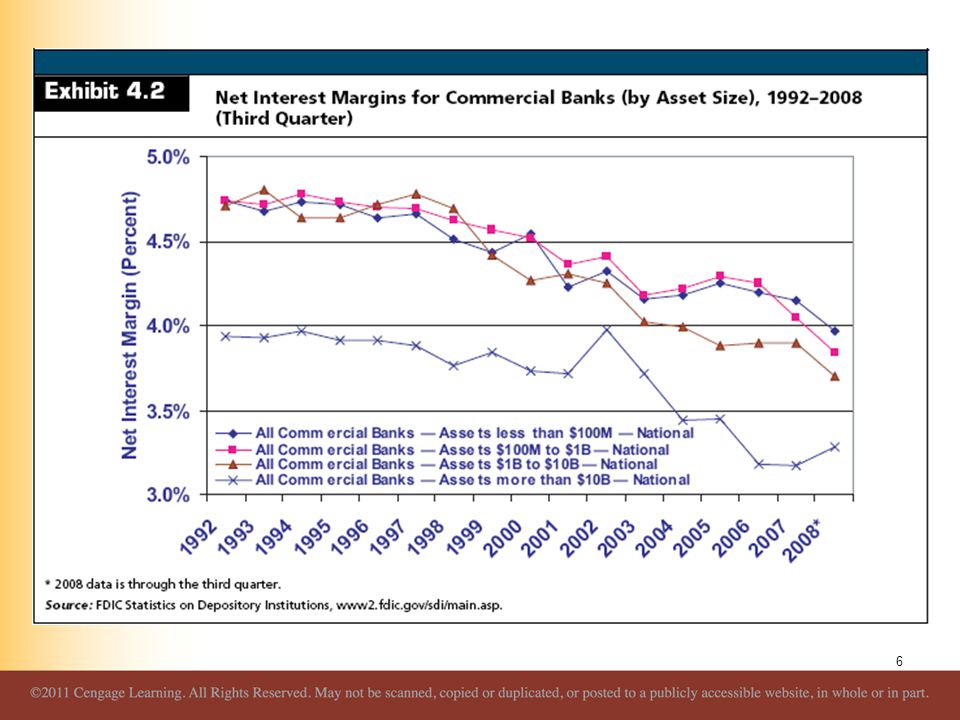
Deregulation in the 1990s lead to an increase in competition and a decrease in NIM. NIM is inversely related to bank size.

3
Issues in Interest Income and Interest Expense
Core deposit growth has slowed Disintermediation Relative loan yields have fallen due Increased competition for loans Refinance “option” Result is lower NIM Banks must increase non-interest income (relative to non-interest expense) to grow profits
 to grow profits.")
5
Non-Interest Income Sources of Non-Interest Income
Fiduciary Activities Deposit Service Charges Trading Revenue Investment Banking/Brokerage Activities Insurance Commissions Net Servicing Fees Net Gains/Losses on Loan Sales Other Net Gains/Losses and Other Non-Interest Income

7
Non-Interest Income All fees are NOT created equal
Some fees are stable and predictable over time, while others are highly volatile because they are cyclical Non-Interest Income has increased as a proportion of net operating revenue Largest contributors are deposit service charges and other non-interest income Larger banks rely more on non-interest income than their smaller counterparts

9
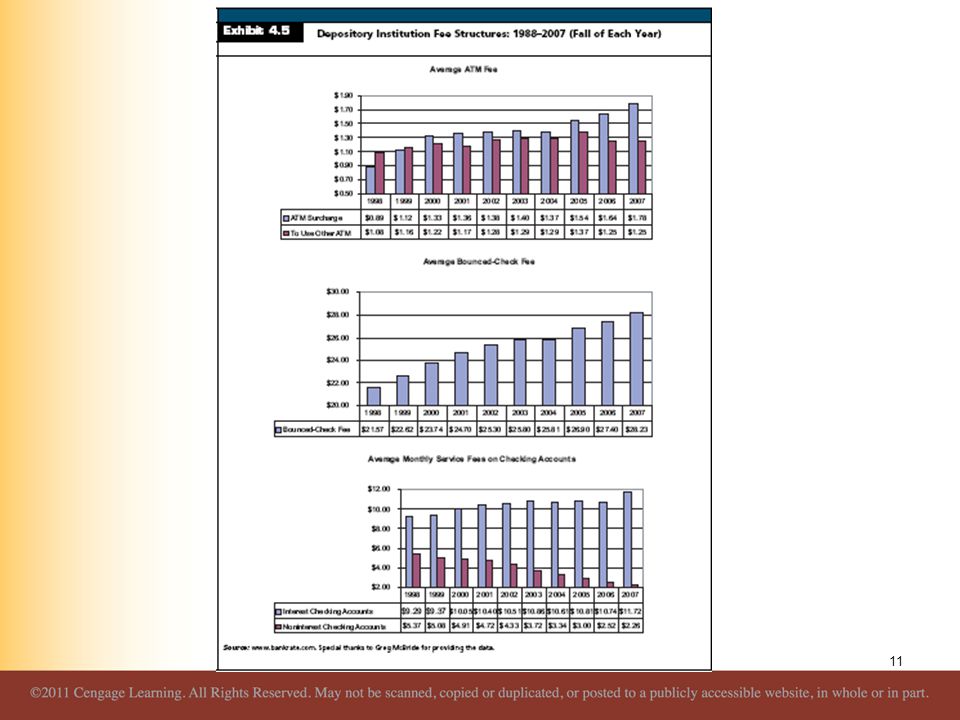
Non-Interest Income Deposit Service Fees Stable source of revenue
Relatively price inelastic Large banks tend to charge more for these services than small banks NSF and Overdraft fees are relatively inelastic

12
Non-Interest Expense Personnel Expense Occupancy Expense
Goodwill Impairment Other Intangible Amortization Other Operating Expense

13
Non-Interest Expense Key Ratios Burden (Net Overhead Expense)
Burden = Non-Interest Expense – Non-Interest Income Lower is better Net Non-Interest Margin Net Non-Interest Margin = Burden/Average Total Assets

14
Non-Interest Expense Key Ratios Efficiency Ratio
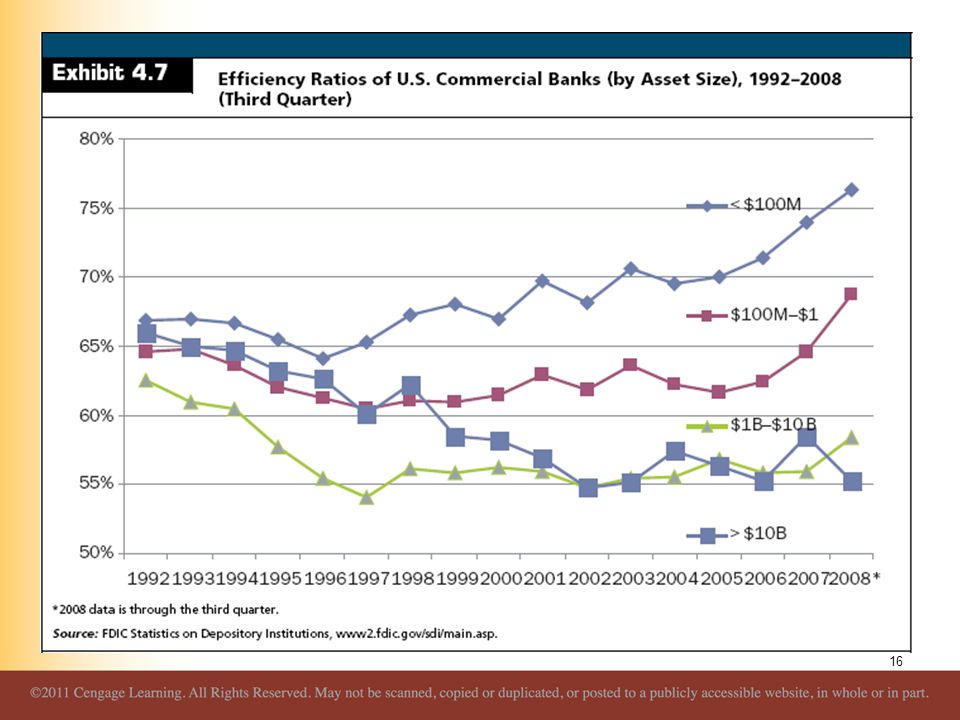
Larger banks tend to have lower (better) efficiency ratios because they generate more non-interest income Low efficiency ratios do not always lead to higher ROEs
 efficiency ratios because they generate more non-interest income. Low efficiency ratios do not always lead to higher ROEs.")
15
Non-Interest Expense Key Ratios Efficiency Ratio

17
Non-Interest Expense Key Ratios Operating Risk Ratio
Lower is better because proportionally more income comes from fees

18
Non-Interest Expense Key Ratios Operating Risk Ratio

19
Non-Interest Expense Key Ratios Productivity Ratios
Assets per Employee Average Personnel Expense Can be biased on the high side due to senior management compensation

20
Non-Interest Expense Key Ratios Productivity Ratios
Dollar Amount of Loans Per Employee Net Income Per Employee

21
Non-Interest Expense Key Ratios Productivity Ratios

22
Which Lines of Business and Customers are Profitable?
Line-of-Business Profitability Analysis Risk-Adjusted Return on Capital Return on Risk-Adjusted Capital

23
Which Lines of Business and Customers are Profitable?
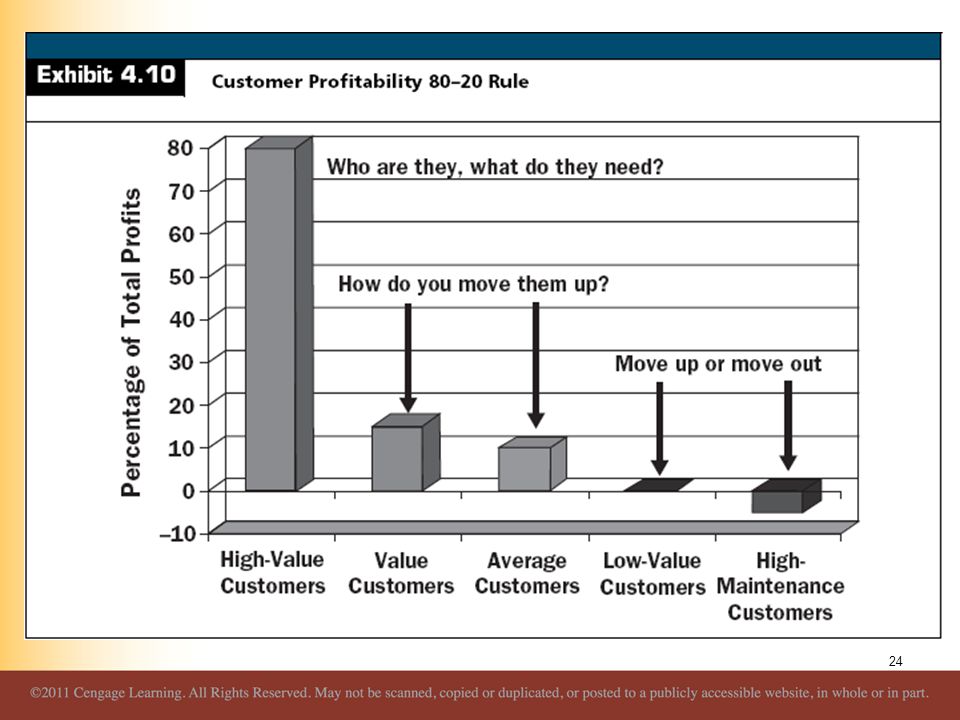
Customer Profitability Analysis Analyses of customer profitability profiles suggest that banks make most of their profit from a relatively small fraction of customers View is that 20% of a bank’s customers account for 80% of profits

25
Which Lines of Business and Customers are Profitable?
Customer Profitability Analysis Expense Components Non-Credit Services Check-processing expenses are the major non-credit cost item for commercial customers Credit Services Cost of Funds Loan Administration Expense

26
Which Lines of Business and Customers are Profitable?
Customer Profitability Analysis Expense Components Transaction Risk Risk of fraud, theft, error, and delays in processing, clearing, and settling payments Default Risk Single largest risk Business Risk Expense Losses and allocations for potential losses

27
Which Lines of Business and Customers are Profitable?
Customer Profitability Analysis Revenue Components Investment Income from Deposit Balances Earnings Credit Non-Interest Income Fee Income Loan Interest

28
Which Lines of Business and Customers are Profitable?
Aggregate Profitability Results From Customer Profitability Analysis Profitable customers maintain multiple relationships with the bank Unprofitable customers tend to “shop” for the lowest price and do not use multiple products

29
Which Lines of Business and Customers are Profitable?
What Is The Appropriate Business Mix? Some fee income comes from relatively stable services and lines of business, while other fees are highly volatile. One problem is that some managers view these volatile fees as permanent sources of income. Community banks do not have the same opportunities to enter investment banking and specialty intermediation.

30
Which Lines of Business and Customers are Profitable?
What Is The Appropriate Business Mix?

32
Which Lines of Business and Customers are Profitable?
Cost Management Strategies Expense Reduction Outsourcing Operating Efficiencies Reduce costs but maintaining the existing level of products and services Increase the level of output but maintaining the level of current expenses Improve workflow

33
Which Lines of Business and Customers are Profitable?
Cost Management Strategies Operating Efficiencies Economies of Scale Economies of Scope

34
Which Lines of Business and Customers are Profitable?
Revenue Enhancement Contribution Growth Allocates resources to best improve overall long-term profitability Increases in expenses are acceptable and expected, but must coincide with greater anticipated increases in associated revenues.

35
Managing Non-Interest Income & Non-Interest Expense

36
The Performance of Nontraditional Banking Companies

37
The Performance of Nontraditional Banking Companies
Examine: Goldman Sachs Investment bank converted to financial holding company in 2008 Mutual of Omaha Bank Subsidiary of Mutual of Omaha BMW Bank of North America An industrial loan corporation (ILC) owned by BMW Financial Services, a division of BMW North America
 owned by BMW Financial Services, a division of BMW North America.")
38
The Performance of Nontraditional Banking Companies
Financial Services Modernization Act (1999) Effectively allowed commercial and investment banks to merge. Investment Banking Activities Securities underwriting Advisory services Market making Propriety trading and investing
 Effectively allowed commercial and investment banks to merge. Investment Banking Activities. Securities underwriting. Advisory services. Market making. Propriety trading and investing.")
39
The Performance of Nontraditional Banking Companies

40
The Financial Performance of Goldman Sachs
Securities Underwriting Investment banks assist in raising funds through the issuance of bonds or stocks. If the security offering is a first-time placement Initial Public Offering (IPO) First-time placement
 First-time placement.")
41
The Financial Performance of Goldman Sachs
Advisory Services Investment banks offer numerous fee-based services that assist in managing risks Primary services are: Providing advice concerning mergers and acquisitions and spin-offs of lines of business Managing investable assets Making risk management decisions involving the uses of foreign currencies, commodities, and derivatives

42
The Financial Performance of Goldman Sachs
Market Making Investment banks may stand willing to buy securities from participants who want to sell and to sell securities to participants who want to buy Profit from the bid-ask spread. May also make a profit from the difference between the yield on the securities owned and the interest paid on debt Acts as a broker and does not take ownership of the underlying security.

43
The Financial Performance of Goldman Sachs
Proprietary Trading and Principal Investing Principal Investing When an investment bank takes a position in a security, derivative or stock of a company with the expectation that it will hold the position for some time, possibly even years, before trading out of it

44
The Financial Performance of Goldman Sachs
Proprietary Trading and Principal Investing Principal Investing Hedge Fund An investment fund that is limited to a small number of sophisticated investors. The fund’s managers take positions that are of any type and not subject to regulation. Managers generally charge a 2 percent fee applied to the amount of assets under management plus a 20 percent performance fee equal to 20 percent of the profit generated during a year. This fee structure generates an extraordinary profit for the managers with limited downside risk.

45
The Financial Performance of Goldman Sachs
Proprietary Trading and Principal Investing Principal Investing Private Equity Fund Accept investments from institutional investors in the form of limited partnership investments The funds use the proceeds to buy companies and make other investments, but usually have a longer investment horizon than hedge funds when entering transactions. Fund managers earn a management fee plus a percentage (usually 20 percent) of profits in excess of some minimum rate of return.
 of profits in excess of some minimum rate of return.")
46
The Financial Performance of Goldman Sachs
How Did Goldman Sachs Perform in 2007? Goldman Sachs’ Income Statement Record profits EPS over $26 ROE of nearly 33%

48
The Financial Performance of Goldman Sachs

49
The Financial Performance of Goldman Sachs
How Did Goldman Sachs Perform in 2007? Goldman Sachs’ Balance Sheet Financial Instruments Owned Cash and derivative securities Collateralized Agreements Borrowed securities and other financial instruments purchased under an agreement to resell at a later date. Receivables Amounts owed to Goldman Sachs by brokers, the firm’s customers, and counterparties to derivative and other contracts. Payables Amounts owed by Goldman Sachs

51
The Financial Performance of Goldman Sachs
How Did Goldman Sachs Perform in 2007? Key Performance Ratios Although Goldman Sachs did well in 2007, events in 2008 demonstrated that Goldman’s business model was not sustainable Goldman Sachs faced a severe liquidity crisis in 2008 due to the collapse of the housing market and declines in the values of assets that Goldman owned Its stock price fell from over $240 per share in 2007 to under $70 in 2008 In its fourth quarter of 2008, Goldman reported its first quarterly loss since it began trading as a public company

52
The Financial Performance of Goldman Sachs

53
The Financial Performance of Goldman Sachs
How Did Goldman Sachs Perform in 2007? Risk Faced by Goldman Sachs With the credit crisis of 2007–2009, the money and capital markets stopped functioning in any normal sense The commercial paper market froze and large institutions were hesitant to lend to each other Lenders were hesitant to roll over their debts and Goldman was unable to sell a sufficient volume of assets to readily access cash Management thus decided to convert to a FHC, which would allow it to access more stable, core deposits for its funding On the negative side, Goldman agreed to be regulated by the Federal Reserve as a bank

54
The Financial Performance of Goldman Sachs
How Did Goldman Sachs Perform in 2007? Goldman’s Risk Profile in 2007 Increasing and/or high rates and widening credit spreads Market fluctuations that may adversely affect the value of large trading and investment positions Declines in the number and size of securities underwritings and mergers and acquisitions that may lower revenues Declines in equity values that may lower asset management fees Possible decline in the volume of transactions executed by the firm as a specialist or market maker An increase in market volatility that may cause the firm to reduce its proprietary trading

55
The Financial Performance of Goldman Sachs
How Did Goldman Sachs Perform in 2007? Goldman’s Risk Profile Each of the above factors appeared to be to the detriment of Goldman Sachs in 2008 Goldman holds in its portfolio many different types of securities, some of which are difficult to value. Under FASB 157, Goldman Sachs is required to classify assets as Level 1, Level 2, or Level 3

56
The Financial Performance of Goldman Sachs
How Did Goldman Sachs Perform in 2007? Goldman’s Risk Profile

57
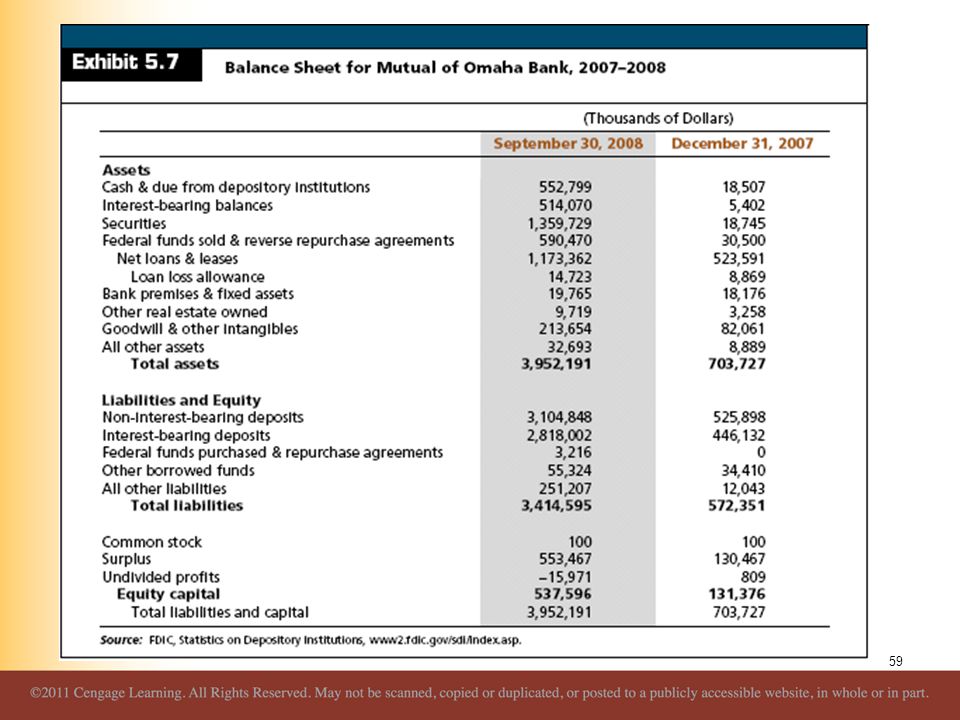
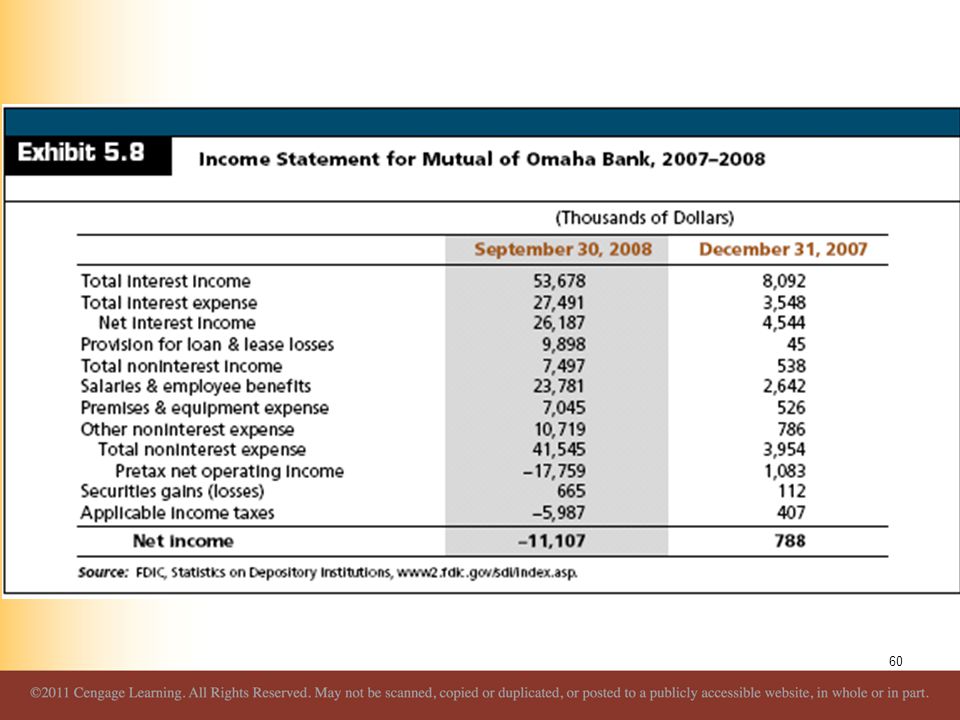
The Financial Performance of Mutual of Omaha Bank
Mutual of Omaha (MO) An insurance company that offers a wide range of life, disability, long-term care, and medical supplement insurance along with annuities and mutual funds In 2007, the company opened Mutual of Omaha Bank (MOB), a thrift with 13 locations in Nebraska and Colorado through the acquisition and merger of three existing banks MOB’s strategic objective is to “acquire community banks in fast-growing cities with a high density of Mutual of Omaha insurance customers”
 An insurance company that offers a wide range of life, disability, long-term care, and medical supplement insurance along with annuities and mutual funds. In 2007, the company opened Mutual of Omaha Bank (MOB), a thrift with 13 locations in Nebraska and Colorado through the acquisition and merger of three existing banks. MOB’s strategic objective is to acquire community banks in fast-growing cities with a high density of Mutual of Omaha insurance customers")
58
The Financial Performance of Mutual of Omaha Bank
In 2007, Mutual of Omaha had almost $20 billion in assets. Business model is to combine insurance and banking activities under the holding company

61
The Financial Performance of Mutual of Omaha Bank
Mutual of Omaha Bank’s Risk Profile MOB faces the same types of risk that other commercial banks face Its primary exposure is to credit risk The principal benefit from operating as part of MO is the diversification benefit and access to capital

62
Industrial Loan Companies (ILCs)
The Financial Performance of BMW Financial Services and BMW Bank of North America Industrial Loan Companies (ILCs) Originated in the early 1900s to make loans to borrowers who could not get loans at commercial banks Over time, ILCs were granted the right to issue deposits that were insured by the FDIC Today, the majority of ILCs are based in Utah, California, Colorado, and Nevada
 Originated in the early 1900s to make loans to borrowers who could not get loans at commercial banks. Over time, ILCs were granted the right to issue deposits that were insured by the FDIC. Today, the majority of ILCs are based in Utah, California, Colorado, and Nevada.")
63
The Financial Performance of BMW Financial Services and BMW Bank of North America
Industrial Loan Companies Historically, most ILCs operated to assist their parent organization in some facet of the firm’s core business ILCs gained notoriety when Wal-Mart applied for an ILC charter in 2005 Many community banks argued against granting Wal-Mart a charter because they were concerned that Wal-Mart would offer traditional banking services in all stores and potentially drive them out of business

64
The Financial Performance of BMW Financial Services and BMW Bank of North America
Industrial Loan Companies The primary criticisms against granting commerce companies ILC charters are: There should be a separation between commerce and banking to protect customers from potential conflicts of interest Firms like Wal-Mart could become so large and powerful that they might dominant business in many communities ILCs are not subject to the same regulation as commercial banks—which may create safety and soundness problems

65
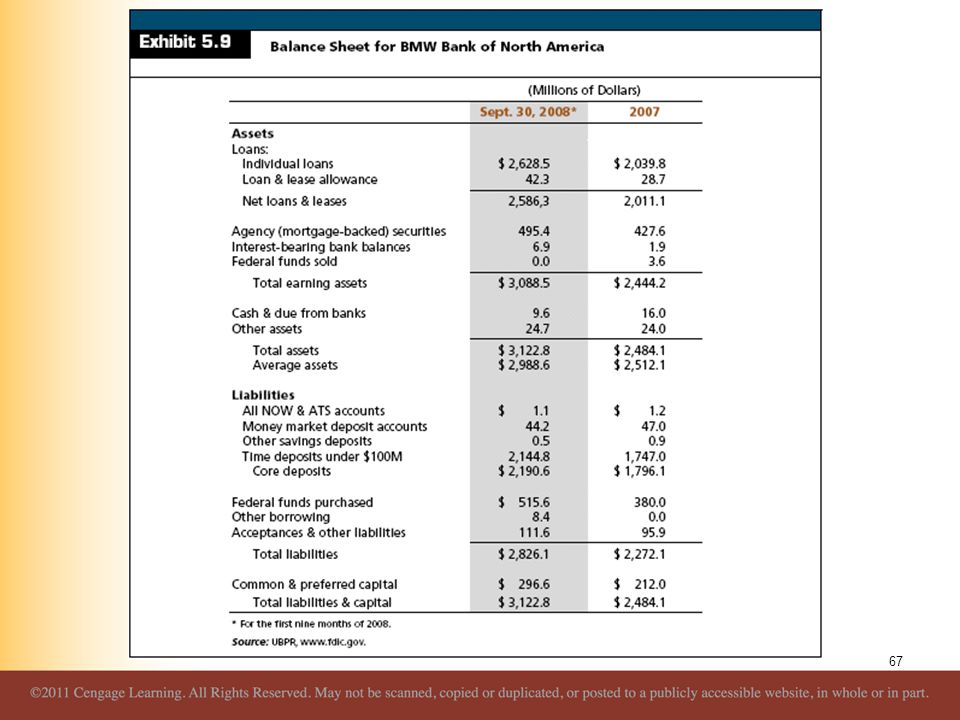
BMW Bank of North America is an ILC owned by BMW Financial Services
The Financial Performance of BMW Financial Services and BMW Bank of North America BMW Bank of North America is an ILC owned by BMW Financial Services BMW Financial Services offers loans, leases, and credit cards via BMW Bank Although BMW Bank operates from a single office in Utah, it collects deposits and uses borrowed funds to underwrite loans and leases for the purchase of automobiles at BMW dealers

66
The Financial Performance of BMW Financial Services and BMW Bank of North America
BMW Bank is chartered by the state of Utah and is also regulated by the FDIC because its deposits are FDIC insured BMW Bank makes loans to individuals either in the form of credit card loans or loans for automobiles The bank obtains most of it financing in the form of small time deposits and federal funds purchased

69
BMW Bank’s Risk Profile
The Financial Performance of BMW Financial Services and BMW Bank of North America BMW Bank’s Risk Profile Reported higher ROE then peers Invested proportionately more in loans than peers Gets no funding from demand deposits, raising its cost of funds Efficiency ratio is significantly lower than peers Higher charge-offs than peers

71
The Performance of Nontraditional Banking Companies

72
Pricing Fixed-Income Securities

73
The Mathematics of Interest Rates
Terms Present Value = PV The value today of a single future cash flow or series of cash flows Future Value = FV The amount to which a single cash flow or series of cash flows will grow over a given period of time when compounded at a given interest rate

74
The Mathematics of Interest Rates
Terms Interest Rate Per Year = i Number of Periods = n

75
Future Value and Present Value: Single Payment
Suppose you invest $1,000 for one year at 5% per year. What is the future value in one year? PV(1+i) = FV1 $1,000(1.05) = $1,050
 = FV1. $1,000(1.05) = $1,050.")
76
Future Value and Present Value: Single Payment
Suppose you leave the money in for another year. How much will you have two years from now? PV(1+i)2 = FV2 $1,000(1.05)2 = $1,102.50
2 = FV2. $1,000(1.05)2 = $1,")
77
The Mathematics of Interest Rates
Financial Calculators can solve the equation: FV = PV(1 + i)n There are 4 variables. If 3 are known, the calculator will solve for the 4th PMT represents multiple payments
n. There are 4 variables. If 3 are known, the calculator will solve for the 4th. PMT represents multiple payments.")
78
The Mathematics of Interest Rates
HP 10BII Future Value Present Value I/YR Interest Rate per Year Interest is entered as a percent, not a decimal For 10%, enter 10, NOT .10

79
The Mathematics of Interest Rates
HP 10BII Number of Periods Periods per Year Gold → C All Clears out all TVM registers Should do between all problems I am providing information on the Texas Instruments BA-II Plus – other calculators are similar. If you recommend or require a specific calculator other than this one, you may want to make the appropriate changes. Note: the more information students have to remember to enter the more likely they are to make a mistake. For this reason, I normally tell my students to set P/Y = 1 and leave it that way. Then I teach them to work on a period basis, which is consistent with using the formulas. If you want them to use the P/Y function, remind them that they will need to set it every time they work a new problem and that CLR TVM does not affect P/Y. If students are having difficulty getting the correct answer, make sure they have done the following: Set decimal places to floating point (2nd Format, Dec = 9 enter) Double check and make sure P/Y = 1 Make sure to clear the TVM registers after finishing a problem (or before starting a problem) It is important to point out that CLR TVM clears the FV, PV, N, I/Y and PMT registers. C/CE and CLR Work DO NOT affect the TVM keys The remaining slides will work the problems using the notation provided above for calculator keys. The formulas are presented in the notes section.
 Double check and make sure P/Y = 1. Make sure to clear the TVM registers after finishing a problem (or before starting a problem) It is important to point out that CLR TVM clears the FV, PV, N, I/Y and PMT registers. C/CE and CLR Work DO NOT affect the TVM keys. The remaining slides will work the problems using the notation provided above for calculator keys. The formulas are presented in the notes section.")
80
The Mathematics of Interest Rates
HP 10BII Gold → C All (Hold down [C] button) Check P/YR # → Gold → P/YR Sets Periods per Year to # Gold → DISP → # Gold and [=] button Sets display to # decimal places I am providing information on the Texas Instruments BA-II Plus – other calculators are similar. If you recommend or require a specific calculator other than this one, you may want to make the appropriate changes. Note: the more information students have to remember to enter the more likely they are to make a mistake. For this reason, I normally tell my students to set P/Y = 1 and leave it that way. Then I teach them to work on a period basis, which is consistent with using the formulas. If you want them to use the P/Y function, remind them that they will need to set it every time they work a new problem and that CLR TVM does not affect P/Y. If students are having difficulty getting the correct answer, make sure they have done the following: Set decimal places to floating point (2nd Format, Dec = 9 enter) Double check and make sure P/Y = 1 Make sure to clear the TVM registers after finishing a problem (or before starting a problem) It is important to point out that CLR TVM clears the FV, PV, N, I/Y and PMT registers. C/CE and CLR Work DO NOT affect the TVM keys The remaining slides will work the problems using the notation provided above for calculator keys. The formulas are presented in the notes section.
 Check P/YR. # → Gold → P/YR. Sets Periods per Year to # Gold → DISP → # Gold and [=] button. Sets display to # decimal places. I am providing information on the Texas Instruments BA-II Plus – other calculators are similar. If you recommend or require a specific calculator other than this one, you may want to make the appropriate changes. Note: the more information students have to remember to enter the more likely they are to make a mistake. For this reason, I normally tell my students to set P/Y = 1 and leave it that way. Then I teach them to work on a period basis, which is consistent with using the formulas. If you want them to use the P/Y function, remind them that they will need to set it every time they work a new problem and that CLR TVM does not affect P/Y. If students are having difficulty getting the correct answer, make sure they have done the following: Set decimal places to floating point (2nd Format, Dec = 9 enter) Double check and make sure P/Y = 1. Make sure to clear the TVM registers after finishing a problem (or before starting a problem) It is important to point out that CLR TVM clears the FV, PV, N, I/Y and PMT registers. C/CE and CLR Work DO NOT affect the TVM keys. The remaining slides will work the problems using the notation provided above for calculator keys. The formulas are presented in the notes section.")
81
The Mathematics of Interest Rates
HP 10BII Cash flows moving in opposite directions must have opposite signs. I am providing information on the Texas Instruments BA-II Plus – other calculators are similar. If you recommend or require a specific calculator other than this one, you may want to make the appropriate changes. Note: the more information students have to remember to enter the more likely they are to make a mistake. For this reason, I normally tell my students to set P/Y = 1 and leave it that way. Then I teach them to work on a period basis, which is consistent with using the formulas. If you want them to use the P/Y function, remind them that they will need to set it every time they work a new problem and that CLR TVM does not affect P/Y. If students are having difficulty getting the correct answer, make sure they have done the following: Set decimal places to floating point (2nd Format, Dec = 9 enter) Double check and make sure P/Y = 1 Make sure to clear the TVM registers after finishing a problem (or before starting a problem) It is important to point out that CLR TVM clears the FV, PV, N, I/Y and PMT registers. C/CE and CLR Work DO NOT affect the TVM keys The remaining slides will work the problems using the notation provided above for calculator keys. The formulas are presented in the notes section.
 Double check and make sure P/Y = 1. Make sure to clear the TVM registers after finishing a problem (or before starting a problem) It is important to point out that CLR TVM clears the FV, PV, N, I/Y and PMT registers. C/CE and CLR Work DO NOT affect the TVM keys. The remaining slides will work the problems using the notation provided above for calculator keys. The formulas are presented in the notes section.")
82
The Mathematics of Interest Rates
What is the future value of $1000 at 5% interest per year for two years? Inputs: N = 2 i = 5 PV = 1000 Output: FV =

83
Future Value and Present Value: Single Payment
Solving for the Rate of Interest PV(1+i)n = FVn i = (FVn/PV)1/n -1
n = FVn. i = (FVn/PV)1/n -1.")
84
Future Value and Present Value: Single Payment
Solving for the Rate of Interest Suppose we invest in a CD that promises to double our money in 8 years. What is the annual interest rate? i = ($1,800/$1,000)1/8 -1 = = 7.62%
1/8 -1 = = 7.62%")
85
Future Value and Present Value: Single Payment
Solving for Present Value PV(1+i)n = FVn PV = FVn/(1+i)n
n = FVn PV = FVn/(1+i)n.")
86
Future Value and Present Value: Single Payment
Solving for Present Value Suppose you have a choice between receiving a cash payment of $50,000 today or $60,000 in three years. If you could earn 7% on your investments, which would you choose? PV = $60,000/(1+.07)3 = $48,978
3 = $48,978.")
87
Future Value and Present Value: Single Payment
Solving for Present Value Since $48,978 is less than $50,000, you would prefer the $50,000 today

88
Future Value and Present Value: Multiple Payments
What is the future value of the following cash flow stream at the end of year 3?

89
Future Value and Present Value: Multiple Payments
What is the future value of the following cash flow stream at the end of year 3?

90
Future Value and Present Value: Multiple Payments
Find the value of each cash flow at the end of Year 3 and add them together Cash Flow 0: FV = 7,000(1.08)3 = 8,817.98 Cash Flow 1: FV = 4,000(1.08)2 = 4,665.60 Cash Flow 2: FV = 4,000(1.08) = 4,320 Cash Flow 3: FV = 4,000 Total value in 3 years 8, , , ,000 = 21,803.58
3 = 8, Cash Flow 1: FV = 4,000(1.08)2 = 4, Cash Flow 2: FV = 4,000(1.08) = 4,320. Cash Flow 3: FV = 4,000. Total value in 3 years. 8, , , ,000 = 21,")
91
Future Value and Present Value: Multiple Payments
Financial Calculator Solution Step 1: Find the PV of the cash flows

92
Future Value and Present Value: Multiple Payments
Financial Calculator Solution Step 2: Find the FV of the NPV Note: 1¢ difference due to rounding

93
Future Value and Present Value: Multiple Payments
What is the present value of the following cash flow stream?

94
Future Value and Present Value: Multiple Payments
What is the present value of the following cash flow stream?

95
Future Value and Present Value: Multiple Payments
Find the value of each cash flow today and add them together. Cash Flow 1: FV = 200/(1.12) = Cash Flow 2: FV = 400/(1.12)2 = Cash Flow 3: FV = 600(1.12)3 = Cash Flow 4: FV = 800/(1.12)4 = Total value = 1,432.93
 = Cash Flow 2: FV = 400/(1.12)2 = Cash Flow 3: FV = 600(1.12)3 = Cash Flow 4: FV = 800/(1.12)4 = Total value = 1,")
96
Future Value and Present Value: Multiple Payments
Financial Calculator Solution

97
Simple versus Compound Interest
Interest on Interest Simple Interest No Interest on Interest

98
Simple versus Compound Interest
Suppose is $1,000 deposited today at 5% for 2 years FV with Simple Interest $1,000 + $50 + $50 = $1,100 FV with Compound Interest $1000(1.05)2 = $1,102.50 The extra $2.50 comes from the extra interest earned on the first $50 interest payment 5%* $50 = $2.50.
2 = $1, The extra $2.50 comes from the extra interest earned on the first $50 interest payment. 5%* $50 = $2.50.")
99
Simple versus Compound Interest
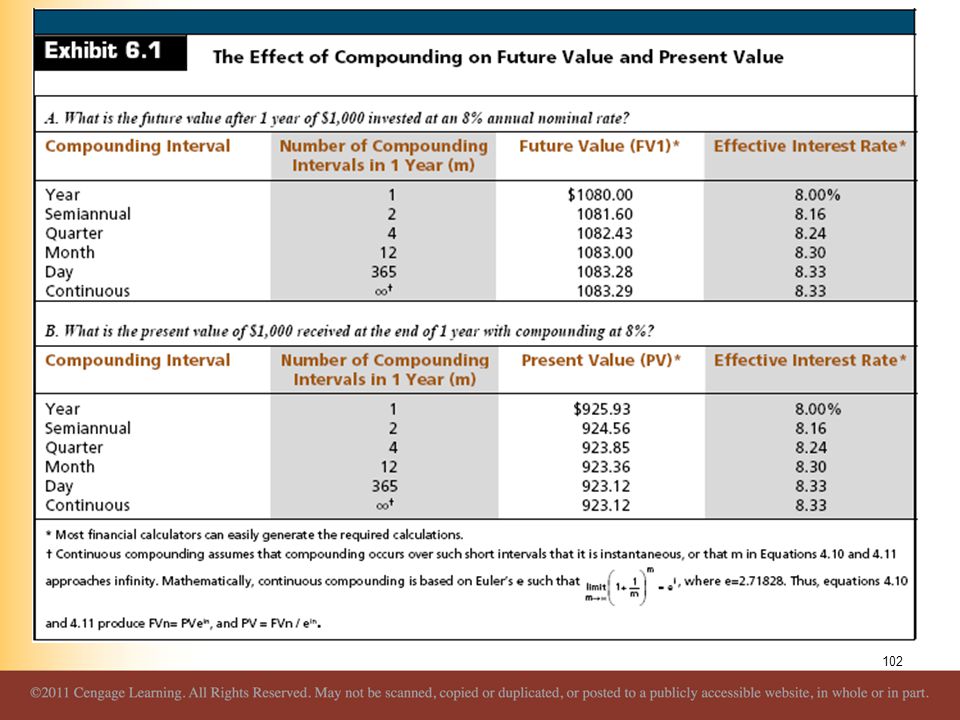
Compounding Frequency i = Nominal Interest Rate i* = Effective Annual Interest Rate m = Number of Compounding Periods in a Year

100
Simple versus Compound Interest
Compounding Frequency Suppose you can earn 1% per month on $100 invested today. How much are you effectively earning? i* = ( /12)12 – 1 i* = (1.01)12 – 1 = = 12.68%
12 – 1. i* = (1.01)12 – 1 = = 12.68%")
101
Simple versus Compound Interest
Compounding Frequency Financial Calculator Solution

103
The Relationship Between Interest Rates and Option-Free Bond Prices
A bond’s price is the present value of the future coupon payments (CPN) plus the present value of the face (par) value (FV)
 plus the present value of the face (par) value (FV)")
104
The Relationship Between Interest Rates and Option-Free Bond Prices
Bond Prices and Interest Rates are Inversely Related Consider a bond which pays semi-annual interest payments of $375 with a maturity of 3 years If the market rate of interest is 7.50%, the price of the bond is:

105
The Relationship Between Interest Rates and Option-Free Bond Prices
Bond Prices and Interest Rates are Inversely Related Financial Calculator Solution Point out that the APR is the same in either case, but your effective rate is different. Ask them which account they should use.

106
The Relationship Between Interest Rates and Option-Free Bond Prices
Bond Prices and Interest Rates are Inversely Related If the market rates of interest increases to 10%, the price of the bond falls to:

107
The Relationship Between Interest Rates and Option-Free Bond Prices
Bond Prices and Interest Rates are Inversely Related Financial Calculator Solution Point out that the APR is the same in either case, but your effective rate is different. Ask them which account they should use.

108
The Relationship Between Interest Rates and Option-Free Bond Prices
Bond Prices and Interest Rates are Inversely Related If the market rates of interest decreases to 5%, the price of the bond rises to:

109
The Relationship Between Interest Rates and Option-Free Bond Prices
Bond Prices and Interest Rates are Inversely Related Financial Calculator Solution Point out that the APR is the same in either case, but your effective rate is different. Ask them which account they should use.

110
The Relationship Between Interest Rates and Option-Free Bond Prices
Bond Prices and Interest Rates are Inversely Related Par Bond Yield to maturity = coupon rate Discount Bond Yield to maturity > coupon rate Premium Bond Yield to maturity < coupon rate Point out that the APR is the same in either case, but your effective rate is different. Ask them which account they should use.

111
The Relationship Between Interest Rates and Option-Free Bond Prices
Point out that the APR is the same in either case, but your effective rate is different. Ask them which account they should use.

112
The Relationship Between Interest Rates and Option-Free Bond Prices
Bond Prices Change Asymmetrically to Rising and Falling Rates For a given absolute change in interest rates, the percentage increase in an option-free bond’s price will exceed the percentage decrease Point out that the APR is the same in either case, but your effective rate is different. Ask them which account they should use.

114
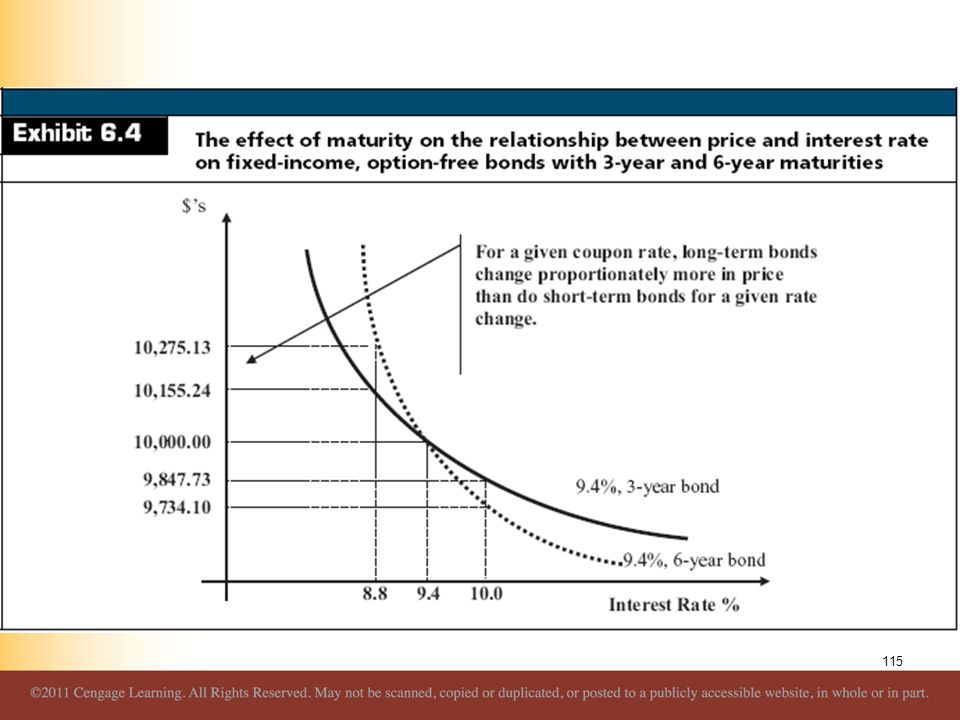
The Relationship Between Interest Rates and Option-Free Bond Prices
Maturity Influences Bond Price Sensitivity For bonds that pay the same coupon rate, long-term bonds change proportionally more in price than do short-term bonds for a given rate change Point out that the APR is the same in either case, but your effective rate is different. Ask them which account they should use.

116
The Relationship Between Interest Rates and Option-Free Bond Prices
The Size of the Coupon Influences Bond Price Sensitivity For bonds that have the same maturity, long-term bonds will change proportionally more in price than short-term bonds for a given change in the rate change Point out that the APR is the same in either case, but your effective rate is different. Ask them which account they should use.

118
Duration and Price Volatility
Duration as an Elasticity Measure Maturity simply identifies how much time elapses until final payment It ignores all information about the timing and magnitude of interim payments

119
Duration and Price Volatility
Duration as an Elasticity Measure Duration is a measure of the effective maturity of a security Duration incorporates the timing and size of a security’s cash flows Duration measures how price sensitive a security is to changes in interest rates The greater (shorter) the duration, the greater (lesser) the price sensitivity
 the duration, the greater (lesser) the price sensitivity.")
120
Duration and Price Volatility
Duration as an Elasticity Measure Duration versus Maturity Consider the cash flows for these two securities

121
Duration and Price Volatility
Duration as an Elasticity Measure Duration versus Maturity The maturity of both is 20 years Maturity does not account for the differences in the timing of the cash flows

122
Duration and Price Volatility
Duration as an Elasticity Measure Duration versus Maturity What is the effective maturity of both? The effective maturity of the first security is: (1,000/1,000) x 1 = 20 years The effective maturity of the second security is: [(900/1,000) x 1]+[(100/1,000) x 20] = 2.9 years Duration is similar, however, it uses a weighted average of the present values of the cash flows
 x 1 = 20 years. The effective maturity of the second security is: [(900/1,000) x 1]+[(100/1,000) x 20] = 2.9 years. Duration is similar, however, it uses a weighted average of the present values of the cash flows.")
123
Duration and Price Volatility
Duration as an Elasticity Measure Duration is an approximate measure of the price elasticity of demand

124
Duration and Price Volatility
Duration as an Elasticity Measure The longer the duration, the larger the change in price for a given change in interest rates

125
Duration and Price Volatility
Measuring Duration Duration is a weighted average of the time until the expected cash flows from a security will be received, relative to the security’s price Macaulay’s Duration

126
Duration and Price Volatility
Measuring Duration Example What is the duration of a bond with a $1,000 face value, 10% coupon, 3 years to maturity and a 12% YTM?

127
Duration and Price Volatility
Measuring Duration Example What is the duration of a bond with a $1,000 face value, 10% coupon, 3 years to maturity but the YTM is 5%?

128
Duration and Price Volatility
Measuring Duration Example What is the duration of a bond with a $1,000 face value, 10% coupon, 3 years to maturity but the YTM is 20%?

129
Duration and Price Volatility

130
Duration and Price Volatility
Duration of a Zero Coupon Bond What is the duration of a zero coupon bond with a $1,000 face value, 3 years to maturity but the YTM is 12%? By definition, the duration of a zero coupon bond is equal to its maturity

131
Duration and Price Volatility
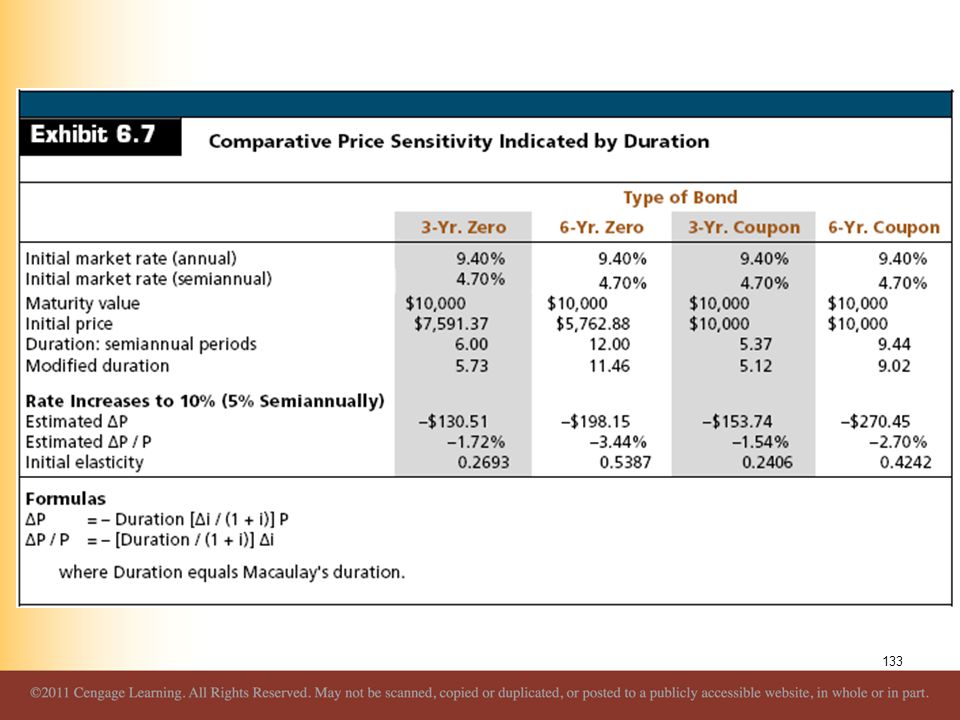
Comparing Price Sensitivity The greater the duration, the greater the price sensitivity

132
Duration and Price Volatility
Comparing Price Sensitivity With Modified Duration, we have an estimate of price volatility:

134
Recent Innovations in the Valuation of Fixed-Income Securities
Traditional fixed-income valuation methods are too simplistic because: Investors often do not hold securities until maturity Present value calculations assume all coupon payments are reinvested at the calculated Yield to Maturity Many securities carry embedded options, such as a call or put, which complicates valuation since it is unknown if the option will be exercised and at what price

135
Recent Innovations in the Valuation of Fixed-Income Securities
Fixed-Income securities should be priced as a package of cash flows with each cash flow discounted at the appropriate zero coupon rate

136
Recent Innovations in the Valuation of Fixed-Income Securities
Total Return Analysis Sources of Return Coupon Interest Reinvestment Income Interest-on-interest Capital Gains or Losses

137
Recent Innovations in the Valuation of Fixed-Income Securities
Total Return Analysis Example What is the total return for a 9-year, 7.3% coupon bond purchased at $99.62 per $100 par value and held for 5-years? Assume the semi-annual reinvestment rate is 3% and after five years a comparable 4-year maturity bond will be priced to yield 7% (3.5% semi-annually) to maturity
 to maturity.")
138
Recent Innovations in the Valuation of Fixed-Income Securities
Total Return Analysis

139
Money Market Yields Interest-Bearing Loans with Maturities of One Year or Less The effective annual yield for a loan less than one year is:

140
Money Market Yields Interest rates on different money market instruments are measured and quoted in different terms Some money market instruments are quoted on a discount basis, while others bear interest Some yields are quoted on a 360-day year rather than a 365 or 366 day year

141
Money Market Yields Interest-Bearing Loans with Maturities of One Year or Less Assume a 180 day loan is made at an annualized rate of 10%. What is the effective annual yield?

142
Money Market Yields 360-Day versus 365-Day Yields
Some securities are reported using a 360 year rather than a full 365 day year This will mean that the rate quoted will be 5 days too small on a standard annualized basis of 365 days

143
Money Market Yields 360-Day versus 365-Day Yields
To convert from a 360-day year to a 365-day year: i365 = i360 (365/360) Example One year instrument at an 8% nominal rate on a 360-day year is actually an 8.11% rate on a 365-day year: i365 = 0.08 (365/360) =
 Example. One year instrument at an 8% nominal rate on a 360-day year is actually an 8.11% rate on a 365-day year: i365 = 0.08 (365/360) =")
144
Money Market Yields Discount Yields
Some money market instruments, such as Treasury Bills, are quoted on a discount basis This means that the purchase price is always below the par value at maturity The difference between the purchase price and par value at maturity represents interest

145
Money Market Yields Discount Yields
The pricing equation for a discount instrument is: where: idr = discount rate Po = initial price of the instrument Pf = final price at maturity or sale h = number of days in holding period

146
Money Market Yields Two Problems with the Discount Rate
The return is based on the final price of the asset, rather than on the purchase price It assumes a 360-day year One solution is the Bond Equivalent Rate: ibe

147
Money Market Yields A problem with the Bond Equivalent Rate is that it does not incorporate compounding. The Effective Annual Rate addresses this issue.

148
Money Market Yields Example:
Consider a $1 million T-bill with 182 days to maturity and a price of $964,500

149
Money Market Yields Yields on Single-Payment, Interest-Bearing Securities Some money market instruments, such as large negotiable CD’s, Eurodollars, and federal funds, pay interest calculated against the par value of the security and make a single payment of interest and principal at maturity

150
Money Market Yields Yields on Single-Payment, Interest-Bearing Securities Example: consider a 182-day CD with a par value of $1,000,000 and a quoted rate of 7.02%. Actual interest paid at maturity is: (0.0702)(182 / 360) $1,000,000 = $35,490 The 365 day yield is: i365 = (365 / 360) = The effective annual rate is:
(182 / 360) $1,000,000 = $35,490. The 365 day yield is: i365 = (365 / 360) = The effective annual rate is:")
152
Pricing Fixed-Income Securities

153
Funding the Bank

154
The Relationship Between Liquidity Requirements, Cash, and Funding Sources
The amount of cash that a bank holds is influenced by the bank’s liquidity requirements The size and volatility of cash requirements affect the liquidity position of the bank Deposits, withdrawals, loan disbursements, and loan payments affect the bank’s cash balance and liquidity position

156
The Relationship Between Liquidity Requirements, Cash, and Funding Sources
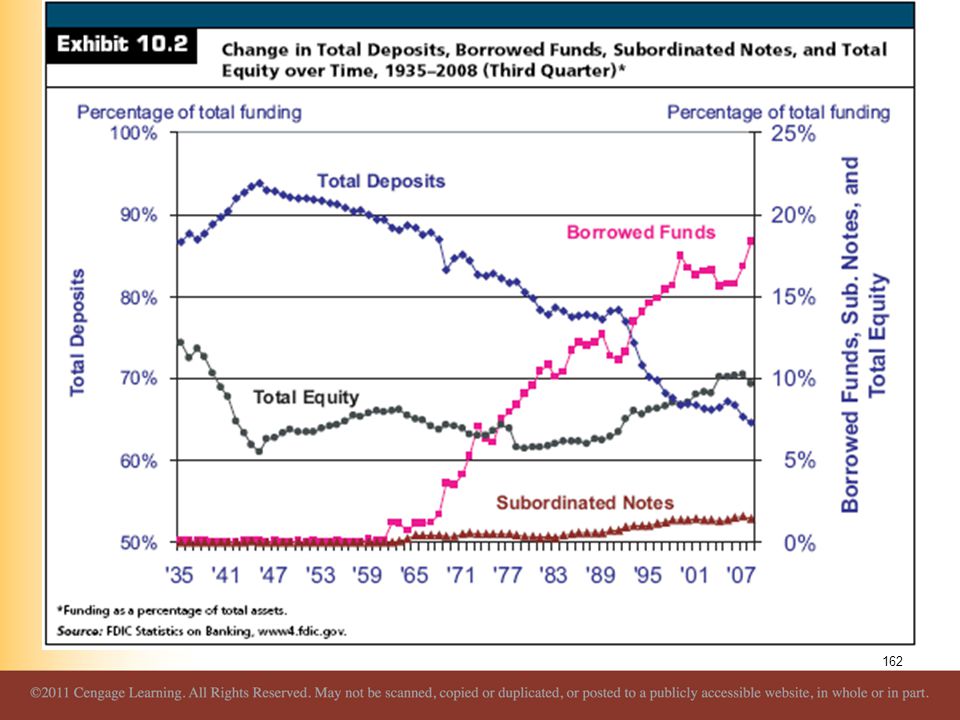
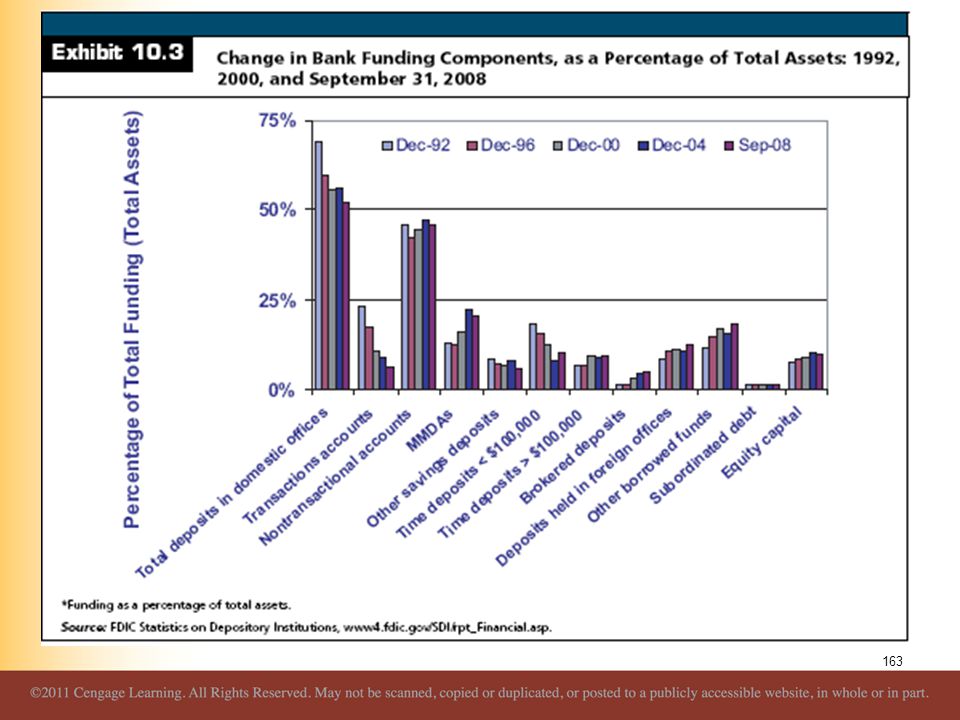
Recent Trends in Bank Funding Sources Bank customers have become more rate conscious Many customers have demonstrated a a strong preference for shorter-term deposits Core deposits are viewed as increasingly valuable Bank often issue hybrid CDs to appeal to rate sensitive depositors

157
The Relationship Between Liquidity Requirements, Cash, and Funding Sources
Recent Trends in Bank Funding Sources Retail Funding Deposit Accounts Transaction accounts Money market deposit accounts Savings accounts Small time deposits

158
The Relationship Between Liquidity Requirements, Cash, and Funding Sources
Recent Trends in Bank Funding Sources Borrowed Funding Federal Funds purchased Repurchase agreements Federal Home Loan Bank borrowings

159
The Relationship Between Liquidity Requirements, Cash, and Funding Sources
Recent Trends in Bank Funding Sources Wholesale Funding Includes borrowed funds plus large CDs Equity Funding Common stock Preferred stock Retained earnings

160
The Relationship Between Liquidity Requirements, Cash, and Funding Sources
Recent Trends in Bank Funding Sources Volatile (Managed) Liabilities Funds purchased from rate-sensitive investors Federal Funds purchased Repurchase agreements Jumbo CDs Eurodollar time deposits Foreign Deposits Investors will move their funds if other institutions are paying higher rates
 Liabilities. Funds purchased from rate-sensitive investors. Federal Funds purchased. Repurchase agreements. Jumbo CDs. Eurodollar time deposits. Foreign Deposits. Investors will move their funds if other institutions are paying higher rates.")
161
The Relationship Between Liquidity Requirements, Cash, and Funding Sources
Recent Trends in Bank Funding Sources Core Deposits Stable deposits that customers are less likely to withdraw when interest rates on competing investments rise Includes: Transactions accounts MMDAs Savings accounts Small CDs

165
Characteristics of Retail-Type Deposits
Retail Deposits Small denomination (under $100,000) liabilities Normally held by individual investors Not actively traded in the secondary market
 liabilities. Normally held by individual investors. Not actively traded in the secondary market.")
166
Characteristics of Retail-Type Deposits
Transaction Accounts Most banks offer three different transaction accounts Demand Deposits DDAs Negotiable Order of Withdrawal NOWs Automatic Transfers from Savings ATS

167
Characteristics of Retail-Type Deposits
Transaction Accounts Demand Deposits Checking accounts that do not pay interest Held by individuals, business, and governmental units Most are held by businesses since Regulation Q prohibits banks from paying explicit interest on for-profit corporate checking accounts

168
Characteristics of Retail-Type Deposits
Transaction Accounts NOW Accounts Checking accounts that pay interest ATS Accounts Customer has both a DDA and savings account The bank transfers enough from savings to DDA each day to force a zero balance in the DDA account For-profit corporations are prohibited from owning NOW and ATS accounts

169
Characteristics of Retail-Type Deposits
Transaction Accounts Although the interest cost of transaction accounts is very low, the non-interest costs can be quite high Generally, low balance checking accounts are not profitable for banks due to the high cost of processing checks

170
Characteristics of Retail-Type Deposits
Nontransactional Accounts Non-transaction accounts are interest-bearing with limited or no check-writing privileges

171
Characteristics of Retail-Type Deposits
Nontransactional Accounts Money Market Deposit Accounts Pay interest but holders are limited to 6 transactions per month, of which only three can be checks Attractive to banks because they are not required to hold reserves against MMDAs

172
Characteristics of Retail-Type Deposits
Nontransactional Accounts Savings Accounts Have no fixed maturity Small Time Deposits (Retail CDs) Have a specified maturity ranging from 7 days on up Large Time Deposits (Jumbo CDs) Negotiable CDs of $100,000 or more Typically can be traded in the secondary market
 Have a specified maturity ranging from 7 days on up. Large Time Deposits (Jumbo CDs) Negotiable CDs of $100,000 or more. Typically can be traded in the secondary market.")
173
Characteristics of Retail-Type Deposits
Estimating the Cost of Deposit Accounts Interest Costs Legal Reserve Requirements Check Processing Costs Account Charges NSF fees Monthly fees Per check fees

174
Characteristics of Retail-Type Deposits
Estimating the Cost of Deposit Accounts Transaction Account Cost Analysis Classifies check-processing as: Deposits Electronic Non-Electronic Withdrawals

175
Characteristics of Retail-Type Deposits
Estimating the Cost of Deposit Accounts Transaction Account Cost Analysis Classifies check-processing as: Transit Checks Deposited Cashed Account Opened or Closed On-Us checks cashed General account maintenance Truncated Non-Truncated

176
Characteristics of Retail-Type Deposits
Estimating the Cost of Deposit Accounts Transaction Account Cost Analysis Electronic Transactions Conducted through automatic deposits, Internet, and telephone bill payment Non-Electronic Transactions Conducted in person or by mail Transit Checks Checks drawn on any bank other than the bank it was deposited into

177
Characteristics of Retail-Type Deposits
Estimating the Cost of Deposit Accounts Transaction Account Cost Analysis On-Us Checks Cashed Checks drawn on the bank’s own customer’s accounts Deposits Checks or currency directly deposited in the customer's account Account Maintenance General record maintenance and preparing & mailing a periodic statement

178
Characteristics of Retail-Type Deposits
Estimating the Cost of Deposit Accounts Transaction Account Cost Analysis Truncated Account A checking account in which the physical check is ‘truncated’ at the bank and the checks are not returned to the customer Official Check Issued A check for certified funds. Net Indirect Costs Those costs not directly related to the product such as management salaries or general overhead costs

180
Characteristics of Retail-Type Deposits
Calculating the Average Net Cost of Deposit Accounts Average Historical Cost of Funds Measure of average unit borrowing costs for existing funds Average Interest Cost Calculated by dividing total interest expense by the average dollar amount of liabilities outstanding

181
Characteristics of Retail-Type Deposits
Calculating the Average Net Cost of Deposit Accounts

182
Characteristics of Retail-Type Deposits
Calculating the Average Net Cost of Deposit Accounts Example: If a demand deposit account does not pay interest, has $20.69 in transaction costs charges, $7.75 in fees, an average balance of $5,515, and 5% float, what is the net cost of the deposit?

184
Characteristics of Large Wholesale Deposits
Wholesale Liabilities Customers move these investments on the basis of small rate differentials, so these funds are labeled: Hot Money Volatile Liabilities Short-Term Non-Core funding

185
Characteristics of Large Wholesale Deposits
Wholesale Liabilities Jumbo CDs $100,000 or more Negotiable Can be traded on the secondary market Minimum maturity of 7 days Interest rates quoted on a 360-day year basis Insured up to $100,000 per investor per institution Issued directly or indirectly through a dealer or broker (Brokered Deposits)
")
186
Characteristics of Large Wholesale Deposits
Wholesale Liabilities Jumbo CDs Fixed-Rate Variable-Rate Jump Rate (Bump-up) CD Depositor has a one-time option until maturity to change the rate to the prevailing market rate
 CD. Depositor has a one-time option until maturity to change the rate to the prevailing market rate.")
187
Characteristics of Large Wholesale Deposits
Wholesale Liabilities Jumbo CDs Callable Zero Coupon Stock Market Indexed Rate tied to stock market index performance Rate Boards Represent venues for selling non-brokered CDs via the Internet to institutional investors Rate boards help raise funds quickly and represent a virtual branch for a bank

188
Characteristics of Large Wholesale Deposits
Individual Retirement Accounts Each year, a wage earner can make a tax-deferred investment up to $8,000 of earned income Funds withdrawn before age 59 ½ are subject to a 10% IRS penalty This makes IRAs an attractive source of long-term funding for banks

189
Characteristics of Large Wholesale Deposits
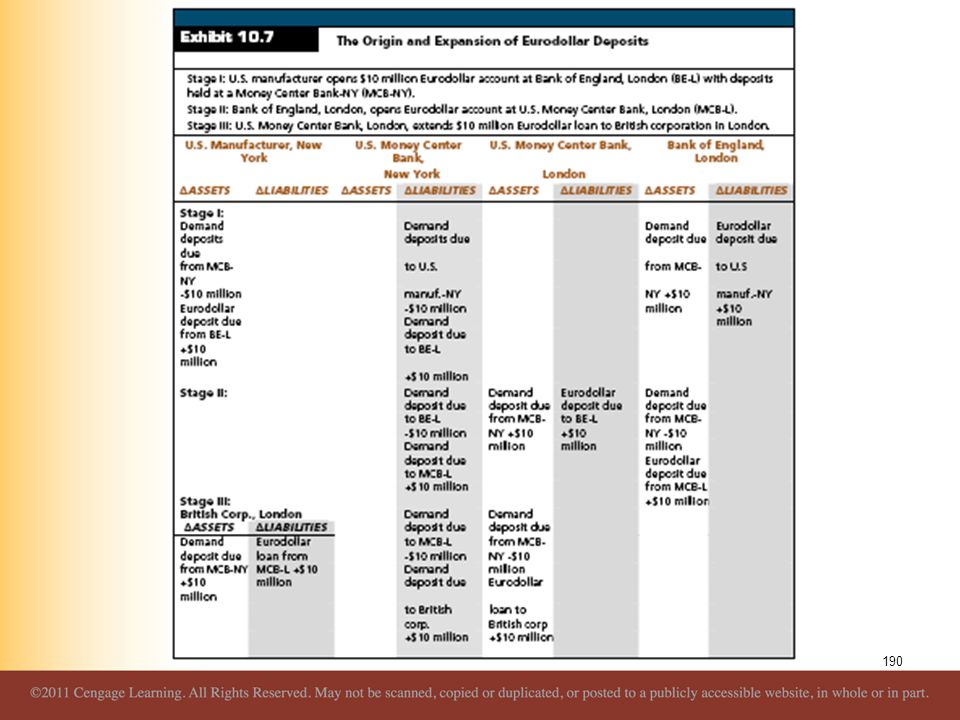
Foreign Office Deposits Eurocurrency Financial claim denominated in a currency other than that of the country where the issuing bank is located Eurodollar Dollar-denominated financial claim at a bank outside the U.S. Eurodollar deposits Dollar-denominated depots in banks outside the U.S.

191
Characteristics of Large Wholesale Deposits
Borrowing Immediately Available Funds Federal Funds Purchased The term Fed Funds is often used to refer to excess reserve balances traded between banks This is grossly inaccurate, given reserves averaging as a method of computing reserves, different non-bank players in the market, and the motivation behind many trades Most transactions are overnight loans, although maturities are negotiated and can extend up to several weeks Interest rates are negotiated between trading partners and are quoted on a 360-day basis

192
Characteristics of Large Wholesale Deposits
Borrowing Immediately Available Funds Security Repurchase Agreements (RPs or Repos) Short-term loans secured by government securities that are settled in immediately available funds Identical to Fed Funds except they are collateralized Technically, the RPs entail the sale of securities with a simultaneous agreement to buy them back later at a fixed price plus accrued interest
 Short-term loans secured by government securities that are settled in immediately available funds. Identical to Fed Funds except they are collateralized. Technically, the RPs entail the sale of securities with a simultaneous agreement to buy them back later at a fixed price plus accrued interest.")
193
Characteristics of Large Wholesale Deposits
Borrowing Immediately Available Funds Security Repurchase Agreements (RPs or Repos) Most transactions are overnight In most cases, the market value of the collateral is set above the loan amount when the contract is negotiated. This difference is labeled the margin The lender’s transaction is referred to as a Reverse Repo
 Most transactions are overnight. In most cases, the market value of the collateral is set above the loan amount when the contract is negotiated. This difference is labeled the margin. The lender’s transaction is referred to as a Reverse Repo.")
194
Characteristics of Large Wholesale Deposits
Borrowing Immediately Available Funds Structured Repurchase Agreements Embeds an option (call, put, swap, cap, floor, etc.) in the instrument to either lower its initial cost to the borrower or better help the borrower match the risk and return profile of an investment Flipper Repo Carries a floating rate that will convert, or flip, to a fixed rate after some lock-out period
 in the instrument to either lower its initial cost to the borrower or better help the borrower match the risk and return profile of an investment. Flipper Repo. Carries a floating rate that will convert, or flip, to a fixed rate after some lock-out period.")
195
Characteristics of Large Wholesale Deposits
Borrowing From the Federal Reserve Discount Window Discount Rate Policy is to set discount rate 1% (1.5%) over the Fed Funds target for primary (secondary) credit loans To borrow from the Federal Reserve, banks must apply and provide acceptable collateral before the loan is granted Eligible collateral includes U.S. government securities, bankers acceptances, and qualifying short-term commercial or government paper
 over the Fed Funds target for primary (secondary) credit loans. To borrow from the Federal Reserve, banks must apply and provide acceptable collateral before the loan is granted. Eligible collateral includes U.S. government securities, bankers acceptances, and qualifying short-term commercial or government paper.")
196
Characteristics of Large Wholesale Deposits
Borrowing From the Federal Reserve Discount Rate Current Interest Rates 9/09/2009 Primary Credit 0.50% Secondary Credit 1.00% Seasonal Credit 0.25% Fed Funds Target %

197
Characteristics of Large Wholesale Deposits
Borrowing From the Federal Reserve Primary Credit Available to sound depository institutions on a short-term basis to meet short-term funding needs

198
Characteristics of Large Wholesale Deposits
Borrowing From the Federal Reserve Secondary Credit Available to depository institutions that are not eligible for primary credit Available to meet backup liquidity needs when its use is consistent with a timely return to a reliance on market sources of funding or the orderly resolution of a troubled institution

199
Characteristics of Large Wholesale Deposits
Borrowing From the Federal Reserve Seasonal Credit Designed to assist small depository institutions in managing significant seasonal swings in their loans and deposits

200
Characteristics of Large Wholesale Deposits
Borrowing From the Federal Reserve Emergency Credit May be authorized in unusual and exigent circumstances by the Board of Governors to individuals, partnerships, and corporations that are not depository institutions

201
Characteristics of Large Wholesale Deposits
Other Borrowing from the Federal Reserve Term Auction Facility Allows banks to bid for an advance that will generally have a 28-day maturity Banks must post collateral against the borrowings and cannot prepay the loan

202
Characteristics of Large Wholesale Deposits
Other Borrowing from the Federal Reserve Term Securities Lending Facility A facility in which the Open Market Trading Desk of the Federal Reserve Bank of New York makes loans to primary securities dealers

203
Characteristics of Large Wholesale Deposits
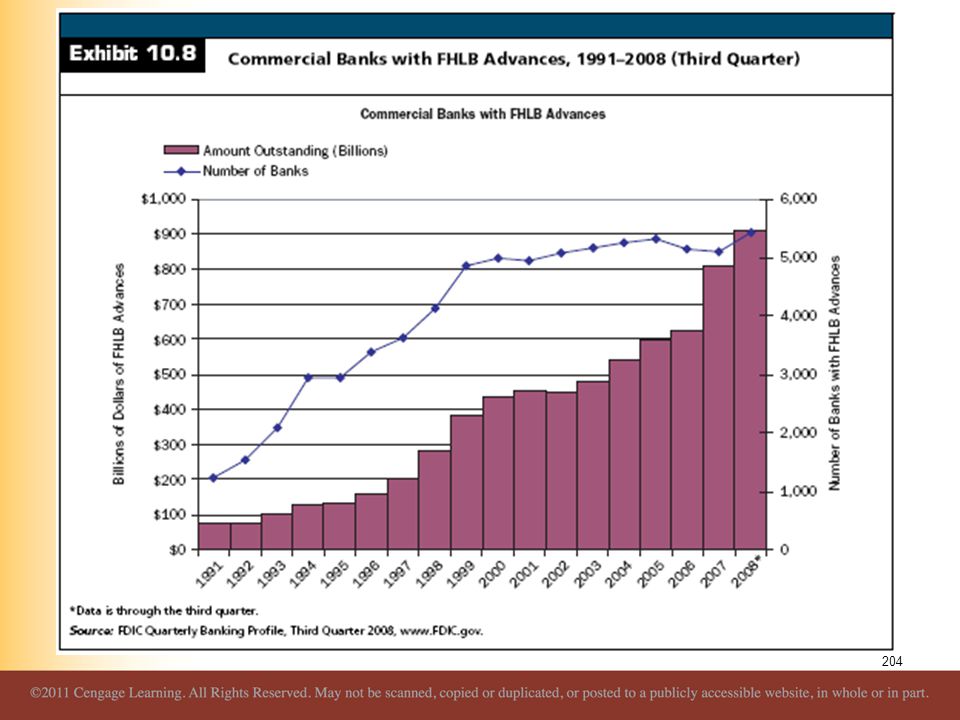
Federal Home Loan Bank Advances The FHLB system is a government-sponsored enterprise created to assist in home buying The FHLB system is one of the largest U.S. financial institutions, rated AAA because of the government sponsorship Any bank can become a member of the FHLB system by buying FHLB stock If it has the available collateral, primarily real estate related loans, it can borrow from the FHLB FHLB advances have maturities from 1 day to as long as 20 years

205
Electronic Money Intelligent Card Memory Card
Contains a microchip with the ability to store and secure information Memory Card Simply store information

206
Electronic Money Debit Card Online Offline PIN based
Transaction goes through the ATM system Offline Signature based transactions Transaction goes through the credit card system

207
Electronic Money Electronic Funds Transfer (EFT)
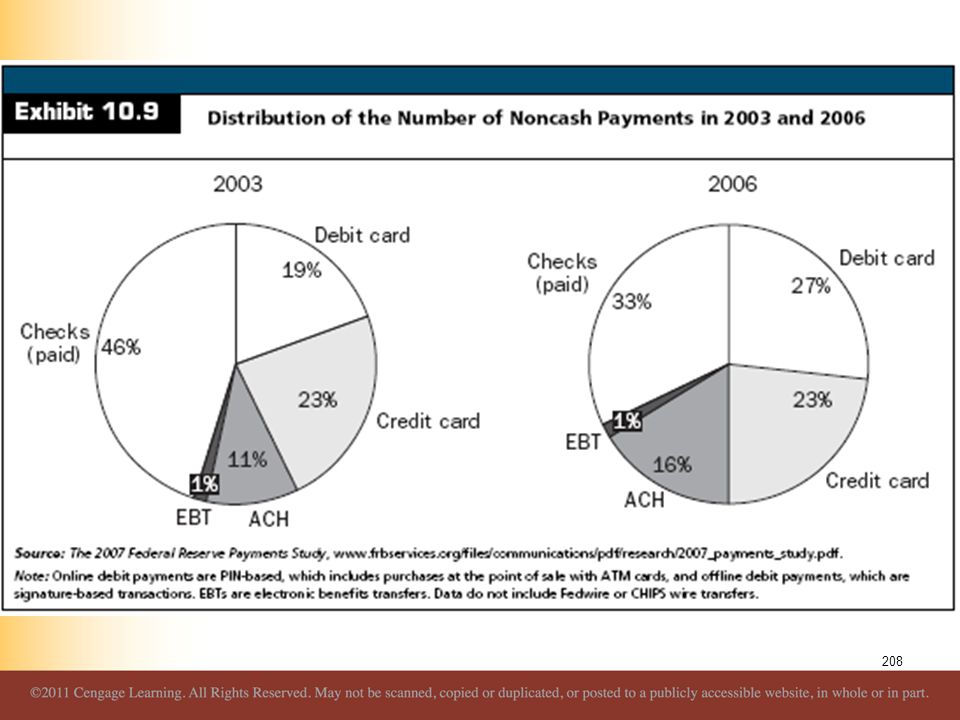
An electronic movement of financial data, designed to eliminate the paper instruments normally associated with such funds movement Types of EFT ACH: Automated Clearing House POS: Point of Sale ATM Direct Deposit Telephone Bill Paying Automated Merchant Authorization Systems Preauthorized Payments

209
Check 21 Check Clearing for the 21st Century Act
Facilitates check truncation by reducing some of the legal impediments Foster innovation in the payments and check collection system without mandating receipt of check in electronic form Improve the overall efficiency of the nation’s payment system

210
Check 21 Check Truncation
Conversion of a paper check into an electronic debit or image of the check by a third party in the payment system other than the paying bank Facilitates check truncation by creating a new negotiable instrument called a substitute check

211
Check 21 Substitute Check
The legal equivalent of the original check and includes all the information contained on the original Check 21 does NOT require banks to accept checks in electronic form nor does it require banks to create substitute checks It does allow banks to handle checks electronically instead of physically moving paper checks

213
Check 21 Check Clearing Process
Banks typically place a hold on a check until it verifies that the check is “good” Expedited Funds Availability Act Under Reg CC, it states that: Local check must clear in no more than two business days Non-local checks must clear in no more than five business days Government, certified, and cashiers checks must be available by 9 a.m. the next business day

215
Measuring the Cost of Funds
Average Historical Cost of Funds Many banks incorrectly use the average historical costs in their pricing decisions The primary problem with historical costs is that they provide no information as to whether future interest costs will rise or fall. Pricing decisions should be based on marginal costs compared with marginal revenues

216
Measuring the Cost of Funds
The Marginal Cost of Funds Marginal Cost of Debt Measure of the borrowing cost paid to acquire one additional unit of investable funds Marginal Cost of Equity Measure of the minimum acceptable rate of return required by shareholders Marginal Cost of Funds The marginal costs of debt and equity

217
Measuring the Cost of Funds
The Marginal Cost of Funds Costs of Independent Sources of Funds It is difficult to measure marginal costs precisely Management must include both the interest and noninterest costs it expects to pay and identify which portion of the acquired funds can be invested in earning assets

218
Measuring the Cost of Funds
The Marginal Cost of Funds Costs of Independent Sources of Funds Marginal costs may be defined as :

219
Measuring the Cost of Funds
The Marginal Cost of Funds Costs of Independent Sources of Funds Example: Market interest rate is 2.5% Servicing costs are 4.1% of balances Acquisition costs are 1.0% of balances Deposit insurance costs are 0.25% of balances Net investable balance is 85% of the balance (10% required reserves and 5% float)
")
220
Measuring the Cost of Funds
The Marginal Cost of Funds Costs of Independent Sources of Funds Example:

221
Measuring the Cost of Funds
The Marginal Cost of Funds Costs of Independent Sources of Funds Cost of Debt Equals the effective cost of borrowing from each source, including interest expense and transactions costs This cost is the discount rate, which equates the present value of expected interest and principal payments with the net proceeds to the bank from the issue

222
Measuring the Cost of Funds
The Marginal Cost of Funds Costs of Independent Sources of Funds Cost of Debt Example: Assume the bank will issue: $10 million in par value subordinated notes paying $700,000 in annual interest and a 7-year maturity It must pay $100,000 in flotation costs to an underwriter The effective cost of borrowing (kd) is 7.19%
 is 7.19%")
223
Measuring the Cost of Funds
The Marginal Cost of Funds Costs of Independent Sources of Funds Cost of Debt Example:

224
Measuring the Cost of Funds
The Marginal Cost of Funds Costs of Independent Sources of Funds Cost of Equity The marginal cost of equity equals the required return to shareholders It is not directly measurable because dividend payments are not mandatory

225
Measuring the Cost of Funds
The Marginal Cost of Funds Costs of Independent Sources of Funds Cost of Equity Several methods are commonly used to approximate this required return: Dividend Valuation Model Capital Asset Pricing Model (CAPM) Targeted Return on Equity Model Cost of Debt + Risk Premium
 Targeted Return on Equity Model. Cost of Debt + Risk Premium.")
226
Measuring the Cost of Funds
The Marginal Cost of Funds Costs of Independent Sources of Funds Cost of Preferred Stock Preferred stock acts as a hybrid of debt and common equity Claims are superior to those of common stockholders but subordinated to those of debt holders Preferred stock pays dividends that may be deferred when management determines that earnings are too low. The marginal cost of preferred stock can be approximated in the same manner as the Dividend Valuation Model however, dividend growth is zero

227
Measuring the Cost of Funds
The Marginal Cost of Funds Costs of Independent Sources of Funds Trust Preferred Stock Trust preferred stock is attractive because it effectively pays dividends that are tax deductible This loan interest is tax deductible such that the bank effectively gets to deduct dividend payments as the preferred stock

228
Measuring the Cost of Funds
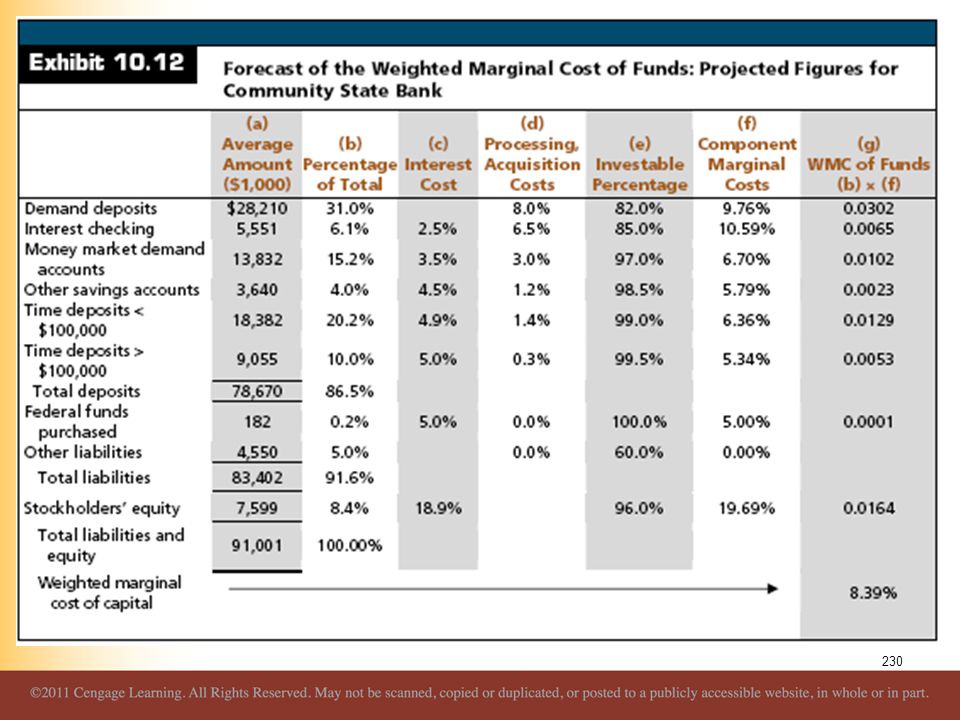
Weighted Marginal Cost of Total Funds This is the best cost measure for asset-pricing purposes It recognizes both explicit and implicit costs associated with any single source of funds

229
Measuring the Cost of Funds
Weighted Marginal Cost of Total Funds It assumes that all assets are financed from a pool of funds and that specific sources of funds are not tied directly to specific uses of funds

231
Funding Sources and Banking Risks
Banks face two fundamental problems in managing liabilities. Uncertainty over: What rates they must pay to retain and attract funds The likelihood that customers will withdraw their money regardless of rates

232
Funding Sources and Banking Risks
Funding Sources: Liquidity Risk The liquidity risk associated with a bank’s deposit base is a function of: The competitive environment Number of depositors Average size of accounts Location of the depositor Specific maturity and rate characteristics of each account

233
Funding Sources and Banking Risks
Funding Sources: Liquidity Risk Interest Elasticity How much can market interest rates change before the bank experiences deposit outflows? If a bank raises its rates, how many new funds will it attract? Depositors often compare rates and move their funds between investment vehicles to earn the highest yields It is important to note the liquidity advantage that stable core deposits provide a bank

234
Funding Sources and Banking Risks
Funding Sources: Interest Rate Risk Many depositors and investors prefer short-term instruments that can be rolled over quickly as interest rates change Banks must offer a substantial premium to induce depositors to lengthen maturities Those banks that choose not to pay this premium will typically have a negative one-year GAP

235
Funding Sources and Banking Risks
Funding Sources: Interest Rate Risk One strategy is to aggressively compete for retail core deposits Individual are not as rate sensitive as corporate depositors and will often maintain their balances through rate cycles as long as the bank provides good service

236
Funding Sources and Banking Risks
Funding Sources: Credit and Capital Risk Changes in the composition and cost of bank funds can indirectly affect a bank’s credit risk by forcing it to reduce asset quality For example, banks that substitute purchased funds for lost demand deposits will often see their cost of funds rise Rather than let their interest margins deteriorate, many banks make riskier loans at higher promised yields While they might maintain their margins in the near-term, later loan losses typically rise with the decline in asset quality

237
Funding the Bank

Similar presentations


: GAP and Earnings Sensitivity>")
