Download presentation
Presentation is loading. Please wait.

1
3.6.20151 PAH-compounds in background air (PM10) and precipitation in Finland Mika Vestenius Air Chemistry Laboratory FMI
 and precipitation in Finland Mika Vestenius Air Chemistry Laboratory FMI")
2
3.6.20152 Talk outline -Why do we measure PAH:s? -PAH-compounds -Sampling -Analysis -Measuring campaign -Results -Conclusions

3
3.6.20153 Polycyclic aromatic hydrocarbons (PAH-compounds) -carcinogenic compounds -ubiquitous -formed during the incomplete combustion of organic matter -emissions from wide range of combustion sources Anthropogenic emissions: diesel and gasoline engines, fossil fuels and biomass burning (energy production), oil refining… Natural emissions include forest fires and volcanic eruptions
 -carcinogenic compounds -ubiquitous -formed during the incomplete combustion of organic matter -emissions from wide range of combustion sources Anthropogenic emissions: diesel and gasoline engines, fossil fuels and biomass burning (energy production), oil refining… Natural emissions include forest fires and volcanic eruptions")
4
3.6.20154 -Directive of the European parliament and the Council (2004/107/EC) requires the member states to measure PAH-compounds in the PM10-fraction in ambient air. -Benzo(a)pyrene (BaP) shall be used as a marker for the carcinogenic risk of PAH-compounds in ambient air and the limit values are set for benzo(a)pyrene ng/m 3 benzo[a]pyrene Treshold value1 Upper assessment treshold0,6 Lower assessment treshold0,4 Table 1: Limit values for benzo(a)pyrene Also benzo(a)anthracene, benzo(b)fluoranthene, benzo(j)fluoranthene, benzo(k)fluoranthene, indeno(1,2,3-cd)pyrene, and dibenzo(a,h)anthracene must be measured. Benzo(a)pyrene
pyrene (BaP) shall be used as a marker for the carcinogenic risk of PAH-compounds in ambient air and the limit values are set for benzo(a)pyrene ng/m 3 benzo[a]pyrene Treshold value1 Upper assessment treshold0,6 Lower assessment treshold0,4 Table 1: Limit values for benzo(a)pyrene Also benzo(a)anthracene, benzo(b)fluoranthene, benzo(j)fluoranthene, benzo(k)fluoranthene, indeno(1,2,3-cd)pyrene, and dibenzo(a,h)anthracene must be measured. Benzo(a)pyrene.")
5
3.6.20155 PAH compounds: from Finlayson-Pitts & Pitts: Chemistry of the upper and lower atmosphere

6
3.6.20156 PAH compounds… from Finlayson-Pitts & Pitts: Chemistry of the upper and lower atmosphere

7
3.6.20157 PAH-compounds analyzed in the FMI: naphtalene acenaphtylene acenaphtene fluorene phenantrene anthracene fluoranthene pyrene benz(a)anthracene chrycene benzo(k,b,j)fluoranthene benzo(a)pyrene Benzo(ghi)perylene indeno(1,2,3-cd)pyrene dibenz(a,h)anthracene Fig. 1: Average mass percent contributions (gas + particle phase of 13 PAH:s collected in urban air from Chicago in Feb/March 1995. (From Harner and Bidleman, 1998)
.")
8
3.6.20158 Sampling locations

9
3.6.20159 Rainwater collection

10
PM10 and precipitation PAH-collectors

11
3.6.201511 SamplingSoxhlet-extraction in 60ml of CH 2 Cl 2, minimum 8 hrs Evaporation into 1 mlAnalysis in GC-MS The procedure

12
3.6.201512 Column: DB-5 (5%Phenyl) methylpolysiloxane (non-polar) 0,250 um x 0,5 mm ID x 50m Analysis
 methylpolysiloxane (non-polar) 0,250 um x 0,5 mm ID x 50m Analysis")
13
ISTD 3.6.201513

14
Sample list 3.6.201514 Sample list Starter sampleblocks active placesS6asample STDF1standardS7asample STDA1standardS8asample STDB1standardS9asample STDC1standardS10asample STDD1standardS6bsample STDE1standardS7bsample X1…3aquality controlS8bsample S1asampleS9bsample S2asampleS10bsample S3asampleSTDF3standard S4asampleSTDA3standard S5asampleSTDB3standard S1bsampleSTDC3standard S2bsampleSTDD3standard S3bsampleSTDE3standard S4bsamplex1…3cquality control S5bsample… STDF2standard STDA2standard STDB2standard STDC2standard STDD2standard STDE2standard X1…3bquality control

15
3.6.201515 Gas-chromatogram (SCAN)
")
16
3.6.201516 Gas-chromatogram (SIM)
")
17
Benzo(a)Pyrene 3.6.201517
Pyrene")
18
LOD:s and LOQ:s LOD = limit of detection LOQ = limit of quantitation MU = measurement uncertainty PM10-fraction LOD (ng/m3) LOQ (ng/m3)MU naphtalene0,0110,0374,6 % acenaphtylene0,0370,12215,9 % acenphtene0,0070,02410,5 % fluorene0,0070,02217,2 % phenantrene0,0210,06944,4 % anthracene0,0010,00425,0 % fluoranthene0,0080,02638,9 % pyrene0,0050,01747,3 % benz(a)anthracene0,0040,01553,7 % chrycene/triphenylene0,0010,00416,7 % benzo(k+b+)fluoranthene0,0050,01613,0 % benzo(a)pyrene0,0180,05937,3 % benzo(ghi)perylene0,0110,03746,2 % indeno(1,2,3-cd)pyrene0,0050,01639,3 % dibenz(a,h+a,c)anthracene0,0070,02332,0 % in precipitation LOQ (ng/l) naphtalene2,06 acenaphtylene6,73 acenphtene1,31 fluorene1,23 phenantrene3,79 anthracene0,21 fluoranthene1,44 pyrene0,91 benz(a)anthracene0,81 chrycene/triphenylene0,23 benzo(k+b+)fluoranthene0,89 benzo(a)pyrene3,24 benzo(ghi)perylene2,03 indeno(1,2,3-cd)pyrene0,89 dibenz(a,h+a,c)anthracene1,29
 LOQ (ng/m3)MU naphtalene0,0110,0374,6 % acenaphtylene0,0370,12215,9 % acenphtene0,0070,02410,5 % fluorene0,0070,02217,2 % phenantrene0,0210,06944,4 % anthracene0,0010,00425,0 % fluoranthene0,0080,02638,9 % pyrene0,0050,01747,3 % benz(a)anthracene0,0040,01553,7 % chrycene/triphenylene0,0010,00416,7 % benzo(k+b+)fluoranthene0,0050,01613,0 % benzo(a)pyrene0,0180,05937,3 % benzo(ghi)perylene0,0110,03746,2 % indeno(1,2,3-cd)pyrene0,0050,01639,3 % dibenz(a,h+a,c)anthracene0,0070,02332,0 % in precipitation LOQ (ng/l) naphtalene2,06 acenaphtylene6,73 acenphtene1,31 fluorene1,23 phenantrene3,79 anthracene0,21 fluoranthene1,44 pyrene0,91 benz(a)anthracene0,81 chrycene/triphenylene0,23 benzo(k+b+)fluoranthene0,89 benzo(a)pyrene3,24 benzo(ghi)perylene2,03 indeno(1,2,3-cd)pyrene0,89 dibenz(a,h+a,c)anthracene1,29")
19
3.6.201519 Total PAH-concentration at Virolahti. PM 10 in 2007 (weekly samples)
")
20
3.6.201520 Benzo(a)pyrene at Virolahti PM10 in year 2007 (weekly samples)
pyrene at Virolahti PM10 in year 2007 (weekly samples)")
21
3.6.201521 Benzo(a)pyrene at Virolahti, some daily PM 10 -samples in 2007
pyrene at Virolahti, some daily PM 10 -samples in 2007")
22
3.6.201522

23
3.6.201523 PAH in precipitation at Kuhmo in 2007-2008

24
3.6.201524 Total PAH -concentrations in precipitation at Pallas, monthly samples in 2006, Data from IVL

25
3.6.2015Kainuun ilmanlaatu seminaari 12.5 200825 ng/l2003 2004 2005 2007 PAH summinmaxminmaxminmaxminmax Evo (SYKE, VTT)664775111963367 Kuhmo, FMI 1591 PAH in precipitation Data from southern Finland EVO, (SYKE/VTT), May-September
 Kuhmo, FMI 1591 PAH in precipitation Data from southern Finland EVO, (SYKE/VTT), May-September")
26
3.6.201526 gradient PM10 ng/m3Total PAHB(a)P spring Kuhmo1,10,12008 Virolahti4,10,32007
P spring Kuhmo1,10,12008 Virolahti4,10,32007")
27
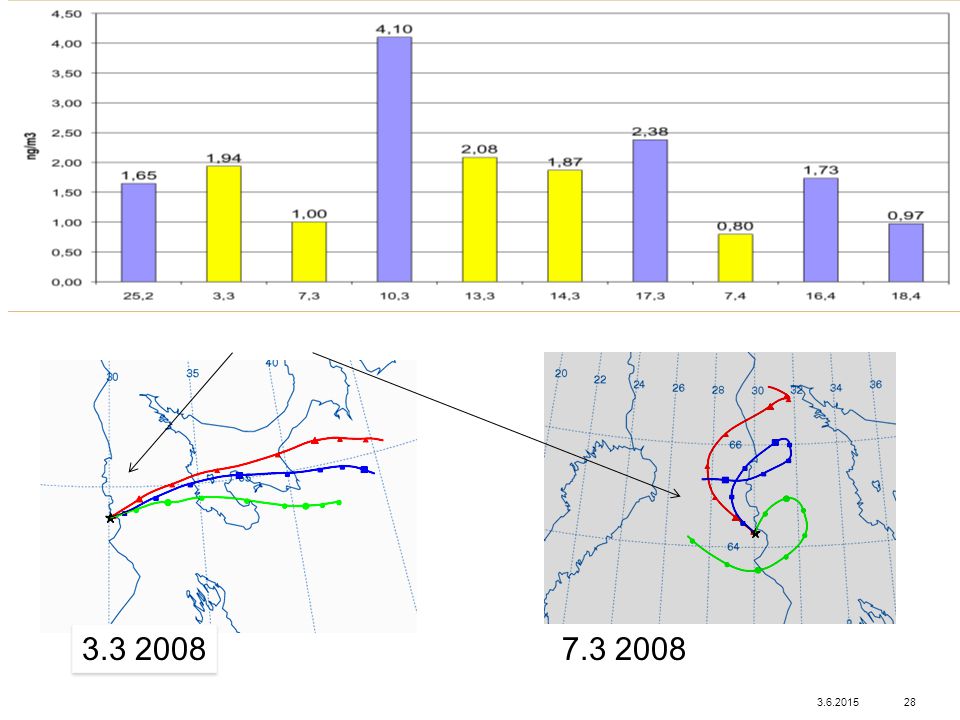
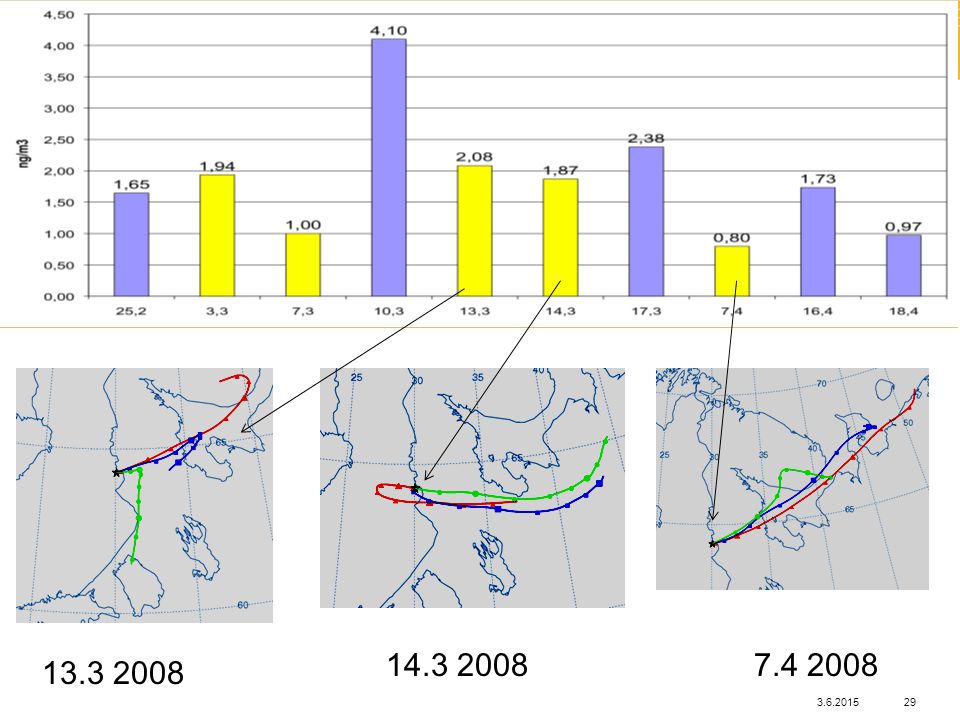
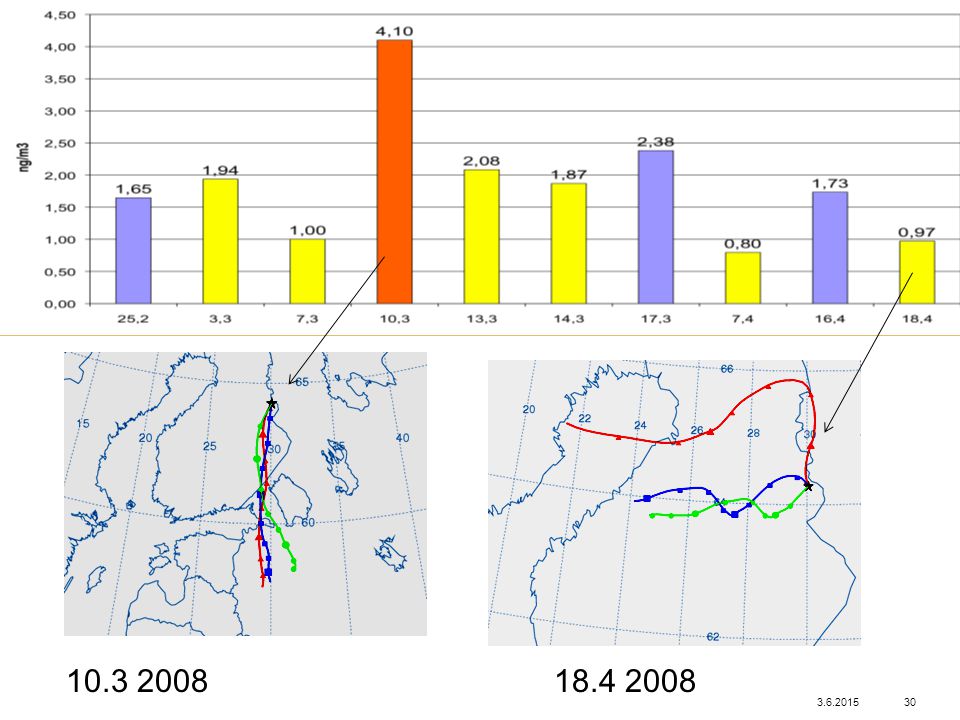
3.6.201527 EXAMPLE: PAH-compounds in PM10- samples at Kuhmo, Selected days in spring 2008

28
3.6.201528 3.3 2008 7.3 2008
29
3.6.201529 13.3 2008 7.4 200814.3 2008
30
3.6.201530 10.3 200818.4 2008
31
3.6.201531 Conclusions: -Traditional analysis takes time and there is a lot of work per sample, (sample preprocessing and analysis, data processing…), but -GC-MS is highly sensitive instrument for PAH-analysis LOQ (B(a)P): 0,06 ng/m3, 0,6 ppt. -Average PAH-concentrations in both rainwater and PM10 are highest in winter, due to heating and shortage of light -In PM10-fraction,mean PAH-concentrations were higher in Virolahti that in Kuhmo. Same thing with Benzo(a)Pyrene in PM10. Concentration gradient -Total PAH in PM10 at Virolahti is 3,2 ng m-3. (yearly average) -Average benzo(a)pyrene concentration in PM10 at Virolahti was 0,25 ng m-3, which is under lower assessment level. -The average yearly PAH-deposition in Kuhmo is 3300 ng m-2, and the average PAH-concentration in PM10-fraction is 1.1 ng m-3. (spring 2008)
Pyrene in PM10. Concentration gradient -Total PAH in PM10 at Virolahti is 3,2 ng m-3. (yearly average) -Average benzo(a)pyrene concentration in PM10 at Virolahti was 0,25 ng m-3, which is under lower assessment level. -The average yearly PAH-deposition in Kuhmo is 3300 ng m-2, and the average PAH-concentration in PM10-fraction is 1.1 ng m-3. (spring 2008).")
32
3.6.201532 -PAH-levels in air and in precipitation are low in Finnish background areas. -PAHs in Kuhmo come from distant sources. Take-home messages: 1. PAH-compounds are emitted to atmosphere from incomplete burning of organic compounds. 2. Offline GC-MS is labour-intensive but higly sensitive detection method for PAH-compounds in air. 3. PAH-compounds distribute to gas and aerosol phases. The distribution between the phases depends on the compounds volatility and mass. PAH-compounds containing 2-3 aromatic rings are mainly in gas phase in air, whereas compounds that have more aromatic rings go to the aerosol phase. 4. PAH-compounds decompose in photochemical reactions, which act as a sink for these compounds. These reactions are slower on the wintertime, when there is less light, compared to summertime when there is lots of light. On wintertime there is also more emissions due heating. That is why average PAH-concentrations in both PM10 and precipitation in Finland are highest on winter.

33
3.6.201533 THANK YOU! Thank you!

Similar presentations


 In combustion, a substance reacts rapidly with oxygen and releases energy. The energy may be.>")


 Environment.>")


 to coastal ocean Chon-Lin Lee 1 *, Bing-Sian Lin 1, and.>")


