Download presentation
Presentation is loading. Please wait.

1
California’s Experience: Air Quality Successes and Challenges Bart Croes, P.E. Chief, Air Quality Data Branch California Air Resources Board (CARB) April 11, 2000 Air Resources Board California Environmental Protection Agency
 April 11, 2000 Air Resources Board California Environmental Protection Agency.")
5
Lead, SO 2, and NO 2 Air Quality in Los Angeles 3-Year Means Assigned to Last Year

6
(PM 10 =1988-98, Air Toxics=1991-96, GSP=1980-96) Change in Air Quality and Growth 1980 to 1998
 Change in Air Quality and Growth 1980 to 1998")
7
Los Angeles - NOx Emission Trends Emissions Goal Emissions Today

8
Los Angeles - ROG Emission Trends Emissions Today Emissions Goal

9
CARB Mobile Source and Fuels Regulations and Programs New engine emission standards New engine emission standards In-use durability requirements In-use durability requirements Retrofit existing engines Retrofit existing engines Cleaner fuels: gasoline, diesel, natural gas Cleaner fuels: gasoline, diesel, natural gas Promote national and international standards for trucks, ships, and aircraft Promote national and international standards for trucks, ships, and aircraft New technologies for the future New technologies for the future

10
CARB Emission Standards for Cars ROG NOx Exhaust g/mile Over 99% Reduction from Uncontrolled

11
Battery Electric Vehicles

12
California Fuel Cell Partnership

13
CARB NOx Emission Standards for On-Road Trucks 0 2 4 6 8 10 12 g/hp-hr 1990 1991 1998 2004 1985 Possible Future Standards NOx aftertreatment-based 75-90% reduction 2007 goal

14
CARB PM Emission Standards For On-Road Trucks 0 0.1 0.2 0.3 0.4 0.5 0.6 0.7 g/hp-hr 1988 1991 1994 truck bus Possible Future Standards PM trap-based ~90% Reduction 2007 goal

15
Diesel PM and NOx Controls Cleaner diesel fuel Cleaner diesel fuel Very low sulfur enables after-treatment Exhaust after-treatment Exhaust after-treatment PM traps > 90% efficient NOx catalysts 50-90% efficiency potential Alternative fuels: natural gas Alternative fuels: natural gas New technologies: fuel cells New technologies: fuel cells

16
Cleaner Alternative-Fuel Trucks

17
Fuel Cell Bus

18
CARB Cleaner Fuels Program 1992: Eliminated lead from gasoline, limited vapor pressure, required oxygenates in winter to reduce carbon monoxide 1992: Eliminated lead from gasoline, limited vapor pressure, required oxygenates in winter to reduce carbon monoxide 1996: Introduced “cleaner-burning gasoline” to achieve maximum reductions in ozone and toxics 1996: Introduced “cleaner-burning gasoline” to achieve maximum reductions in ozone and toxics 1999: Phase out MTBE by 2002, reduce sulfur and benzene further 1999: Phase out MTBE by 2002, reduce sulfur and benzene further

19
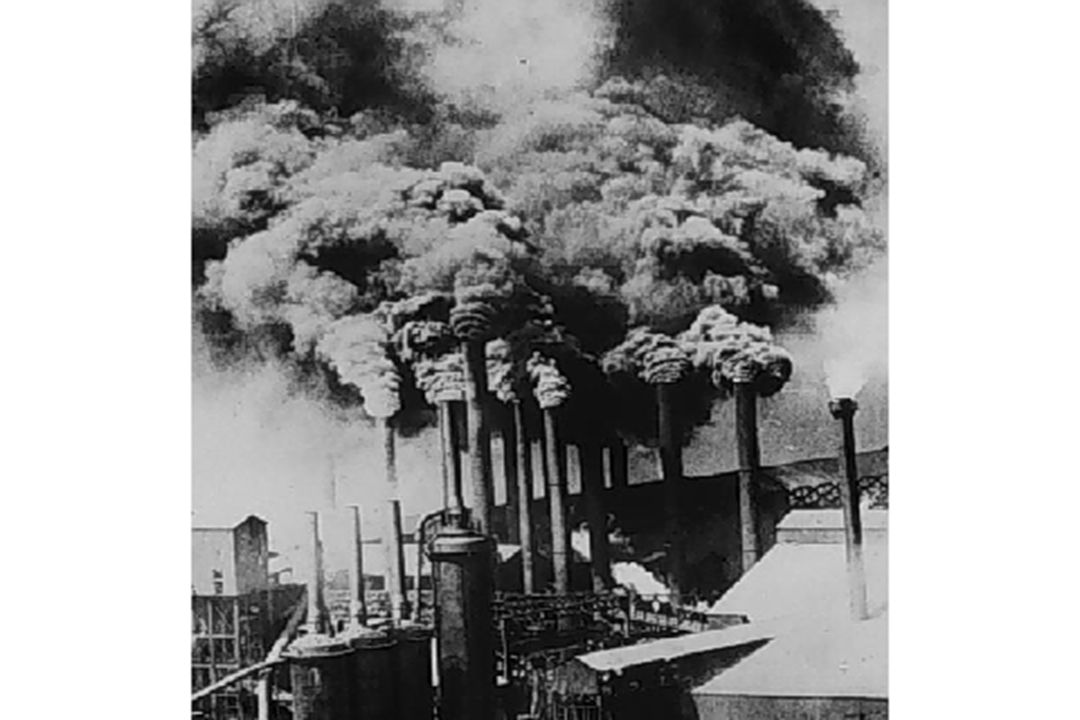
Cleaner Industrial Sources Best controls on new and existing sources Best controls on new and existing sources Controls for NOx, ROG, SOx, CO, toxics Controls for NOx, ROG, SOx, CO, toxics Diesel particulate matter controls to reduce toxics risk Diesel particulate matter controls to reduce toxics risk

20
Our Goal Is Clean Air Everyday

21
California Air Monitoring Sites

22
California ROG Emissions With Existing Programs Stationary Source 36% Other Mobile 2% 19902010 Gasoline 50% Diesel 12% Stationary Source 61% Other Mobile 9% Gasoline 17% Diesel 14% 3630 TPD 2390 TPD

23
California NOx Emissions With Existing Programs Stationary Source 22% Other Mobile 7% 1990 2010 Gasoline 37% Diesel 33% Stationary Source 23% Other Mobile 8% Gasoline 24% Diesel 45% 3490 TPD 2800 TPD

24
Motor Vehicle Control Programs HC NOx CO HCHO Evap Model Year(g/mile)(g/mile)(g/mile)(g/mile)(g/test) Pre-Control 10.6 4.1 84 47 1966 6.3 51 1970 4.1 34 6 1971 4.1 4 34 6 1972 2.9 3 34 2 1974 2.9 2 34 2 1975 0.9 2 9 2 1977 0.41 1.5 9 2 1978 0.41 1.5 9 6 1980 0.39 1.0 9 2 1981 0.39 0.7 7 2 1983 0.39 0.4 7 2 1993 0.250 0.4 3.4 2 TLEV (Transitional) 0.125 0.4 3.4 0.015 2 LEV (Low) 0.075 0.2 3.4 0.015 2 ULEV (Ultra Low) 0.040 0.2 1.7 0.008 2 ZEV (Zero) 0.000 0.0 0.0 0.000 2
(g/mile)(g/mile)(g/mile)(g/test) Pre-Control TLEV (Transitional) LEV (Low) ULEV (Ultra Low) ZEV (Zero)")
25
Motor Vehicle Fuel Programs Year AdoptedGasolineDieselAlternative Fuels 1971Reid Vapor Pressure Bromine Number 1975Sulfur Manganese/Phosphorus 1976Lead 1981Sulfur (SoCAB) 1982Lead 1988Sulfur/Arom. HC 1990Phase 1 Reformulated 1991Wintertime Oxygenated Phase 2 Reformulated 1992Commercial and Certification Spec. 1994Phase 2 Predictive Model

26
Status of California Air Quality Attainment (or Close) Attainment (or Close) Lead Sulfates NO 2, carbon monoxide Nonattainment Nonattainment PM (30% reduction achieved) Ozone (50% reduction) Toxics (40-70% reduction)
 Attainment (or Close) Lead Sulfates NO 2, carbon monoxide Nonattainment Nonattainment PM (30% reduction achieved) Ozone (50% reduction) Toxics (40-70% reduction)")
27
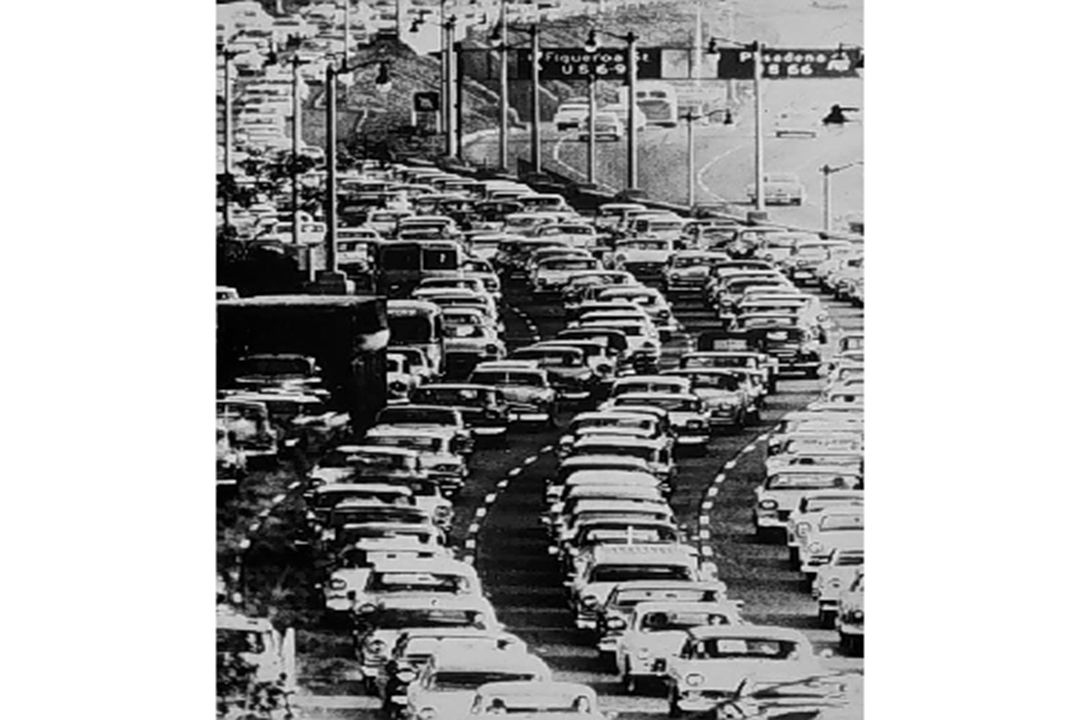
Peak 8-Hour CO, Population, and Vehicle Miles Traveled (VMT)
")
28
Peak Ozone, Population, and Vehicle Miles Traveled (VMT)
")
29
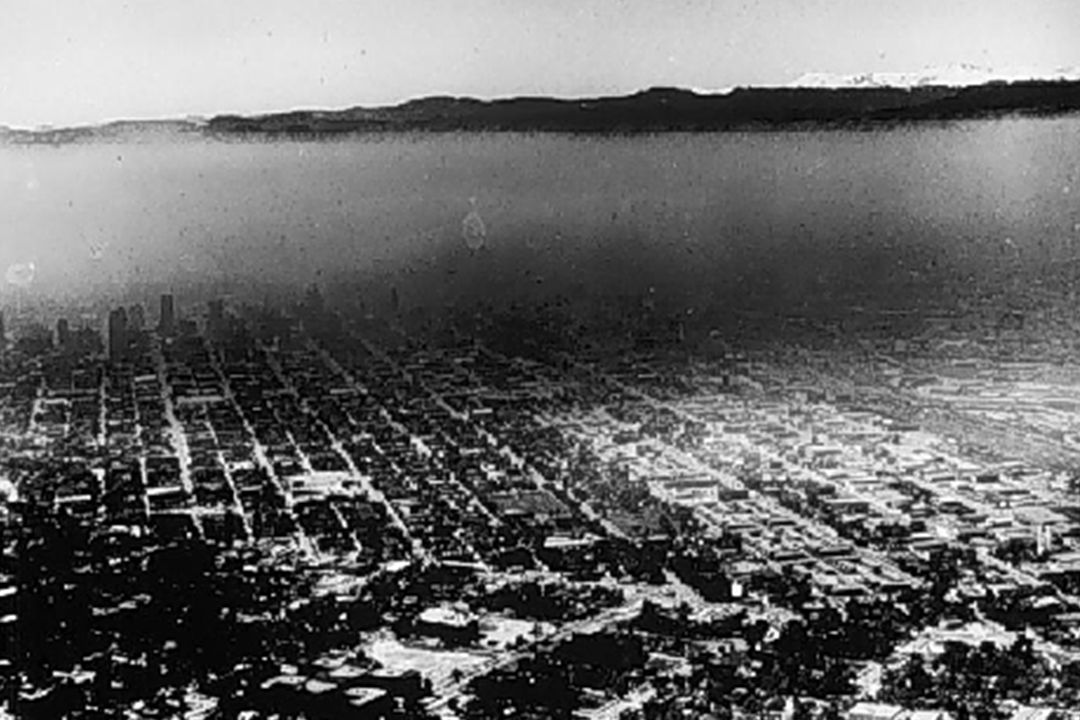
Ozone Air Quality In Los Angeles State Standard National Standard

30
Ozone Exceedance Days In Los Angeles

31
Ozone Episode Days In Los Angeles

32
Ozone Exposure In Los Angeles Year 2000 Goal

33
Days Above 24-Hr PM10 Standard In San Francisco

34
Annual Geometric Mean PM10 In San Francisco State Standard

Similar presentations


 Oakland, CA, October.>")


