Download presentation
Presentation is loading. Please wait.

1
Understanding Urban Pollution and the Role of Diesel Exhaust: Emission Sources Bart E. Croes Chief of the Research Division California Air Resources Board Presentation to: Centre for Science and the Environment New Delhi, India November 2000

2
Presentation Outline u I.Background u II.Inventory Examples Mobile - diesel NO X & PM Area - dust Point - power plant u III.California’s Experience u IV. Reconciliation

3
India’s Pollution Potential u Second largest population in world u Although 26% of population lives in cities, India has more than 30 cities with population greater than 1 million u Tenth largest economy in world

4
Example of India’s Growth u NO X emissions expected to double during each of the next 2 decades u India’s NO X emissions projected to increase from 18% of Asiatic total in 1995 to 26% of total in 2020 u This large increase despite rapid growth throughout Asia

5
Example of India’s Sources u Transportation sector expected to account for 58% of NOX emissions in 2020; 90% of this from diesel u Second largest category, LPS, will account for 19% of 2020 inventory

6
Clean Air Air Quality Monitoring Emission Inventory Air Quality Modeling ControlStrategy Building an Air Quality Plan

7
Emission Inventory “Is a comprehensive listing of the sources of air pollution and an estimate of their emissions within a specific geographic area for a specific time interval.”

8
Critical Steps and Uses of an Emission Inventory include: u Identifying pollutants of concern u Identifying sources of pollution u Characterizing emissions u Identifying control strategies

9
Types of Inventories u Annual average u Seasonal inventories u Forecasted - future estimates u Gridded / Modeling

10
Criteria Pollutants: TOG- total organic gases ROG- reactive organic gases CO- carbon monoxide NO x - oxides of nitrogen SO x - oxides of sulfur PM 10 - PM < 10 microns PM 2.5 - PM < 2.5 microns

11
Pollutants: Toxics u Diesel PM u Benzene u 1,3 Butadiene u Formaldehyde u Hexavalent chrome u Perchloroethlyene (PERC) u Lead
 u Lead")
12
Stationary Sources u Refineries u Manufacturing u Food processing u Electric utilities u Chemical production

13
Area-Wide Sources u Farming u Paved & unpaved road dust u Solvents u Consumer products u Open burning

14
Mobile Sources u Cars u Trucks u Buses u Aircraft u Trains u Ships

15
Non- anthropogenic u Wild fires u Biogenics u Windblown Dust

16
How to Develop Emission Inventories

17
Developing Emission Inventories u Planning for inventory development u Data collection u Data management and reporting

18
Selection of Methods u Intended use of inventory u Availability of data u Practicality of method u Priority of category u Time/Resources

19
Methodologies u Top down approach u Continuous emission monitors u Source testing u Material balance u Emission factors u Fuel analysis u Surveys u Engineering judgement

20
Estimation Models u BEIS (biogenics) u Landfill Gas Emission Model u TANKS (storage tanks) u MECH (PM emissions form road, ag.) u PM Calc (PM 2.5 emissions) u MOBILE6 / EMFAC2000 u OFFROAD Model
 u Landfill Gas Emission Model u TANKS (storage tanks) u MECH (PM emissions form road, ag.) u PM Calc (PM 2.5 emissions) u MOBILE6 / EMFAC2000 u OFFROAD Model")
21
Where to Find Information u Emission Inventory Improvement Program (EIIP) 10 volumes of methods u California Air Resources Board Area Source Manual Speciation Manuals CATEF toxic emission factors u U. S. EPA CHIEF clearinghouse Fire Database (toxic factors)
.")
22
Calculate Emissions Process Rate Activity (Activity) Number of Units Units Emission Factor x Emissions per Unit per Unit x Emissions= Total Emissions=
 Number of Units Units Emission Factor x Emissions per Unit per Unit x Emissions= Total Emissions=")
23
Data Collection u Activity data u Emission factors u Facility information u Spatial and temporal u Speciation

24
Data Quality Objectives u Accuracy / uncertainty u Completeness u Representativeness u Comparability u Consistency u Reasonableness

25
Documentation u Methods used u Sources of data u Assumptions u Calculations u Communication

26
Data Reporting u Annual average u Seasonal u Forecasted u Gridded / modeling

27
Mobile, Area, and Point Sources u Mobile - Cars, trucks, tractors u Area - Dust from land preparation, windblown dust, unpaved road dust, pumps u Point - Processing facilities

28
How to Examples u Mobile - diesel u Area - agriculture u Point - power plant

29
Emissions Inventory Development u Basic Equation Pop*Activity*Emissions = tons/day u Number of Sources (vehicle population) u Activity (miles or kilometer per vehicle) u Emission Rate (grams per mi. or km.)
.")
30
Vehicle Population (Source: Department of Land Transport)
")
31
Vehicle Activity (Miles per Vehicle per Day - Source: Mobile5)
")
32
Emission Factors (Source: Mobile5) (Zero Mile or Intercept) Deterioration Rate Increase in Emissions As a Function of Usage
 (Zero Mile or Intercept) Deterioration Rate Increase in Emissions As a Function of Usage")
33
1998 Oxides of Nitrogen Emissions (Gasoline Powered Vehicles - 119.7 TPD)
")
34
1998 Particulate Emissions (Gasoline Powered Vehicles - 19.39 TPD)
")
35
1998 Oxides of Nitrogen Emissions (Diesel Powered Vehicles - 74.99 TPD)
")
36
1998 - NO X Emissions NO X Emissions = 107,500 tons/day

37
1998 - PM10 Emissions PM10 Emissions = 58,200 tons/day

38
How to Examples u Mobile - diesel u Area - agriculture u Point - power plant

39
Overview of Estimation Methodology u Emission Factor (EF) Emissions per unit of activity (i.e., lbs/PM 10 per acre tilled) u Activity Data (Process Rate, PR) Vehicle Miles Traveled, Acre-Passes u Emissions Emissions = EF x PR
 Emissions per unit of activity (i.e., lbs/PM 10 per acre tilled) u Activity Data (Process Rate, PR) Vehicle Miles Traveled, Acre-Passes u Emissions Emissions = EF x PR")
40
Inventoried Agricultural Emission Sources u Field & orchard operations (dust) land preparation & some harvesting u Windblown dust fields and unpaved roads u Unpaved roads & unpaved areas u Farm equipment exhaust mobile & stationary
 land preparation & some harvesting u Windblown dust fields and unpaved roads u Unpaved roads & unpaved areas u Farm equipment exhaust mobile & stationary")
41
Inventoried Agricultural Emission Sources (continued) u Open burning prunings, residue, weeds u Industrial point sources Processing Cotton processing and handling Packing u Pesticides
 u Open burning prunings, residue, weeds u Industrial point sources Processing Cotton processing and handling Packing u Pesticides")
42
Agricultural Emissions Summary Emissions data from 1996 emissions inventory.

43
Monthly SJV PM 10 Emissions

44
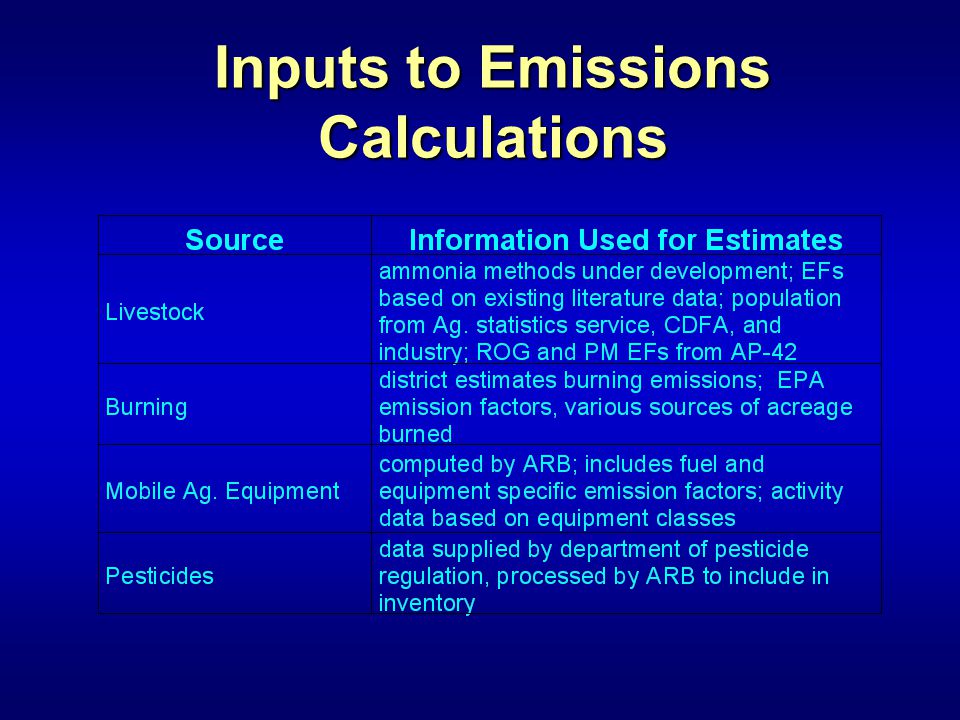
Inputs to Emissions Calculations

46
Current Inventory Shortcomings u Cultivation practices not included u Most harvest activities not included u Land preparation estimates not activity specific (e.g., discing, planing) u Unpaved road dust estimates generic u Unpaved staging and parking areas not included
 u Unpaved road dust estimates generic u Unpaved staging and parking areas not included")
47
Current Inventory Shortcomings (continued) u Soil conservation practices not included u Effects of dust deposition not included u Ammonia sources not included u Biogenics not included
 u Soil conservation practices not included u Effects of dust deposition not included u Ammonia sources not included u Biogenics not included")
48
Quantifying Emission Estimates for Alternate Practices u Effects on activity data acre-passes vehicle miles traveled u Effects on emission factors natural gas vs diesel mulching vs burning equipment differences moist vs dry soil u Control effectiveness & penetration

49
Issues for Incorporating Alternative Practices u Seasonal exceedances Do changes help when air quality is poor? u Location specific exceedances Are the changes in a region with poor air quality? u Benefit from baseline emissions Do the changes produce a reduction from baseline estimates?

50
Control Options u Find ways to reduce Emission Factor soil or unpaved road stabilization limit activities under high emitting conditions (such as high winds) control equipment, cleaner engines, cleaner fuels cleaner equipment, etc. u Reduce Activity Data minimize unpaved road travel minimize land preparation passes perform activities when less air impacts

51
Controls u Water or soil stabilization u Less emissive practices crop residue erosion controls u Dust track-out controls u Seasonal selective controls u Electric pumps u Deposition on crops (removal mechanisms) u etc.
 u etc.")
52
Incorporating Controls to Emission Estimates u Rules u Enforceability & compliance u Voluntary measures u Availability of inputs to evaluate control effectiveness

53
How to Examples u Mobile - diesel u Area - agriculture u Point - power plant

54
Overview of SO 2 Estimation u Basic Equation Activity*Mass Fraction*2 = SO 2 /day u Activity (tons fuel burned per day) u Mass Fraction (tons S per ton fuel) u 2 = 64/32 = MW SO2 /MW S
 u Mass Fraction (tons S per ton fuel) u 2 = 64/32 = MW SO2 /MW S")
55
Overview of NO X Estimation u Emission Factor (EF) Emissions per unit of activity (i.e., lbs of NOper ft 3 of fuel burned) Emissions per unit of activity (i.e., lbs of NO X per ft 3 of fuel burned) u Activity Data (AD) cubic feet of fuel burned u Emissions Emissions = EF x AD
 Emissions per unit of activity (i.e., lbs of NOper ft 3 of fuel burned) Emissions per unit of activity (i.e., lbs of NO X per ft 3 of fuel burned) u Activity Data (AD) cubic feet of fuel burned u Emissions Emissions = EF x AD")
56
Complexities Involved in Developing an Emissions Inventory

57
Emissions u Actual –Measured or estimated emissions which most accurately represent the emissions from an emissions unit. For example: The actual rate of emissions is defined in tons per year of any regulated pollutant emitted from a major source over the preceding two years. Actual emissions shall be calculated using the unit's actual operating hours, production rates,and types of materials processed, stored, or combusted during the preceding calendar year or other defined period. For a new emission unit, actual emissions equal the potential to emit of the unit. u Allowable Permitted emissions levels. Actual should not exceed allowable emissions. u Potential The maximum physical and operational design capacity to emit a pollutant. Limitations on the physical or operational design capacity, including emissions control devices and limitations on hours of operation, may be considered only if such limitations are incorporated into the applicable Authority to Construct and Permit to Operate. EPA Part 70 regulations define potential to emit as the "maximum capacity of a stationary source to emit any air pollutant under its physical and operational design." In general, this definition means that emissions from a source must be estimated at maximum capacity over 365 days per year.

58
Growth Factors u What are growth factors? Factors based on specific economic profiles for certain industry types or based on demographic data

59
Control Factors u What are control factors? Control factors are derived from rules and regulations which impose emission reductions or a technological change on a particular emission process.

60
Effectiveness and Durability of Emission Controls u Motor Vehicle catalyst, vapor recovery, OBD, clean fuels u Stationary Sources scrubbers, cyclones, electrostatic precipitators, bag houses

61
PM 10 Inventoried Sources South Coast Air Basin, 1996 Source: ARB 1996 Statewide Inventory 440 tons/day

62
PM 2.5 Estimates - What’s Missing? (for starters...) u PM 2.5 emissions not based on PM 2.5 emission factors u Activity data for many categories is incomplete and outdated u Limited spatial/temporal resolution u Current inventory is missing important components elemental carbon (soot) organic carbon (organic combustion particles) semi-volatile organics (partition gas/particle) ammonia
 u PM 2.5 emissions not based on PM 2.5 emission factors u Activity data for many categories is incomplete and outdated u Limited spatial/temporal resolution u Current inventory is missing important components elemental carbon (soot) organic carbon (organic combustion particles) semi-volatile organics (partition gas/particle) ammonia.")
63
PM 2.5 Emission Estimates u PM 2.5 inventory issues very different from PM 10 inventory u Ambient PM 2.5 includes substantial secondary particulate levels Some precursors are inventoried, but... Secondary PM is NOT part of inventory u Need spatial & temporal resolution

64
PM 2.5 Inventory and Secondary PM u Secondary PM can be an overwhelming contributor to PM 2.5 exceedances u The emissions inventory cannot provide secondary PM emissions u Precursor inventories and atmospheric modeling are required to obtain secondary PM estimates u Control strategy development requires estimates of secondary PM

65
Inventoried PM 2.5 Emission Sources u Directly emitted pollutants only geologic vegetative burning mobile sources some precursors l NO X l SO X l total organic gases

66
PM 2.5 Inventoried Sources (directly emitted, preliminary estimates) Source: ARB 1995 Statewide Inventory with updated 8/98 size speciation 830 tons/day
 Source: ARB 1995 Statewide Inventory with updated 8/98 size speciation 830 tons/day")
67
2100 tons/day PM 10 vs PM 2.5 Statewide Emission Inventories PM 10 PM 2.5 830 tons/day Source: ARB 1995 Inventory with updated 8/98 size speciation PM 10 and PM 2.5 sources differ substantially PM 2.5 emissions based on scaled PM 10 emissions

68
Emissions Inventory Ambient Species (CMB analysis - all species) Slices with lines are secondary PM Does not include secondary PM Rubidoux, 1997 AQMP, App. V, SCAQMD Direct & Secondary PM 2.5 Inventory vs Ambient Air for SCAQMD

69
What is in the Air? u Secondary compounds sometimes significant u Extremely variable By season By location By day San Joaquin Valley PM 2.5 (hypothetical winter day) From ammonia and combustion exhaust primary, direct emissions secondaryemissions
 From ammonia and combustion exhaust primary, direct emissions secondaryemissions.")
70
California’s Experience

71
Success in Clean Air u Due to stringent control program u Must account for growth u Stationary Controls control of industrial sources consumer products, paints u Mobile Controls engine standards retrofit existing engines clean fuels

72
CARB Mobile Source and Fuels Regulations and Programs u New engine emission standards u In-use durability requirements u Retrofit existing engines u Cleaner fuels: gasoline, diesel, natural gas u Promote national and international standards for trucks, ships, and aircraft u New technologies for the future

73
Diesel PM and NOx Controls u Cleaner diesel fuel Very low sulfur enables after-treatment u Exhaust after-treatment PM traps > 90% efficient NOx catalysts 50-90% efficiency potential u Alternative fuels: natural gas u New technologies: fuel cells

74
CARB NOx Emission Standards for On-Road Trucks 0 2 4 6 8 10 12 g/hp-hr 1990 1991 1998 2004 1985 Possible Future Standards NOx aftertreatment-based 75-90% reduction 2007 goal

75
CARB PM Emission Standards For On-Road Trucks 0 0.1 0.2 0.3 0.4 0.5 0.6 0.7 g/hp-hr 1988 1991 1994 truck bus Possible Future Standards PM trap-based ~90% Reduction 2007 goal

76
CARB Cleaner Fuels Program u 1992: Eliminated lead from gasoline, limited vapor pressure, required oxygenates in winter to reduce carbon monoxide u 1996: Introduced “cleaner-burning gasoline” to achieve maximum reductions in ozone and toxics u 1999: Phase out MTBE by 2002, reduce sulfur and benzene further

77
Cleaner Industrial Sources u Best controls on new and existing sources u Controls for NOx, ROG, SOx, CO, toxics u Diesel particulate matter controls to reduce toxics risk

78
Cleaner Consumer Products u CARB has set ROG emission limits for nearly 50 categories of consumer products and 35 categories of aerosol paints and coating products. u CARB regulations will reduce emissions by 53 tons per day in Los Angeles

79
Air Quality Improvement versus Growth

80
Relative Toxics Risk for Diesel PM Based on CARB’s 1995-1997 ambient monitoring data and estimated diesel PM concentrations Benzene 1,3-Butadiene Chrome VI Carbon Tetrachloride Formaldehyde para-Dichlorobenzene Perchloroethylene Acetaldehyde All Others Diesel PM Contribution to Statewide Cancer Risk

81
Lessons Learned u Need for regulatory framework u Inventories take time and resources u Inventory development is a continuous and iterative process u Reduced emission means improved air quality

82
NO x Inventoried Sources South Coast Air Basin, 1996 1100 tons/day Source: ARB 1996 Statewide Inventory

83
ROG Inventoried Sources South Coast Air Basin, 1996 1100 tons/day Source: ARB 1996 Statewide Inventory

84
Southern California NO x, ROG, PM 10 NO x ROG PM 10 Source: 1999 California Almanac of Emissions & Air Quality, ARB

85
Southern California Trends NO x, ROG, PM 10 NO x ROG PM 10 Source: 1999 California Almanac of Emissions & Air Quality, ARB

86
Emission trends NO x Source: 1999 California Almanac of Emissions & Air Quality, ARB

87
Emission trends ROG Source: 1999 California Almanac of Emissions & Air Quality, ARB

88
Emission trends PM 10 Source: 1999 California Almanac of Emissions & Air Quality, ARB

89
RECONCILIATION

Similar presentations


 April.>")


