Download presentation
Presentation is loading. Please wait.

1
Oil The economics of oil. Oil consumption. Oil production.
Oil politics. Arctic coastal plain

2
Think Big 1. Oil economics Oil is not a luxury, it is a necessity.
Oil is not democratic; not everyone has it. When dealing with issues about oil, you must Think Big

3
The 2002 Fortune 500 - Global Company Revenues ($ millions)
Wal-Mart Stores General merchandiser 219,812 Exxon Mobil Petroleum refining 191,581 General Motors Motor vehicles & parts 177,260 BP Petroleum refining ,218 Ford Motor Motor vehicles & parts 162,412 Enron Energy ,718 DaimlerChrysler Motor vehicles & parts 136,897 Royal Dutch/Shell Group Petroleum refining 135,211 General Electric Diversified Financials 125,913 Toyota Motor Motor vehicles & parts 120,814

4
Global Oil Products Diesel fuel: _____ % of crude oil.
Gasoline: _____ % of crude oil. Percentage of petroleum products: Heating - _____%. Engine grease - _____%. Jet fuel - _____%.

5
Oil Products Alcohol and methylated spirits.
Aspirin and other drugs, ointments, anesthetics, and medicinal products. Bitumen for sealing road surfaces. Cosmetics. Dyes. Explosives. Food additives. Fertilizers. Hydrogen. Industrial fuels (for power plants, factories and ships). Insecticides. Detergents and solvents.
. Insecticides. Detergents and solvents.")
6
Oil Products Synthetics like nylon fibers, rubber, and glass.
Toothpaste. Turpentine. Wax and polish. Some plastics. Kerosene for heating and lighting. Lubricants (for everything from scientific products to aircraft). Liquefied Petroleum Gas (LPG) for heating, cooking, and some cars. Oil-based paint. Resin.
. Liquefied Petroleum Gas (LPG) for heating, cooking, and some cars. Oil-based paint. Resin.")
7
2. Oil Consumption 2001: global oil demand was at _____ million barrels per day. (demand is approx. a function of population and level of development) Seven countries accounted for ____% of the global oil demand: United States, Japan, China, Germany, Russia, Italy and France.
 Seven countries accounted for ____% of the global oil demand: United States, Japan, China, Germany, Russia, Italy and France.")
8
Oil consumption by sector (by 2000)
")
9
World Oil Demand (1000 barrels per day)
")
10
Oil consumption by region

11
World Oil Consumption, 1980-2000
Source: US Energy Information Agency, International Energy Annual Report. The world oil consumption has increased by a factor of 6 since In 2000, the global oil demand was at 76 million barrels per day. The above graph indicates the regional distribution of this demand. A significant share of the demand in developing countries is assumed by Pacific Asian nations. By themselves, G7 countries consume 48% of the global oil production.

12
World Oil Consumption, 2001 (in 1,000 of barrels per day)
Source: US Energy Information Agency, International Energy Annual Report 1999. In 2001, the global oil demand was at 77 million barrels per day. Oil demand is roughly a function of population and level of development. Seven countries, the United States, Japan, China, Germany, Russia, Italy and France, accounted for 52% of the global oil demand.

13
World’s largest oil consumers (1999)
Country Million barrels/day % world total U.S.A Japan China Soviet Union World’s largest oil importers (1999): USA % of world total Japan - 9.1% of world total
: USA % of world total. Japan - 9.1% of world total.")
14
Canada consumes ~ 1,665,000 barrels of oil per day

15
Annual production of cars

16
World total of cars

17
Consumption of resources
US military uses _____% of total US energy. Worldwide: _____ of all jet fuel is used by military aircraft. F-16: one hour flight uses ____ fuel used by average American motorist in one year.

18
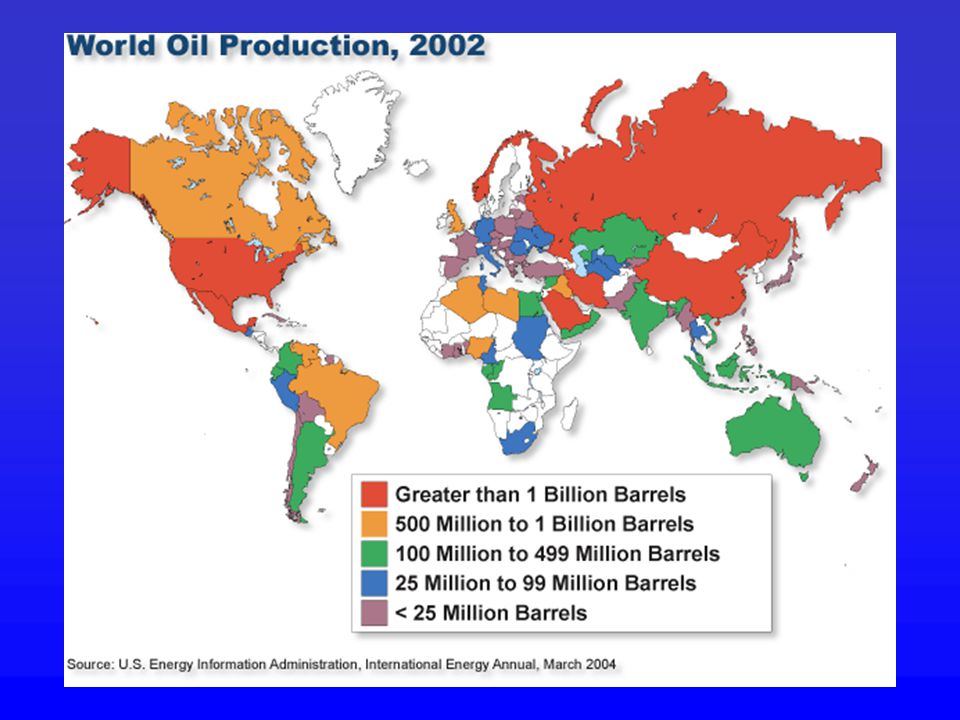
3. Oil Production In 2000, global oil production was at _____ million barrels per day. Oil production is marginal or non-existent in a many countries, most notably in Africa. Eight producers accounted for _____% of the global production: Saudi Arabia, the United States, Russia, Iran, China, Venezuela, Mexico and Norway.

19
World Crude Oil Production, 1980-2000
In 2000, the global oil production was at 68 million barrels per day. The above graph indicates the regional origin of this production. The Middle East is clearly the main supplier, but its share has seen important fluctuations since the beginning of the 1980s.

21
World oil reserves – by region

22
World oil reserves – by country

23
Major Crude Oil Reserves, 2001
Source: US Energy Information Agency, International Energy Annual Report. The geographical imbalance in oil reserves is similar to the one of production. On a long-term perspective, the control of OPEC will emerge again since the bulk of oil reserves is located within its jurisdiction. Saudi Arabia alone has about 25% of all the world's oil reserves. Furthermore, it will take a long time, at the current consumption level, for OPEC to run out of oil. It will take almost a century for the countries having the most important oil reserves in the world to run out (84 years for Saudi Arabia, 97 years for Iraq, 113 years for the United Arab Emirates and 127 years for Kuwait). The United States and Canada, in spite of important reserves, have only 10 years of oil reserves considering their reserve-to-production ratio. No European country, except Norway with 8 years left of production, has major oil reserves. It is thus likely that reliance on sources outside developed countries will increase over the next decade.
. The United States and Canada, in spite of important reserves, have only 10 years of oil reserves considering their reserve-to-production ratio. No European country, except Norway with 8 years left of production, has major oil reserves. It is thus likely that reliance on sources outside developed countries will increase over the next decade.")
24
4. Oil politics Oil cannot be discussed without reference to the politics of oil. Since oil is a fundamental characteristic of every economy in the world, and large reserves of oil are found in very few countries, this imbalance puts a great deal of power into the hands of a very small number of people.

25
World’s largest oil reserves
Country Barrels (Billions) % world total 261.5 112.5 97.8 96.5 93.0 71.7 65.4 Top five countries account for 63.7% of global oil reserves.
 % world total Top five countries account for 63.7% of global oil reserves.")
26
Most of the world’s oil is located in one region: the Middle East.

29
World’s top oil producers (1999)
Country Million barrels/day % world total 9.35 8.46 7.22 6.15

33
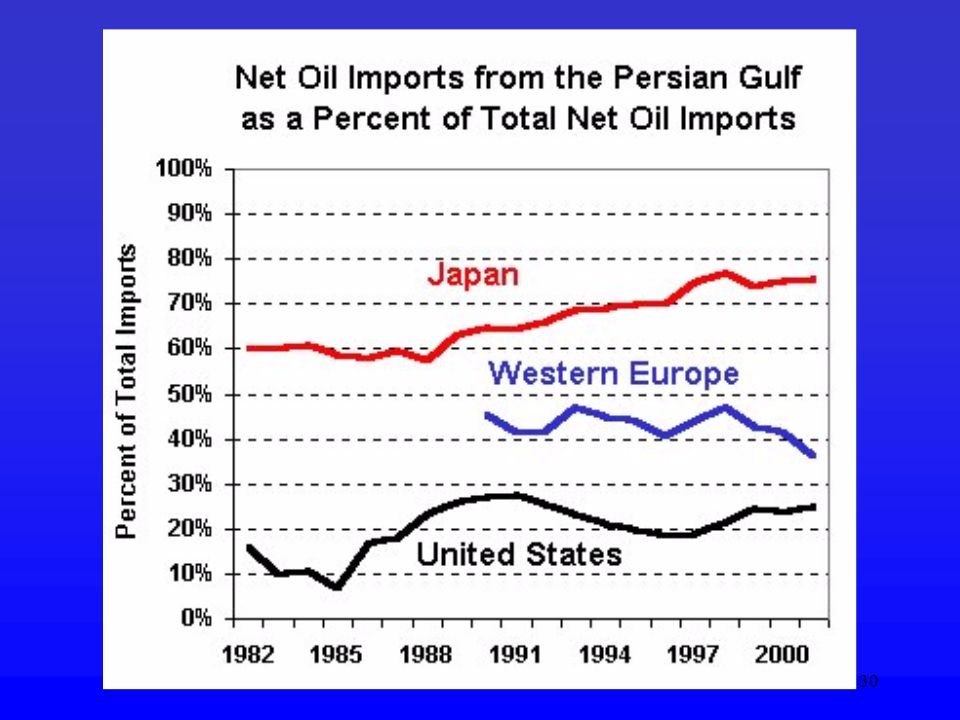
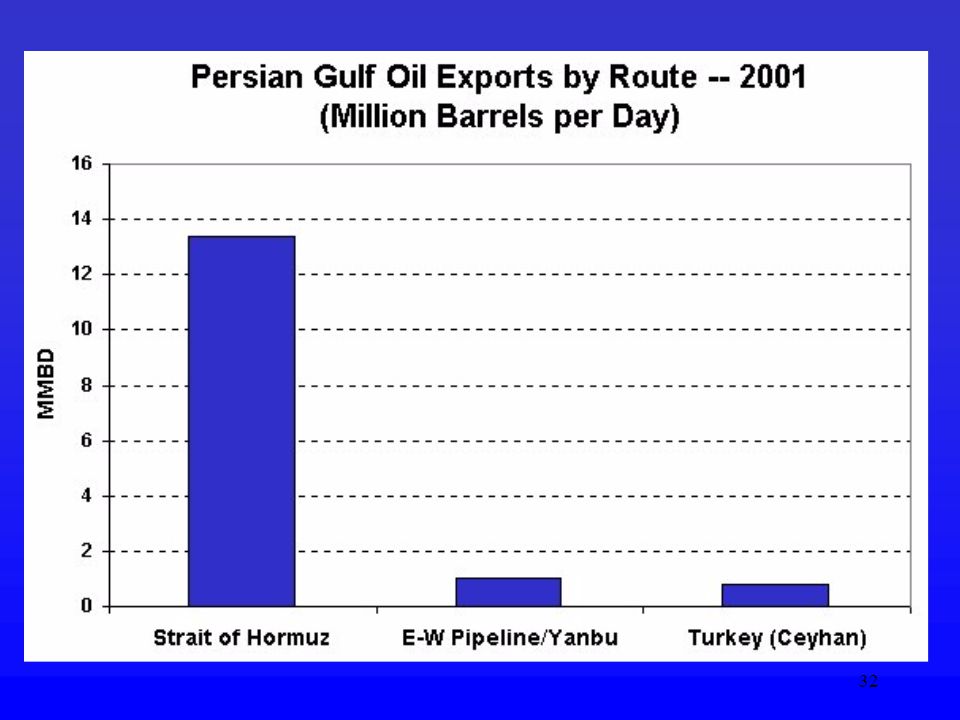
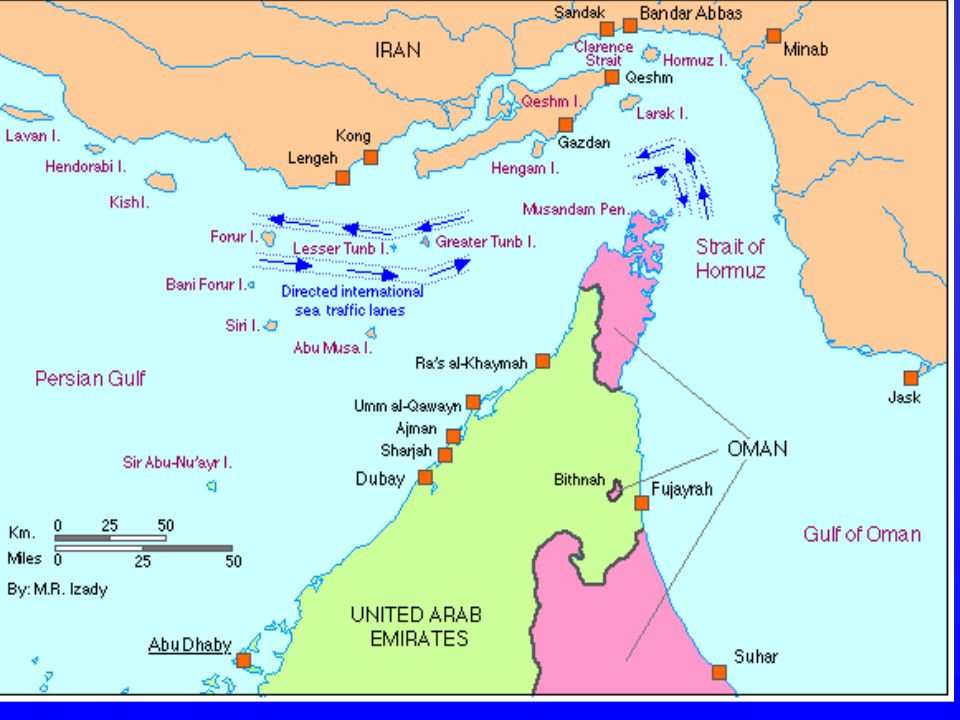
The Persian Gulf, from the shuttle Endeavour. Strait of Hormuz
Is one of the most strategic waterways in the world due to world oil transportation. This is the world's most important oil "chokepoint," accounting for the transit of approx. two-fifths of all world oil.

35
Main global oil transportation routes
Oil Transportation and Major Chokepoints The bulk of the oil transported (62%) is using maritime transportation. The Persian Gulf is a major origin and from this point maritime routes are reaching Europe through the Suez Canal, Japan through the Strait of Malacca and North American through the Cape of Good Hope. Major continental movements involve the Russian and former Soviet Republic's petroleum shipped to Western Europe by pipeline and Alaskan and Canadian petroleum shipped to the United States also by pipeline. Other important oil shipments are from Africa to North America and Europe, from the North Sea to Europe and from South America to North America. Major problem: getting the oil from the Persian Gulf to the rest of the world, and getting it through the choke-points.
 is using maritime transportation. The Persian Gulf is a major origin and from this point maritime routes are reaching Europe through the Suez Canal, Japan through the Strait of Malacca and North American through the Cape of Good Hope. Major continental movements involve the Russian and former Soviet Republic s petroleum shipped to Western Europe by pipeline and Alaskan and Canadian petroleum shipped to the United States also by pipeline. Other important oil shipments are from Africa to North America and Europe, from the North Sea to Europe and from South America to North America. Major problem: getting the oil from the Persian Gulf to the rest of the world, and getting it through the choke-points.")
36
Next Class Biodiversity

Similar presentations


: Transport United States Geological Survey Once extracted oil and gas must be sent to a refinery for processing Pipelines.>")


 Zhang LIR 554 9/30/08.>")

 could.>")


 Three reasons for concern: 1. Volatile.>")

