Download presentation
Presentation is loading. Please wait.

1
EKG Myocardial infarction and other ischemic states
Sandra Rodriguez, M.D. Internal Medicine TTHSC

2
Background Rupture of an atherosclerotic plaque followed by acute coronary thrombosis is the usual mechanism of acute MI. Two-thirds of MI's presenting to emergency rooms evolve to non-Q wave MI's, most having ST segment depression or T wave inversion. In the TIMI III Registry of patients with UA/NSTEMI, independent predictors of 1-year death or MI included left bundle branch block (risk ratio 2.8); ST segment deviation >0.05 mV (risk ratio 2.45); both p< The left anterior descending coronary artery (LAD) and it's branches usually supply the anterior and anterolateral walls of the left ventricle and the anterior two-thirds of the septum.
; ST segment deviation >0.05 mV (risk ratio 2.45); both p< The left anterior descending coronary artery (LAD) and it s branches usually supply the anterior and anterolateral walls of the left ventricle and the anterior two-thirds of the septum.")
3
Background The left circumflex coronary artery (LCX) and its branches usually supply the posterolateral wall of the left ventricle. The right coronary artery (RCA) supplies the right ventricle, the inferior (diaphragmatic) and true posterior walls of the left ventricle, and the posterior third of the septum. The RCA also gives off the AV nodal coronary artery in 85-90% of individuals; in the remaining 10-15%, this artery is a branch of the LCX.
 supplies the right ventricle, the inferior (diaphragmatic) and true posterior walls of the left ventricle, and the posterior third of the septum. The RCA also gives off the AV nodal coronary artery in 85-90% of individuals; in the remaining 10-15%, this artery is a branch of the LCX.")
4
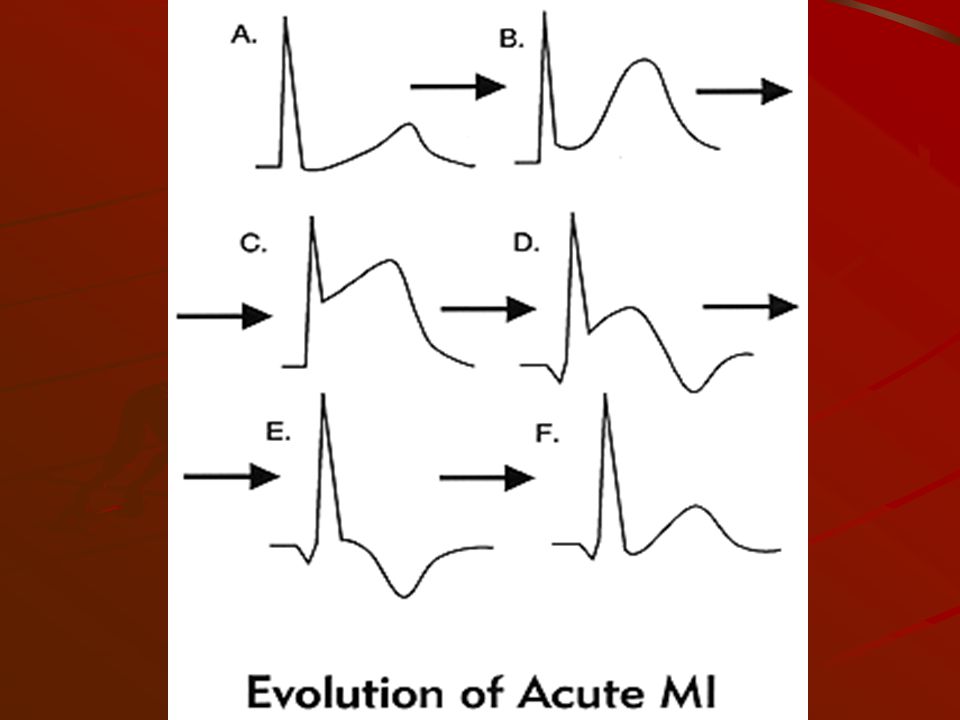
Progression of wave changes
Hyperacute T wave changes - increased T wave amplitude and width; may also see ST elevation. Marked ST elevation with hyperacute T wave changes (transmural injury) Pathologic Q waves, less ST elevation, terminal T wave inversion (necrosis) (Pathologic Q waves are usually defined as duration >0.04 s or >25% of R-wave amplitude) Pathologic Q waves, T wave inversion (necrosis and fibrosis) Pathologic Q waves, upright T waves (fibrosis)
 Pathologic Q waves, less ST elevation, terminal T wave inversion (necrosis) (Pathologic Q waves are usually defined as duration >0.04 s or >25% of R-wave amplitude) Pathologic Q waves, T wave inversion (necrosis and fibrosis) Pathologic Q waves, upright T waves (fibrosis)")
6
Inferior MI Pathologic Q waves and evolving ST-T changes in leads II, III, aVF. Q waves usually largest in lead III, next largest in lead aVF, and smallest in lead II

7
Inferior MI

8
Inferoposterior MI ECG changes are seen in anterior precordial leads V1-3, but are the mirror image of an anteroseptal MI, Increased R wave amplitude and duration (i.e., a "pathologic R wave" is a mirror image of a pathologic Q). R/S ratio in V1 or V2 >1 (i.e., prominent anterior forces). Hyperacute ST-T wave changes: i.e., ST depression and large, inverted T waves in V1-3. Late normalization of ST-T with symmetrical upright T waves in V1-3. Often seen with inferior MI (i.e., "inferoposterior MI")
. R/S ratio in V1 or V2 >1 (i.e., prominent anterior forces). Hyperacute ST-T wave changes: i.e., ST depression and large, inverted T waves in V1-3. Late normalization of ST-T with symmetrical upright T waves in V1-3. Often seen with inferior MI (i.e., inferoposterior MI )")
9
Inferoposterior MI

10
Inferoposterior MI

11
Right Ventricular MI Right Ventricular MI (only seen with proximal right coronary occlusion; i.e., with inferior family MI's) ECG findings usually require additional leads on right chest (V1R to V6R, analogous to the left chest leads) ST elevation, >1mm, in right chest leads, especially V4R.
 ST elevation, >1mm, in right chest leads, especially V4R.")
12
Right Ventricular MI

13
Anterior MI

14
High Lateral MI

15
What is the diagnosis?

16
MI plus LBBB Q waves of any size in two or more of leads I, aVL, V5, or V6 (See below: one of the most reliable signs and probably indicates septal infarction, because the septum is activated early from the right ventricular side in LBBB). Reversal of the usual R wave progression in precordial leads. Notching of the downstroke of the S wave in precordial leads to the right of the transition zone (i.e., before QRS changes from a predominate S wave complex to a predominate R wave complex); this may be a Q-wave equivalent.
. Reversal of the usual R wave progression in precordial leads. Notching of the downstroke of the S wave in precordial leads to the right of the transition zone (i.e., before QRS changes from a predominate S wave complex to a predominate R wave complex); this may be a Q-wave equivalent.")
17
MI plus LBBB Notching of the upstroke of the S wave in precordial leads to the right of the transition zone (another Q-wave equivalent). rSR' complex in leads I, V5 or V6 (the S is a Q-wave equivalent occurring in the middle of the QRS complex) RS complex in V5-6 rather than the usual monophasic R waves seen in uncomplicated LBBB; (the S is a Q-wave equivalent). "Primary" ST-T wave changes (i.e., ST-T changes in the same direction as the QRS complex rather than the usual "secondary" ST-T changes seen in uncomplicated LBBB); these changes may reflect an acute, evolving MI.
 RS complex in V5-6 rather than the usual monophasic R waves seen in uncomplicated LBBB; (the S is a Q-wave equivalent). Primary ST-T wave changes (i.e., ST-T changes in the same direction as the QRS complex rather than the usual secondary ST-T changes seen in uncomplicated LBBB); these changes may reflect an acute, evolving MI.")
18
Old MI plus LBB

19
Non-Q wave MI Recognized by evolving ST-T changes over time without the formation of pathologic Q waves (in a patient with typical chest pain symptoms and/or elevation in myocardial-specific enzymes) Although it is tempting to localize the non-Q MI by the particular leads showing ST-T changes, this is probably only valid for the ST segment elevation pattern. Evolving ST-T changes may include any of the following patterns: Convex downward ST segment depression only (common) Convex upwards or straight ST segment elevation only. Symmetrical T wave inversion only (common)
 Although it is tempting to localize the non-Q MI by the particular leads showing ST-T changes, this is probably only valid for the ST segment elevation pattern. Evolving ST-T changes may include any of the following patterns: Convex downward ST segment depression only (common) Convex upwards or straight ST segment elevation only. Symmetrical T wave inversion only (common)")
20
Non-Q wave MI

21
Differential MI pattern
WPW preexcitation (negative delta wave may mimic pathologic Q waves) IHSS (septal hypertrophy may make normal septal Q waves "fatter" thereby mimicking pathologic Q waves) LVH (may have QS pattern or poor R wave progression in leads V1-3) RVH (tall R waves in V1 or V2 may mimic true posterior MI) Complete or incomplete LBBB (QS waves or poor R wave progression in leads V1-3)
 IHSS (septal hypertrophy may make normal septal Q waves fatter thereby mimicking pathologic Q waves) LVH (may have QS pattern or poor R wave progression in leads V1-3) RVH (tall R waves in V1 or V2 may mimic true posterior MI) Complete or incomplete LBBB (QS waves or poor R wave progression in leads V1-3)")
22
Differential MI pattern
Pneumothorax (loss of right precordial R waves) Pulmonary emphysema and cor pulmonale (loss of R waves V1-3 and/or inferior Q waves with right axis deviation) Left anterior fascicular block (may see small q-waves in anterior chest leads) Acute pericarditis (the ST segment elevation may mimic acute transmural injury) Central nervous system disease (may mimic non-Q wave MI by causing diffuse ST-T wave changes
 Pulmonary emphysema and cor pulmonale (loss of R waves V1-3 and/or inferior Q waves with right axis deviation) Left anterior fascicular block (may see small q-waves in anterior chest leads) Acute pericarditis (the ST segment elevation may mimic acute transmural injury) Central nervous system disease (may mimic non-Q wave MI by causing diffuse ST-T wave changes.")
Similar presentations