Download presentation
Presentation is loading. Please wait.

1
Working Capital Management
CHAPTER 21 Working Capital Management

2
Topics in Chapter Working capital policies
Cash, inventory, and A/R management Accounts payable management Short-term financing policies Bank debt and commercial paper 1

3
Basic Definitions Gross working capital: Total current assets
Net working capital (NWC): Current assets - Current liabilities Net operating working capital (NOWC): Operating CA – Operating CL = (Cash + Inv. + A/R) – (Accruals + A/P) 2
: Current assets - Current liabilities. Net operating working capital (NOWC): Operating CA – Operating CL = (Cash + Inv. + A/R) – (Accruals + A/P) 2.")
4
Working Capital Management
Day-to-day control Cash Inventories Accounts receivable Accruals Accounts payable Working capital policy The level of each current asset How current assets are financed 2

5
Cash Conversion Cycle The time between payments made for materials and labor and payments received from sales: Cash Conversion = Cycle Inventory Conversion + Period Receivables Collection − Payables Deferral (21-4)
")
6
Inventory Conversion Period
Average time required to convert materials into finished goods and to sell those goods:

7
Receivables Collection Period
Average length of time required to convert the firm’s receivables into cash: Receivables Collection Period = DSO = Days Sales Outstanding

8
Payables Deferral Period
Average length of time between the purchase of materials and labor and the payment of cash for them:

9
Real Time Computer Cash Conversion Data

10
Inventory Conversion Period

11
Receivables Collection Period

12
Payables Deferral Period

13
Cash Conversion Cycle CCC = 73 days + 24 days – 30 days CCC = 67 days
Inventory Conversion + Period Receivables Collection − Payables Deferral (21-4) CCC = days days – 30 days CCC = days
 CCC = 73 days + 24 days – 30 days. CCC = 67 days.")
14
Cash Conversion Cycle Figure 21-1

15
Cash Conversion Objective
Shorten the cash conversion cycle as much as possible without hurting operations: Reduce Inventory Conversion period Process & sell goods quicker Reduce Receivables Collection period Speed up collections Lengthen Payables Deferral Period Slow firm’s payments

16
Real Time Computer TABLE 21.1

17
Real Time Computer

18
Alternative NOWC Policies

19
Cash Management: Cash = “Non-earning Asset”
Transactions: Must have some cash to pay current bills. Precautionary balances = “Safety stock” Compensating balances: For loans and/or services provided. Speculation: Take advantage of bargains Take discounts 6

20
Cash Budget: The Primary Cash Management Tool
Projected cash inflows, outflows, and ending cash balances forecast loan needs and funds available for temporary investment Daily, weekly, or monthly, depending upon budget’s purpose Monthly for annual planning Daily for actual cash management 11

21
Data Required for Cash Budget
Sales forecast Information on collections delay Forecast of purchases and payment terms Forecast of cash expenses: wages, taxes, utilities, and so on Initial cash on hand Target cash balance 12

22
MicroDrive Cash Budget

23
Table 21-2

25
$300*20%*98% = $250*70% = $200*10% = $300*70% =

26
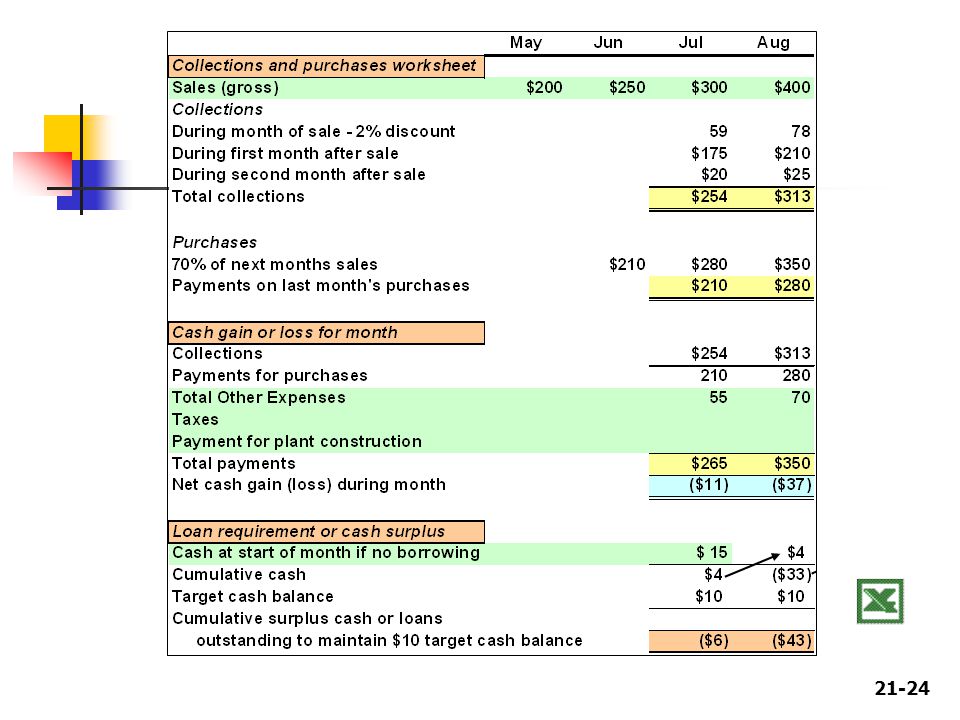
MicroDrive Cash Budget

27
Table 21-2

28
Other Cash Budget Line Items
Interest earned or paid = Interest rate x surplus/loan line of cash budget for preceding month Interest on any other outstanding loans Bad debt expense Collections reduced by bad debt losses. For example, if 3% bad debt losses, collections would = 97% of sales 17

29
Cash Budget with Adjustments

30
Cash Management Techniques
Synchronize inflows and outflows Billing cycle = Payment cycle Use Float Remote disbursement accounts (+) Net Collections float (-) Float Lockbox Plan Payment by wire transfer or automatic debit Reduce the need for a cash “safety stock”: Increase forecast accuracy Hold marketable securities instead of a cash Negotiate a line of credit 8
 Net. Collections float (-) Float. Lockbox Plan. Payment by wire transfer or automatic debit. Reduce the need for a cash safety stock : Increase forecast accuracy. Hold marketable securities instead of a cash. Negotiate a line of credit. 8.")
31
Inventory Management Goals
Ensure that the inventory needed to sustain operations is available Minimize the costs of ordering and carrying inventory Trade-off to balance goals

32
Inventory Management: Categories of Inventory Costs
Carrying Costs Storage and handling Insurance Property taxes Depreciation Obsolescence 21

33
Inventory Management: Categories of Inventory Costs
Ordering Costs Cost of placing orders Shipping Handling costs 21

34
Inventory Management: Categories of Inventory Costs
Costs of Running Short Loss of sales Loss of customer goodwill Disruption of production schedules 21

35
Receivables Management
A/R = Credit sales/day X Collection Period Depends on volume of credit sales Average time from credit sale to collection of cash Credit policy Receivables monitoring

36
Elements of Credit Policy
Credit Period = How long to pay? Shorter period reduces DSO Reduces average A/R May discourage sales Cash Discounts Lowers price Attracts new customers Reduces DSO 25

37
Elements of Credit Policy
Credit Standards Tighter standards reduce bad debt losses, May reduce sales Fewer bad debts reduces DSO Collection Policy Tougher policy will reduce DSO May damage customer relationships

38
Receivables Monitoring
Credit sale events: Inventories reduced by COGS A/R increased by sales price Price – COGS = Profit Profit Retained Earnings DSO = Days Sales Outstanding DSO = Average Collection Period

39
Days Sales Outstanding

40
Receivables Aging Schedule
Breaks down firm’s receivables by age TABLE 21.3

41
Accruals Accrued wages and accrued taxes Increase spontaneously
Accruals are free in that no explicit interest is charged Firms have little control over the level of accruals Levels influenced by industry custom, economic factors, and tax laws

42
Trade Credit Credit furnished by a firm’s suppliers Accounts Payable
Often largest source of short-term credit, especially for small firms Spontaneously increases Easy to get, but cost can be high Example: 2/10, net 30 2% discount if paid within 10 days Due in 30 days

43
The Cost of Trade Credit
Microchip sells on terms of 2/10, net 30 True price = 98% of selling price PCC buys $100 of memory chips from Microchip If paid within 10 days Cost = $98 If PCC wants 20 extra days to pay Cost = $100 List price = $98 true cost + $2 finance charge

44
PCC’s Trade Credit Cost
PCC buys an average of $11,923,333 from Microchip $32, per day If PCC pays on day 10 PCC A/P average = 10(32,667) = $326,667 PCC is receiving $326,667 credit from Microchip
 = $326,667. PCC is receiving $326,667 credit from Microchip.")
45
PCC’s Trade Credit Cost
If PCC takes the extra 20 days to pay PCC A/P average = 30(32,667) = $980,000 PCC is receiving $980, ,667 = $653,333 credit from Microchip PCC is foregoing a 2% discount PCC’s total cost = $11,923,333/0.98 = $12,166,666 Annual finance cost = $12,166,666 – 11,923,333 = $243,333 = 37.2%
 = $980,000. PCC is receiving $980, ,667 = $653,333 credit from Microchip. PCC is foregoing a 2% discount. PCC’s total cost = $11,923,333/0.98. = $12,166,666. Annual finance cost = $12,166,666 – 11,923,333 = $243,333 = 37.2%")
46
Nominal Cost Formula 2/10, net 30
rNOM = Discount % 1 - Discount % × 365 days Days Taken Discount Period - = 2 98 365 20 = × 18.25 = = 37.2% PCC Pays 2.04% times per year

47
Effective Annual Rate (EAR) 2/10, net 30
Periodic rate = 0.02/0.98 = 2.04% Periods/year = 365/(30 – 10) = 18.25 EAR = (1 + Periodic rate)n – 1.0 = (1.0204)18.25 – 1.0 = 44.6%
 = EAR = (1 + Periodic rate)n – 1.0. = (1.0204)18.25 – 1.0. = 44.6%")
48
The Cost of Trade Credit

49
Trade Credit Two components:
Free trade credit = discount period credit Costly trade credit = cost implied by foregone discount Firms should always use the free credit Use the costly credit only after careful analysis and comparison with other sources

50
Working Capital Financing Policies
Moderate = Match the maturity of the assets with the maturity of the financing “Maturity matching” “Self-liquidating” Aggressive = Use short-term financing to finance permanent assets Conservative = Use permanent capital for permanent assets and temporary assets

51
FIGURE 21.2 Page 751

52
Moderate Financing Policy
Years $ Perm NOWC Fixed Assets Temp. NOWC Lower dashed line, more aggressive. } S-T Loans L-T Fin: Stock & Bonds,

53
Conservative Financing Policy
Fixed Assets Years $ Perm NOWC L-T Fin: Stock & Bonds Marketable Securities Zero S-T debt

54
Short-term Investments
Marketable securities Lower yields than operating assets Held for same reasons as cash Benefits: Reduces risk and transactions costs Won’t need to issue securities or borrow as frequently Ready cash for opportunities = “speculative balances” Disadvantages Low after-tax return

55
Short-term Financing Advantages Funds available relatively quickly
Lower cost Yield curve usually upward sloping Lower flotation costs Can repay early without penalty Less restrictive loan covenants

56
Short-term Financing Disadvantages Higher risk
Interest expense fluctuates Required repayment comes quicker Firm may have trouble rolling over loans

57
Short-term Bank Loans = Notes payable Maturity Promissory Note
2/3 are for less than 1 year Frequently 90 days Promissory Note Signed when bank loan approved Specifies: Amount Interest rate Repayment schedule Collateral

58
Short-term Bank Loans Compensating Balances Informal Line of Credit
Raises the effective loan rate Illegal in many states Informal Line of Credit Maximum amount bank will extend Revolving Credit Agreement Formal line of credit Periodic commitment fee Bank legally obligated to honor agreement

59
Commercial Paper (CP) Short term, unsecured promissory notes issued by large, strong companies Maturity = 1-9 months; average 5 months Interest rates fluctuate daily just above the T-bill rate Less personal than bank relationships

60
Security in Short-term Financing
Commercial paper is never secured Better to borrow on an unsecured basis Lower bookkeeping costs Collateral options: Marketable securities Land or buildings Equipment Inventory Receivables

Similar presentations
>")


.>")


 (Chapter 6 – pages 143 – 145)>")