Download presentation
Presentation is loading. Please wait.

1
MICROWAVE RAINFALL RETRIEVALS AND VALIDATIONS R.M. GAIROLA, S. POHREL & A.K. VARMA OSD/MOG SAC/ISRO AHMEDABAD

2
Development of algorithms for rain rate retrievals over land and oceans Validation & fine-tuning of algorithm using ground based measurements like Doppler Weather Radar (DWR) & rain gauges etc. over Indian region (land & ocean) Study of some cases of monsoon, flash floods & cyclone rainfall using the developed algorithms Study of hydrological processes to assess the accuracy of the retrievals ISSUES AND OBJECTIVES :
 Study of some cases of monsoon, flash floods & cyclone rainfall using the developed algorithms Study of hydrological processes to assess the accuracy of the retrievals ISSUES AND OBJECTIVES :.")
5
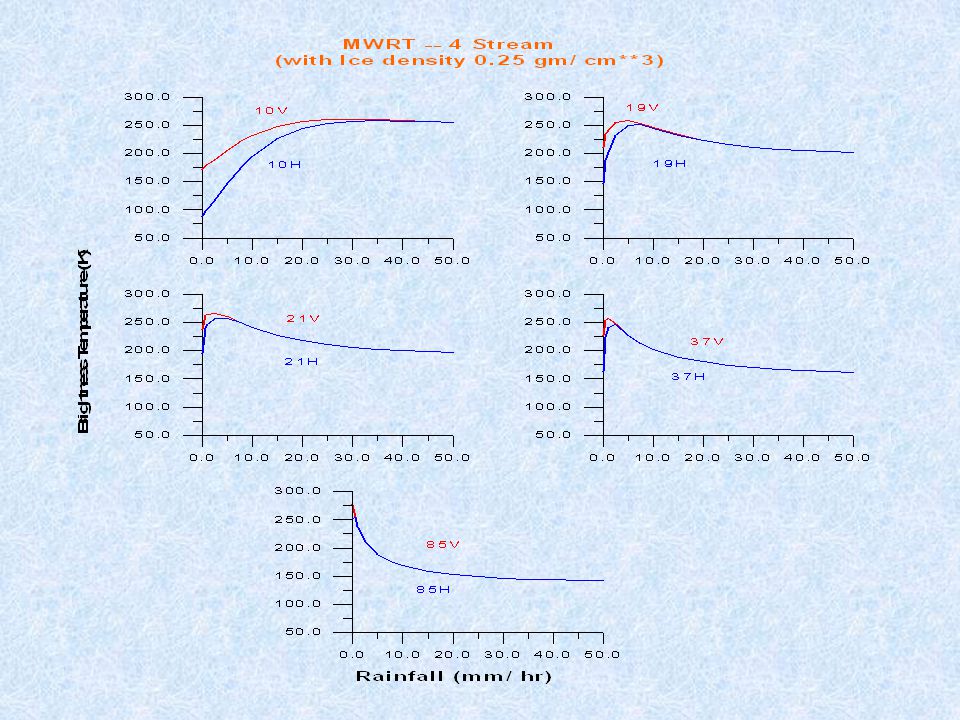
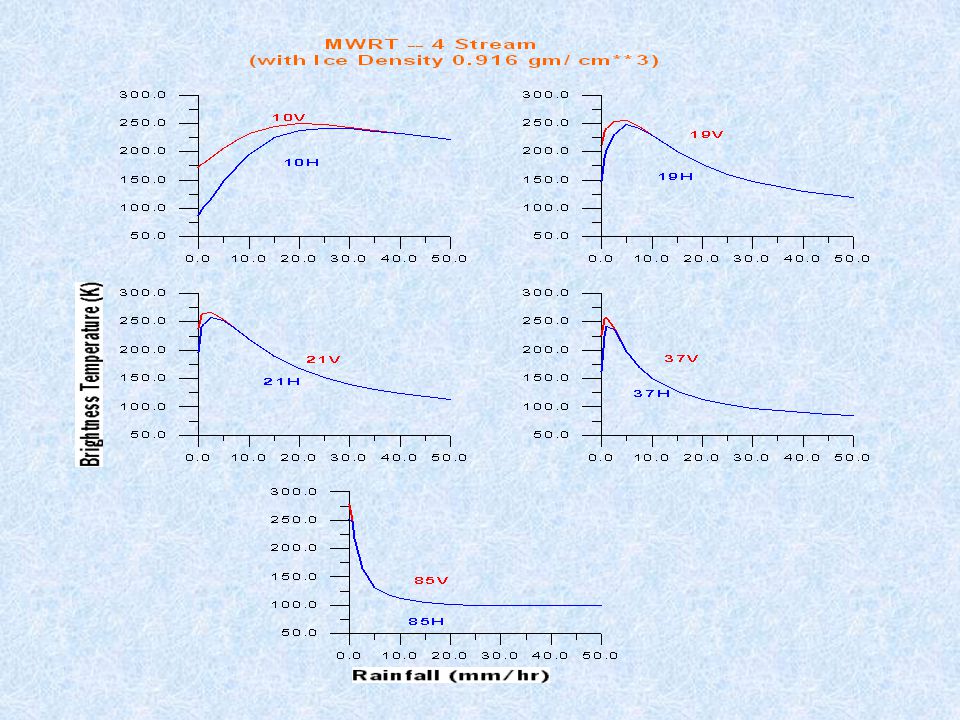
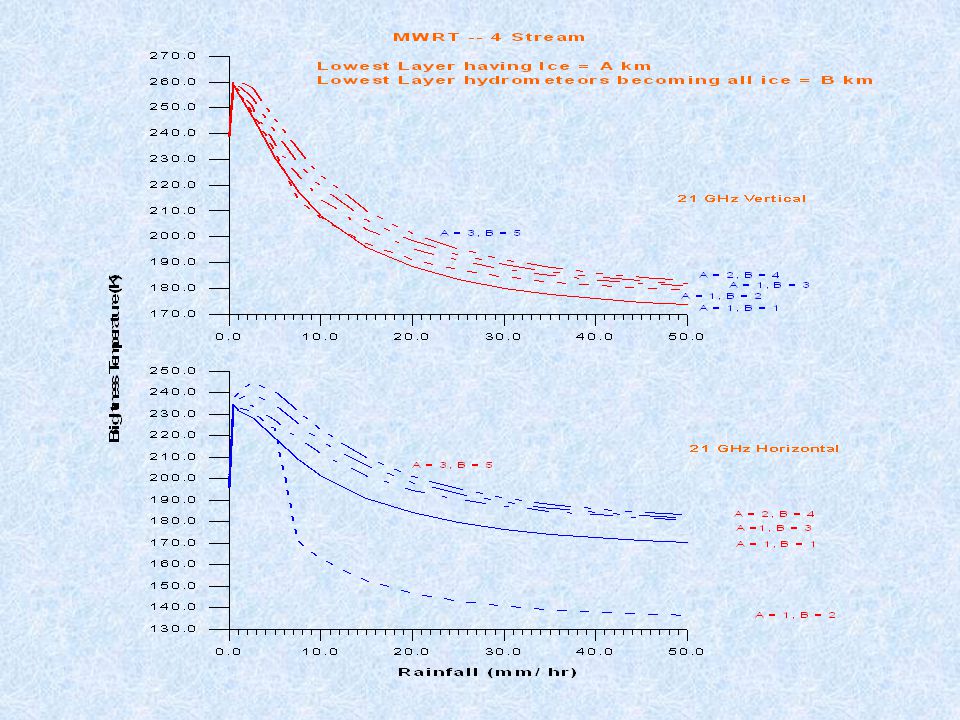
Physical Approach Forward Modeling (Radiative Transfer Simulations)
")
7
Water vapour versus simulated TB’s - TMI Channels For Non-Raining Atmospheres:

8
CLW versus Simulated TB’s – TMI Channels

10
Assumption:- For an isotropic field the ratio of the second moment of the radiation field to the mean intensity is everywhere equal to 1/3. RTR for Raining Atmospheres Eddington approximation Assumption:- Cross-polarization is negligible and the scattering phase function follow Henyey-Greenstein equation. Discrete Ordinate Approximation Model used:- Kummerow et al., 1993 Model used:- Liu, 1998

12
Observations from TRMM-TMI and PR (V-Blue, H-Red)
")
22
Examples from Data: Tropical Rainfall Measuring Mission (TRMM) TRMM Microwave Imager (TMI); 85.5 GHz Precipitation Radar (PR); 13.8 GHz Data Product (Version 6): 2A25 for Radar Reflectivity 1B11 for Brightness Temperature 2A12 for Latent Heat information
 TRMM Microwave Imager (TMI); 85.5 GHz Precipitation Radar (PR); 13.8 GHz Data Product (Version 6): 2A25 for Radar Reflectivity 1B11 for Brightness Temperature 2A12 for Latent Heat information")
23
300 275 250 225 200 Spatial distribution of BT (85.5 GHz, Vertical) over Eastern India
 over Eastern India")
24
50 30 20 10 0 Spatial distribution of Near Surface PR Reflectivity (dBZ) over Eastern India
 over Eastern India")
25
Number of Pixels (a)Spatial variation of BT(85.5 GHz) for convective and stratiform region and (b) Corresponding vertical cross section of PR Reflectivity (dBZ) (a) (b)
Spatial variation of BT(85.5 GHz) for convective and stratiform region and (b) Corresponding vertical cross section of PR Reflectivity (dBZ) (a) (b)")
26
RETRIEVAL ALGORITHMS FOR OCEAN & LAND (MR Approach) OCEANIC RAINFALL Use of emission (at low frequency) & scattering (at high frequency) signatures with suitable statistical model: R = a0+a1.ln(Tb19v–Tb19h)+a2.ln(Tb22v –180)+a3.ln(Tb85v-Tb19v) LAND RAINFALL Use of scattering signatures at high frequencies R = c0 + c1.PCT + c2.SI [PCT=1.818TB85v–0.818TB85h ], [SI=E 85v (10v,19v,21v) – TB85v] E 85v (10v, 19v, 21v) = b0+b1.Tb10v+b2.Tb19v + b3.TB21v (b i coeff. derived for non-raining conditions)
![RETRIEVAL ALGORITHMS FOR OCEAN & LAND (MR Approach) OCEANIC RAINFALL Use of emission (at low frequency) & scattering (at high frequency) signatures with suitable statistical model: R = a0+a1.ln(Tb19v–Tb19h)+a2.ln(Tb22v –180)+a3.ln(Tb85v-Tb19v) LAND RAINFALL Use of scattering signatures at high frequencies R = c0 + c1.PCT + c2.SI [PCT=1.818TB85v–0.818TB85h ], [SI=E 85v (10v,19v,21v) – TB85v] E 85v (10v, 19v, 21v) = b0+b1.Tb10v+b2.Tb19v + b3.TB21v (b i coeff.](http://images.slideplayer.com/15/4628611/slides/slide_26.jpg "derived for non-raining conditions).")
27
TRMM-TMI Rainfall from NASA & Present Algorithms NASA TMI Rain (mm/hr)Present TMI Rain (mm/hr) AUGUST 2, 2002
Present TMI Rain (mm/hr) AUGUST 2, 2002")
28
COMPARISON OF RAINFALL FROM NASA, PR & PRESENT ALGORITHMS NASA TMI RAINRATE NASA PR RAINRATE TMI RAINRATE (PRESENT ALGORITHM) OCTOBER 10, 2002
 OCTOBER 10, 2002")
29
TRMM-TMI Rainfall from NASA-GPROF and SAC Algorithm, Aug 2, 2002

30
Output Layer Hidden Layer Input Layer ----- Training ----- Testing Fig. ANN architecture having four inputs as brightness Temp and one output as radar rainfall Fig. 3. ANN error distribution for training

31
Observed Rain Rate ANN Rain Rate RETRIEVAL ALGORITHMS FOR OCEAN & LAND (ANN Approach)
")
32
Fig. Observed and ANN rain rate for the geographical area used for testing the performance of the ANN. Observed Rain Rate ANN Rain Rate

33
VALIDATIONS

34
GROUND-BASED OBSERVATIONS BY DOPPLER WEATHER RADAR (CHENNAI) Original Image
 Original Image")
35
COMPARISON OF TRMM RAINFALL USING DWR DATA OCTOBER 17, 2002 NASA-GPROF RAINFALL PRODUCT

37
TRMM Rain (mm/h) Statistics (17-Oct-02) 1.With 0.5 degree elevation r = 0.67 Total Points: 256 rms diff: 4.592406 2. With 1.5 degree elevation r = 0.63 Total Points: 256 rms diff: 4.725613594 SHAR-DWR Rain (mm/h) Ele: 1.5 SHAR-DWR Rain (mm/h) Ele: 0.5 1845Z 1929Z
 Ele: 1.5 SHAR-DWR Rain (mm/h) Ele: Z 1929Z.")
38
IR Image WV Image 17-10-2002, 1500hrs [MetSAT-5]
![IR Image WV Image , 1500hrs [MetSAT-5]](http://images.slideplayer.com/15/4628611/slides/slide_38.jpg "IR Image WV Image , 1500hrs [MetSAT-5]")
39
Convective Activity on 1-6 th Dec 2002

40
Statistics (6-Dec-02) 1.With 0.5 degree elevation r = 0.45 Total Points: 256 rms diff: 3.13 2. With 1.5 degree elevation r = 0.42 Total Points: 256 rms diff: 3.22 SHAR-DWR Rain (mm/h) Ele: 0.5 SHAR-DWR Rain (mm/h) Ele: 1.5 TRMM Rain (mm/h) 0915Z 1015Z
 Ele: 0.5 SHAR-DWR Rain (mm/h) Ele: 1.5 TRMM Rain (mm/h) 0915Z 1015Z.")
41
VALIDATION CAMPAIGN (Oct-Nov. 2003)
")
42
Simultaneous DWR and Disdrometer observations over SHAR on 17-10-03 (0951 IST) SHAR DWR and Disdrometer Observations
 SHAR DWR and Disdrometer Observations")
43
PPI Plot (06 Nov,2003) DWR (SHAR)
 DWR (SHAR)")
44
PR Scan (06 Nov, 2003) Orbit No. 34082
 Orbit No")
45
(a) DWR (b) PR Magnified View of near simultaneous Observations of (a) DWR and (b) PR (TRMM) Reflectivity on 06 Nov, 2003
 DWR (b) PR Magnified View of near simultaneous Observations of (a) DWR and (b) PR (TRMM) Reflectivity on 06 Nov, 2003")
46
Scatter plots (a) PR estimated dBZ versus DWR estimated dBZ (b) PR estimated Rainfall intensity versus DWR estimated Rainfall intensity (a) (b)
 PR estimated dBZ versus DWR estimated dBZ (b) PR estimated Rainfall intensity versus DWR estimated Rainfall intensity (a) (b)")
47
TMI DWR-25 km PR DWR-4 km 6 Nov. 2003

48
Applications: Some Examples

49
TRMM Rainfall Anomalies 1998-2004

50
MODIS Water Vapor Obs. 2001-2004

51
TRMM Seasonal Rainfall (2001-2004)
")
52
TRMM Rainfall Rates (mm/h) 1998-2004
")
56
Time Latitude Plot of TPW from MODIS 75 0 -85 0

57
Time Longitude Plot of TPW from MODIS 5 0 -15 0

58
Hydrological Studies from Microwave Measurements: Evaporation Estimates from Microwave Measurements – examples from TRMM Precipitation Estimates from Microwave Measurements – examples from TRMM Fresh water fluxes (E-P) - examples from TRMM
 - examples from TRMM")
59
E-P for July 1, 2003 (mm/day)
")
60
E-P for July, 2003 (mm/month)
")
61
Conclusions and Concerned Areas: Beam Filling Problem Horizontal and vertical inhomogenity Drop size distribution Melting layer Inversion Techniques

Similar presentations


>")


 Atlas (1989)>")
. Why TRMM? n Tropical Rainfall Measuring Mission (TRMM) is a joint US-Japan study initiated in 1997 to study.>")


>")