Download presentation
Presentation is loading. Please wait.

1
Cloud and Precipitation Patterns and Processes Sandra Yuter 1 November 2004

3
Habitability and sustainability depend on interrelationships among temperature, clouds, and precipitation Agriculture Agriculture Soil Moisture Soil Moisture Fresh water supply Fresh water supply Flooding and droughts Flooding and droughts

4
Key Questions How will future climate change impact life on Earth? How will future climate change impact life on Earth? Water Cycle: Have global patterns of cloud and precipitation changed in the last 30 years? Have global patterns of cloud and precipitation changed in the last 30 years? Physical interpretation of observations and estimation of their uncertainties Physical interpretation of observations and estimation of their uncertainties How well do global and mesoscale models forecast patterns of cloud and precipitation? How well do global and mesoscale models forecast patterns of cloud and precipitation? Model parameterizations Model parameterizations Model evaluation Model evaluation

5
Research Goals Improve physical interpretation of observations and quantify their uncertainties Improve physical interpretation of observations and quantify their uncertainties Impacts: Impacts: Basic research Basic research Model physical parameterizations Model physical parameterizations Forecast model evaluation Forecast model evaluation Use of model reanalysis as substitute for data Use of model reanalysis as substitute for data

6
Current Areas of Research Error characterization of satellite precipitation retrievals Error characterization of satellite precipitation retrievals Marine stratocumulus clouds and drizzle Marine stratocumulus clouds and drizzle Orographic precipitation Orographic precipitation

7
Rain gauge data set used in global precip maps Global Precipitation Climatology Center (G. Huffman)
")
8
NASA’s Tropical Rainfall Measuring Mission (TRMM) Satellite 35 deg inclination low earth orbit 35 deg inclination low earth orbit Precipitation Radar (PR) 2.3 cm λ radar Precipitation Radar (PR) 2.3 cm λ radar Infrared (IR) and Visible sensors similar to GOES satellites Infrared (IR) and Visible sensors similar to GOES satellites TRMM Microwave Imager (TMI) passive microwave scattering and emission sensors similar to SSM/I and NPOESS satellites TRMM Microwave Imager (TMI) passive microwave scattering and emission sensors similar to SSM/I and NPOESS satellites Used for research and operations (esp. hurricanes) Used for research and operations (esp. hurricanes)
 Used for research and operations (esp. hurricanes).")
9
Storm Schematic Cloud boundary Radar echo boundary 0°C level Surface precipitation Convective Stratiform Houze et al. (1989)
.")
10
How IR sees storm Area of cloud top above threshold temperature

11
How PMW emission sees storm

12
How PMW scattering sees storm

13
IR PMW Scattering and Emission PMW Emission 2.3 cm Radar NASA TRMM 32 month average rainfall mm/day

14
Global Precipitation Uncertainties How do radar and passive microwave estimates differ? How do radar and passive microwave estimates differ? Relative error statistics Relative error statistics Regional and temporal variations Regional and temporal variations Why do radar and passive microwave estimates differ? Why do radar and passive microwave estimates differ? Diagnostic information Diagnostic information Satellite Product User Groups Satellite Product User Groups Algorithm development - How can retrievals be improved? Algorithm development - How can retrievals be improved? Forecasters-How much confidence? Forecasters-How much confidence? Data Assimilation- How to weight input for each region? Data Assimilation- How to weight input for each region?

15
Prototype for Global Oceanic Error Characterization Input: TRMM TMI and PR (Vers. 5) Input: TRMM TMI and PR (Vers. 5) Oceanic pixels only Oceanic pixels only Grids of ~2000 x 2000 km 2 oceanic area Grids of ~2000 x 2000 km 2 oceanic area Daily product based on accumulated statistics for previous 47 days (complete diurnal cycle) Daily product based on accumulated statistics for previous 47 days (complete diurnal cycle) Compare Compare Probability distributions Probability distributions Statistical variables Statistical variables
 Input: TRMM TMI and PR (Vers. 5) Oceanic pixels only Oceanic pixels only Grids of ~2000 x 2000 km 2 oceanic area Grids of ~2000 x 2000 km 2 oceanic area Daily product based on accumulated statistics for previous 47 days (complete diurnal cycle) Daily product based on accumulated statistics for previous 47 days (complete diurnal cycle) Compare Compare Probability distributions Probability distributions Statistical variables Statistical variables.")
16
Prototype Compares Different Data Sets Spatial scales: Spatial scales: PR and TMI native sensor resolutions PR and TMI native sensor resolutions PR ( 5 x 5 km 2 ) rescaled to TMI 10 and 19 GHz scales PR ( 5 x 5 km 2 ) rescaled to TMI 10 and 19 GHz scales (30 x 60 km 2 and 20x30 km 2 respectively) (30 x 60 km 2 and 20x30 km 2 respectively) Types: Types: Surface Rainrate (R sfc ) Surface Rainrate (R sfc ) Vertically-Integrated Liquid Water Content Vertically-Integrated Liquid Water Content Microwave brightness temperatures T b Microwave brightness temperatures T b % Rain area % Rain area
 rescaled to TMI 10 and 19 GHz scales PR ( 5 x 5 km 2 ) rescaled to TMI 10 and 19 GHz scales (30 x 60 km 2 and 20x30 km 2 respectively) (30 x 60 km 2 and 20x30 km 2 respectively) Types: Types: Surface Rainrate (R sfc ) Surface Rainrate (R sfc ) Vertically-Integrated Liquid Water Content Vertically-Integrated Liquid Water Content Microwave brightness temperatures T b Microwave brightness temperatures T b % Rain area % Rain area")
17
IR PMW Scattering and Emission PMW Emission 2.3 cm Radar NASA TRMM 32 month average rainfall mm/day

18
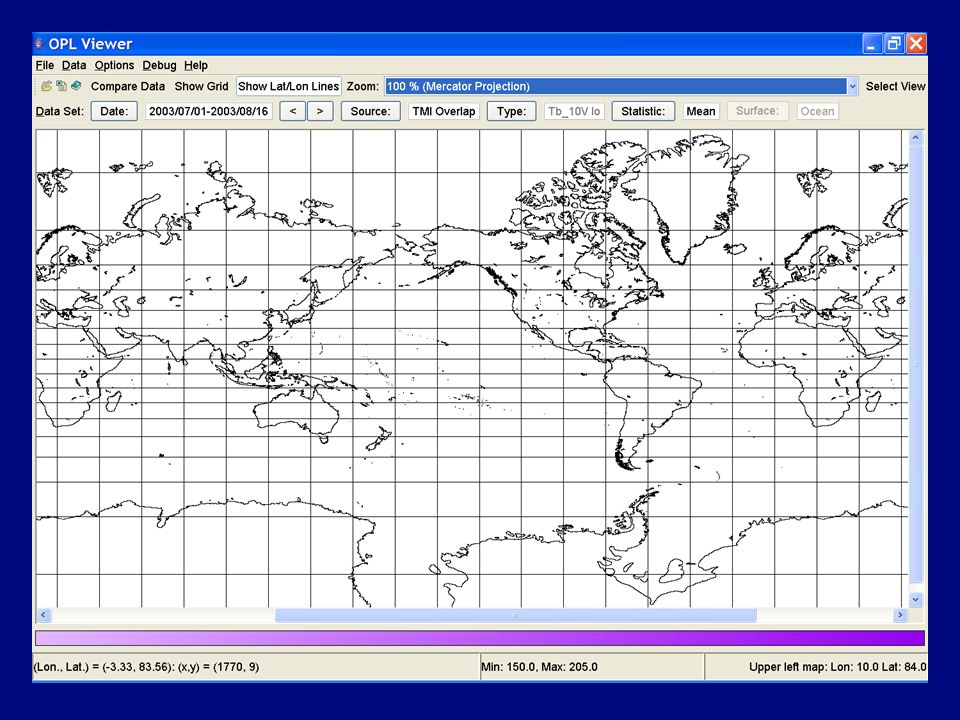
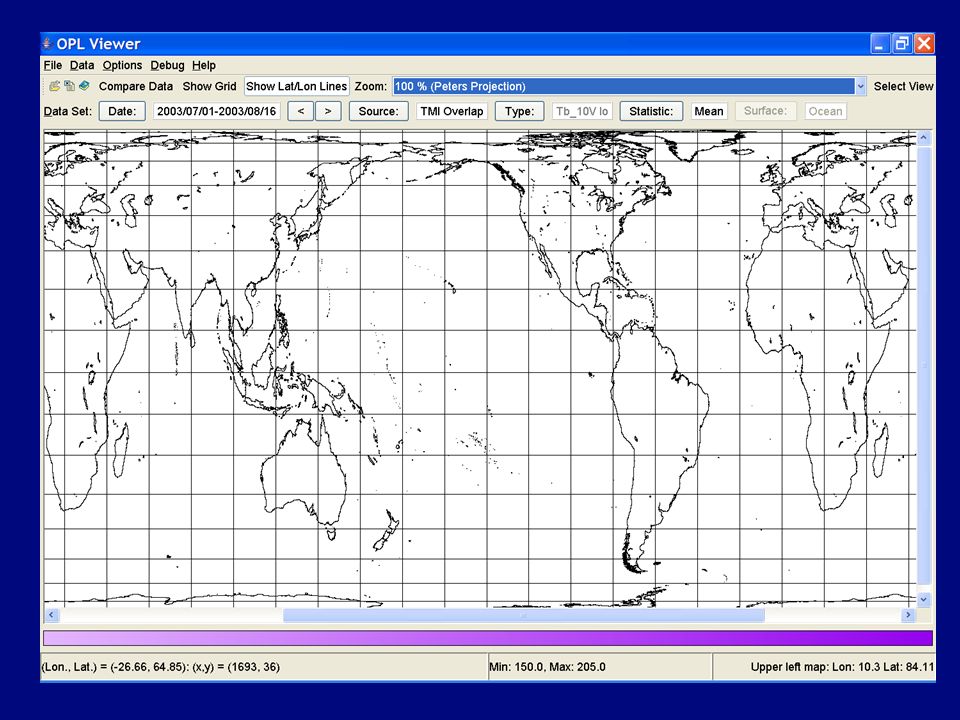
PR Rsfc – TMI Overlap Rsfc

20
Similar Spatial Scales: PR Rsfc – TMI Overlap Rsfc

21
19 GHz Emission Brightness Temperatures

22
% Rain Area of 30 km x 60 km pixel

23
SE Pacific marine stratocumulus clouds and drizzle Radiative cooling from large area of persistent low clouds Radiative cooling from large area of persistent low clouds “Problem” area for global models “Problem” area for global models Model representation of marine stratocumulus influences location of the InterTropical Convergence Zone—an energy source driving global atmospheric circulations Model representation of marine stratocumulus influences location of the InterTropical Convergence Zone—an energy source driving global atmospheric circulations

24
E Pacific cross-section along 95° W Raymond et al. (2004) SEC = South Equatorial Current, NECC = North Equatorial Countercurrent, EUC=Equatorial Undercurrent, x=westward flow, dots=eastward flow
 SEC = South Equatorial Current, NECC = North Equatorial Countercurrent, EUC=Equatorial Undercurrent, x=westward flow, dots=eastward flow.")
25
SE Pacific SST and wind stress Bretherton et al. (2004)
")
26
SE Pacific Stratocumulus 3 am local6 am local9 am local

27
Open Cells Closed Cells Satellite Ship Radar

28
In SE Pacific, Most Drizzle Evaporates Before Reaching the Surface

29
Echo Tracking Comstock et al. (2004)
")
30
Structure and evolution of drizzle cells Drizzle cell lifetime 2+ hours Drizzle cell lifetime 2+ hours Time to rain out < ~ 30 minutes Time to rain out < ~ 30 minutes Implies replenishing cloud water Implies replenishing cloud water Time to reflectivity peak (hours) Average cell reflectivity (dBZ) 15 10 5 -1.5 –1 -0.5 0 0.5 1 1.5 Comstock et al. (2004)
.")
31
EPIC Stratocumulus RHIs 18 October 2001 1428 UTC 90 2 km18 km dBZ 90 m/s

32
VAMOS Ocean Cloud Atmosphere and Land Studies (VOCALS) field campaign planned for October 2007 to improve understanding and model simulation of stratocumulus cloud decks in SE Pacific VAMOS Ocean Cloud Atmosphere and Land Studies (VOCALS) field campaign planned for October 2007 to improve understanding and model simulation of stratocumulus cloud decks in SE Pacific Interaction with weather systems over South America Interaction with weather systems over South America Feedback with underlying ocean Feedback with underlying ocean Mesoscale variability Mesoscale variability Planned SE Pacific Field Experiment
 field campaign planned for October 2007 to improve understanding and model simulation of stratocumulus cloud decks in SE Pacific VAMOS Ocean Cloud Atmosphere and Land Studies (VOCALS) field campaign planned for October 2007 to improve understanding and model simulation of stratocumulus cloud decks in SE Pacific Interaction with weather systems over South America Interaction with weather systems over South America Feedback with underlying ocean Feedback with underlying ocean Mesoscale variability Mesoscale variability Planned SE Pacific Field Experiment")
33
Orographic Precipitation New findings from recent field programs New findings from recent field programs Mesoscale Alpine Programme (MAP) in southern Alps Mesoscale Alpine Programme (MAP) in southern Alps West coast US coastal mountains and Cascade mountains West coast US coastal mountains and Cascade mountains How translate field project findings to real- time forecast models? How translate field project findings to real- time forecast models?

34
Topography Comparison Alps Central W Coast Carolinas Mt. St. Helens Portland, OR Eureka, CA

35
Different precipitation patterns in stable vs. unstable flow Medina and Houze (2003)
")
36
During unblocked, unstable case, some precipitation features were locked to terrain while others developed upstream and drifted toward mountains. Smith et al. (2003) Time Distance topography Gray scale is reflectivity
 Time Distance topography Gray scale is reflectivity.")
37
Mean Patterns for 61 Rain Events Mean Radial Velocity Conditional Mean Reflectivity Eureka, CA WSR-88D radar Oct 1995 – March 1998 From James (2004)
")
38
Mean Reflectivity Cross-Section Enhancement of precipitation over ocean upwind of coastal mountains (James, 2004)
")
39
Volumetric Statistics--Contoured Frequency by Altitude Diagram (CFAD) Yuter and Houze (1995)
 Yuter and Houze (1995)")
40
ReflectivityVertical Velocity Time Yuter and Houze (1995)
")
41
Vertically Pointing Radar from MAP Yuter and Houze (2003) ~2 km
 ~2 km")
42
Distribution of vertical air velocity with height Yuter and Houze (2003)
")
43
Input and results of 1D model similar to bulk microphysics parameterization Yuter and Houze (2003)
")
44
Observed < 2 km scale variability of reflectivity and vertical air motions Do ensemble characteristics need to be parameterized to obtain correct precipitation patterns and intensities? Do ensemble characteristics need to be parameterized to obtain correct precipitation patterns and intensities? How can it best be parameterized? How can it best be parameterized? Evaluation of Model Output with Radar Data Surface fields (2D) Surface fields (2D) Volumetric fields (3D) Volumetric fields (3D) Statistics and spatial patterns Statistics and spatial patterns Current community emphasis
 Surface fields (2D) Volumetric fields (3D) Volumetric fields (3D) Statistics and spatial patterns Statistics and spatial patterns Current community emphasis.")
45
Model to Observation Comparison of Surface Rainfall 1 km cloud resolving model with explicit microphysics (ARPS) of Ft. Worth Texas storm for time=0 (Smedsmo et al, 2004)
.")
46
Smedsmo et al. (2004) Volumetric comparison for accumulated storm totals
 Volumetric comparison for accumulated storm totals")
47
Different reflectivity patterns for different wind directions James (2004) Mean Z 2 km altitude
 Mean Z 2 km altitude")
48
dBZRadial velocity (m/s) (a)(b) (c)(d) How well can models reproduce observed orographic precipitation patterns? Plan to collaborate with modeler to prototype comparisons for Portland, OR region.

49
Field project data sets help diagnose observation “wishful thinking”

50
Oregon Cascade mountains particle size data within melting layer at 0°C Diameter (mm) Yuter et al. (2004) n(D) mm -1 m -3 Rain SubsetWet Snow Subset +13 dB
 n(D) mm -1 m -3 Rain SubsetWet Snow Subset +13 dB.")
51
Severe Weather Example Hurricane Ivan remnants September 17 and 18, 2004 as observed by regional radar network Hurricane Ivan remnants September 17 and 18, 2004 as observed by regional radar network Possible long term objective- evaluation of model ensemble members in near-real time to aid nowcasting and forecasting Possible long term objective- evaluation of model ensemble members in near-real time to aid nowcasting and forecasting

52
17 Sept 2004 0600 UTC Reflectivity Radial Velocity Reflectivity

53
Squall line 18 Sept 2004 0020 UTC KRAX radar NS Reflectivity

54
Incomplete and/or Erroneous Sound and complete Wishful Thinking Fiction Mix of Fiction, Plausible Fiction, and Reality Sound with errors characterized Mix of Fiction, Plausible Fiction, and Reality Reality Model Physics Observation Physical Interpretation Models and Observations Need to Improve

55
Cloud and Precipitation Challenges for the First Quarter of the 21 st Century Utilize operational observations and mesoscale models to improve regional forecasting and basic science. Utilize operational observations and mesoscale models to improve regional forecasting and basic science. Prioritize and improve surface-based and satellite observations. Prioritize and improve surface-based and satellite observations. Retrospectively evaluate global changes and improve climate forecasts. Retrospectively evaluate global changes and improve climate forecasts.

56
The End

57
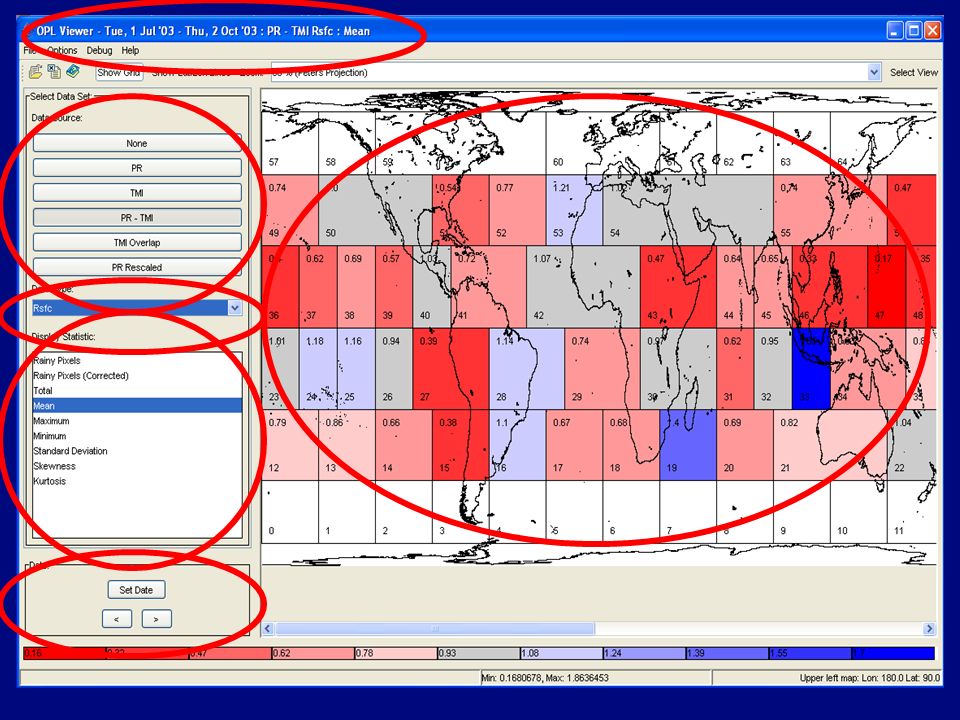
Grid used in Prototype

58
Precipitation Area vs. Mean IR Temperature West Pacific East Pacific

60
Storm Schematic Cloud boundary Radar echo boundary 0°C level Surface precipitation Convective Stratiform Houze et al. (1989)
.")
64
Radar-derived precipitation products Existence, Precip.Area--Min. detectable surface precip rate Existence, Precip.Area--Min. detectable surface precip rate Classification of precip structure in vertical and horizontal into rain, snow, mixed, graupel/hail Classification of precip structure in vertical and horizontal into rain, snow, mixed, graupel/hail Spatial pattern of precip. intensity Spatial pattern of precip. intensity Quantitative estimate of precip. intensity Quantitative estimate of precip. intensity Uncertainty

65
SE Pacific Stratocumulus Region

66
Tropical West Pacific (x) Jul-Aug 02 -1.0 -0.6 -0.2 0.2 0.6 1.0 1.4 1.8 log 10 (R sfc [mm hr -1 ]) PRTMI
![Tropical West Pacific (x) Jul-Aug log 10 (R sfc [mm hr -1 ]) PRTMI](http://images.slideplayer.com/24/7092594/slides/slide_66.jpg "Tropical West Pacific (x) Jul-Aug log 10 (R sfc [mm hr -1 ]) PRTMI")
67
Central North Atlantic Jul-Aug 02 PRTMI log 10 (R sfc [mm hr -1 ]) -1.0 -0.6 -0.2 0.2 0.6 1.0 1.4 1.8
![Central North Atlantic Jul-Aug 02 PRTMI log 10 (R sfc [mm hr -1 ])](http://images.slideplayer.com/24/7092594/slides/slide_67.jpg "Central North Atlantic Jul-Aug 02 PRTMI log 10 (R sfc [mm hr -1 ])")
68
Rescaling PR data aggregated to TMI pixel scale PR data aggregated to TMI pixel scale (10 and 19 GHz) Ensures comparison of statistical properties at a common scale Ensures comparison of statistical properties at a common scale Useful to investigate TMI subpixel variability Useful to investigate TMI subpixel variability
 Ensures comparison of statistical properties at a common scale Ensures comparison of statistical properties at a common scale Useful to investigate TMI subpixel variability Useful to investigate TMI subpixel variability")
69
Accumulated statistics for 47 days

70
Conditional R sfc (PR– TMI) Tropical West PacificCentral North Atlantic
 Tropical West PacificCentral North Atlantic")
71
Mean % rainy area for rescaled PR pixels 0 5 10 15 20 [%]
![Mean % rainy area for rescaled PR pixels [%]](http://images.slideplayer.com/24/7092594/slides/slide_71.jpg "Mean % rainy area for rescaled PR pixels [%]")
73
PR Surface rainrate (native resolution) PR Rescaled rainrate (10 GHz TMI res.)
 PR Rescaled rainrate (10 GHz TMI res.)")
74
TMI Swath (872 km) PR Swath (245 km) EFOVs Along-track axis EFOV IFOV end IFOV start Satellite subpt 15 km between swaths
 PR Swath (245 km) EFOVs Along-track axis EFOV IFOV end IFOV start Satellite subpt 15 km between swaths")
75
Meth Blue 33 Samples Obtained Counted by Hand Rain rates from 0.0001 to 4.1 mm/hr Does not resolve drops < 0.2 mm at all, and drops < 0.4 mm well. ASSUME size range of drops resolved by method are sufficient to determine Z-R relation Number/second -2 dBZ 0.01 mm/hr 22 dBZ 1.6 mm/hr 15 dBZ 0.7 mm/hr

77
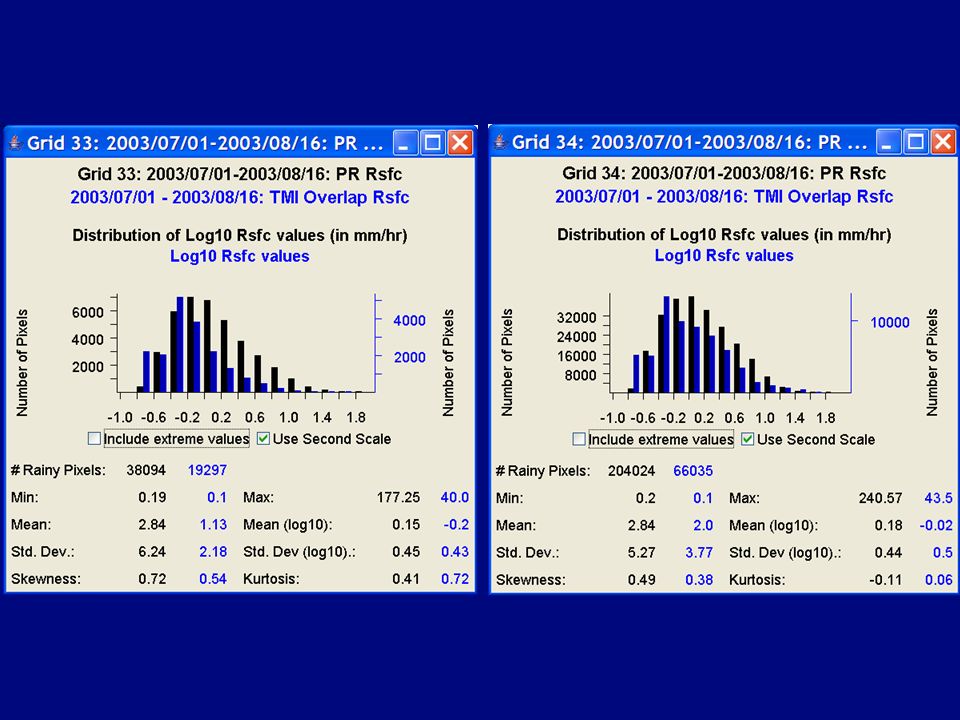
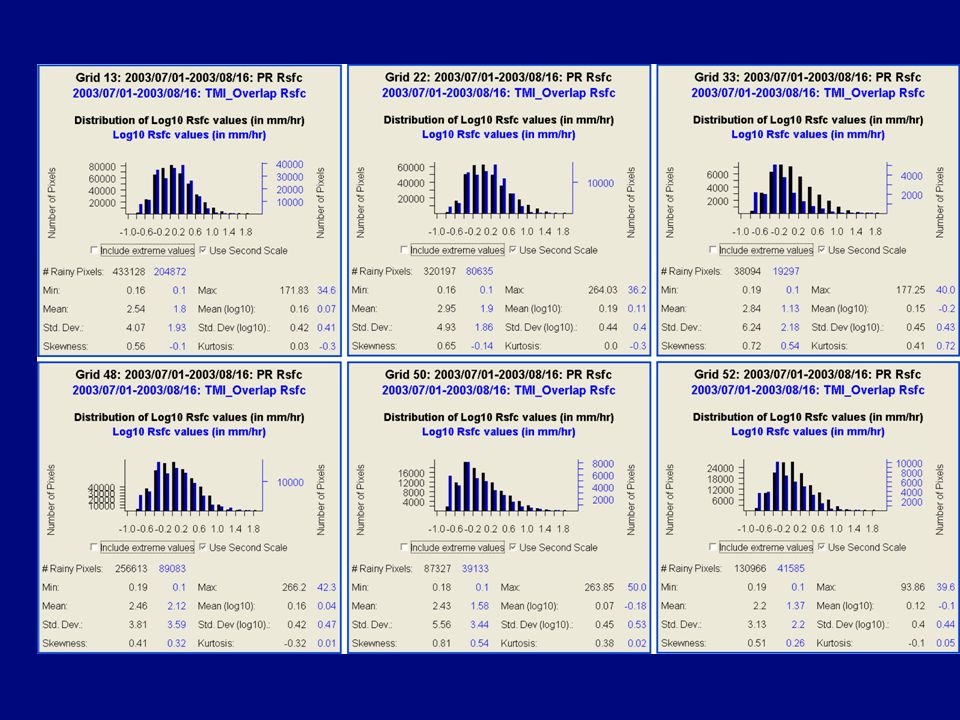
Comparing rain distributions Rescaled PR against TMI

78
Histogram window

79
Raymond et al. (2004)
")
Similar presentations


 Atlas (1989)>")

. Why TRMM? n Tropical Rainfall Measuring Mission (TRMM) is a joint US-Japan study initiated in 1997 to study.>")


 Chris Fairall, Taneil Uttal (NOAA/ETL) Bob Weller.>")