Download presentation
Presentation is loading. Please wait.

1
Population Pyramids

2
What is a population pyramid? –a graph showing the distribution of a population by sex and age.

3
Examples

4
What are population pyramids used for? To describe the population characteristics of different societies To predict future growth trends.

5
Think…. How many children would you have if you had to run a farm with just you and your family? Does that still happen? What will the population pyramid for those places look like?

6
Developing Country Rapid Population Growth This pyramid represents countries that have not gone through the industrial revolution. Families have 5 or more children per family.

8
Which one is closest to what the United States’ pyramid would look like? ???????????? ???????????? ???????????? ???????????? ???????????? ???????????? ???????????? ????????? ????????? ????????? ????????? ????????? ????????? ?????????
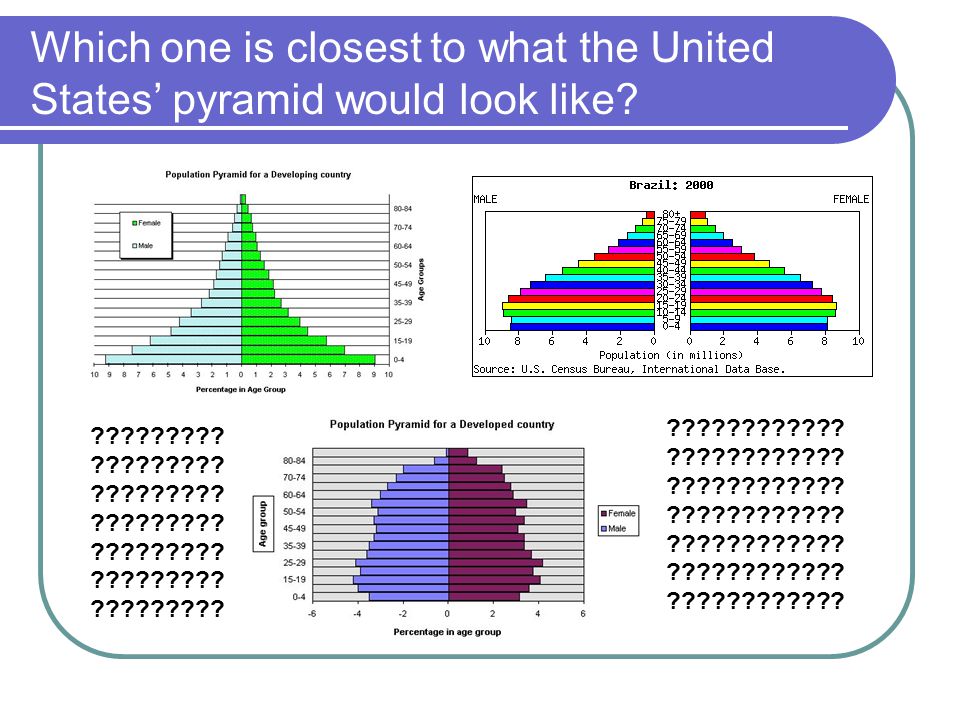
9
Ding Ding Ding if you picked this one you are correct!! This pyramid represents countries that have already gone through the industrial revolution. Families usually have 3 or less children per family.

10
Developing Country Rapid Population Growth

11
Newly Industrialized Country This represents countries that are transitioning from developing to developed.

12
Newly Industrialized countries

13
Developed Country Slow Population Growth

16
Developed - Stage 5

17
Words you need to know!!!! Birthrate- The ratio of total live births to total population in a specified community or area over a specified period of time. Death Rate- The ratio of total deaths to total population in a specified community or area over a specified period of time. Population Distribution- Where do the people live with in an area. Population Density- How many people live in a given area. Infant Mortality Rate- the number of infant deaths per 1000 live births Life Expectancy-how long are people expected to live Literacy Rate- What percentage of people can read and write.

Similar presentations


 Mr Elliott SSOT.>")


 Identify density-dependent and density- independent limiting factors that affect populations in an ecosystem.>")