Download presentation
Presentation is loading. Please wait.

1
MATERI 7 DAN 8 SEX LINKAGE DAN CROSSING OVER

2
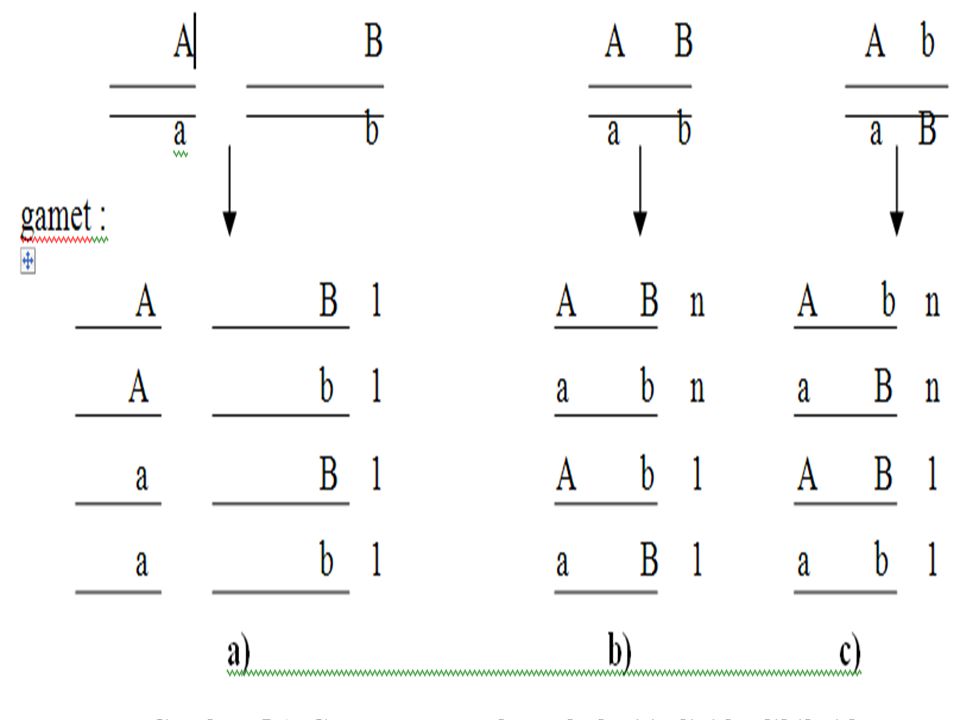
Gamet yang terbentuk dari individu dihibrid

4
A.Gen tidak berangkai B.Kedua Gen berangkai : Couple Phases, Kedudukan Sis Cara penulisan: (AB) ab C. Kedua Gen berangkai : Repulsion Phases, Kedudukan Trans Cara penulisan: (Ab) aB
 aB.")
5
Lalat Drosophila gen terangkai: Cu = gen untuk sayap normal cu = gen untuk sayap keriput Sr = gen untuk dada polos (normal) sr = gen untuk dada bergaris-garis Cu Sr cu sr Cu sr cu Sr Gen terangkai susunan sis Gen terangkai susunan Trans
 sr = gen untuk dada bergaris-garis Cu Sr cu sr Cu sr cu Sr Gen terangkai susunan sis Gen terangkai susunan Trans")
6
Rangkai Sempurna Susunan sis Lalat jantan sayap keriput dada bergaris dikawinkan dengan lalat betina bersayap normal (sayap dan dadanya) homozigot Cu Sr cu sr Betina jantan Cu Sr cu sr F1 F2 : 3 : 0 ; 0 ; 1
 homozigot Cu Sr cu sr Betina jantan Cu Sr cu sr F1 F2 : 3 : 0 ; 0 ; 1")
8
Rangkai Sempurna Sususan Trans

9
Crossing Over of John Edward’s Chromosomes Linkage & Mapping

10
Eukaryotic chromosomes are long ds DNA molecules Typical chromosome contains thousands of genes (loci) Linkage loci located on the same chromosome linked loci tend to be transmitted as a unit Linkage
 Linkage loci located on the same chromosome linked loci tend to be transmitted as a unit Linkage")
11
Because they are a group of genes linked together, chromosomes are functionally linkage groups # of linkage groups = the # of types of chromosomes Crossing over causes loci that are far apart on the same chromosome to sometimes independently assort known as incomplete linkage

12
Crossing Over Produce Recombinant Phenotypes Crossing over (meiotic recombination) Occurs during prophase I of meiosis at the bivalent stage zygotene - pachytene - diplotene Non-sister chromatids of homologous chromosomes exchange DNA segments
 Occurs during prophase I of meiosis at the bivalent stage zygotene - pachytene - diplotene Non-sister chromatids of homologous chromosomes exchange DNA segments")
13
Figure 5.1 Linkage Prevents Independent Assortment

14
Figure 5.1 gametes with a combination of alleles NOT found in the original chromosomes as a result of meiotic recombination These are termed parental gametes These are called nonparental or recombinant gametes Crossing Over May Produce Recombinant Phenotypes

15
Example of Linkage Bateson and Punnett conducted a cross in sweet pea involving two traits Flower color and pollen shape Dihybrid cross expected to give 9:3:3:1 phenotypic ratio of F 2 phenotypes Observed linkage Called it coupling

16
Purple flowers, long pollen Purple flowers, round pollen Red flowers, long pollen Red flowers, round pollen 296 19 27 85 15.6 1.0 1.4 4.5 240 80 27 93319331 Observed number Observed Ratio Expected Ratio Expected number Purple flowers, long pollen (PPLL) F 2 offspring phenotypes F 1 offspring Purple flowers, long pollen (PpLl) Self-fertilization x Red flowers, round pollen (ppll) Example of Linkage (9:3:3:1) P P NP
 F 2 offspring phenotypes F 1 offspring Purple flowers, long pollen (PpLl) Self-fertilization x Red flowers, round pollen (ppll) Example of Linkage (9:3:3:1) P P NP")
17
Morgan Provided Evidence for the Linkage of Several X-linked Genes The first direct evidence of linkage came from studies of Thomas Hunt Morgan Morgan investigated several traits that followed an X-linked pattern of inheritance Body color Eye color Wing length

18
Linkage to a Particular Chromosome Tan body, red eyes, normal wings Tan body, red eyes, miniature wings Tan body, white eyes, normal wings Tan body, white eyes, miniature wings Yellow body, red eyes, normal wings Yellow body, red eyes, miniature wings Yellow body, white eyes, normal wings Yellow body, white eyes, miniature wings 439 208 1 5 7 0 178 365 319 193 0 11 5 0 139 335 758 401 1 16 12 0 317 700 FemalesMalesTotal y w m/y w m y + w + m + / y w m F 2 generation F 1 generation F 1 generation contains wild-type females and yellow-bodied, white-eyed, miniature-winged males. x y w m / Y x y + w + m + Y Sex linkage of all traits places them all on X chromosome / P P

19
5-13 Copyright ©The McGraw-Hill Companies, Inc. Permission required for reproduction or display Morgan observed a much higher proportion of the combinations of traits found in the parental generation P Males P Females Morgan’s explanation: All three genes are located on the X chromosome Therefore, they tend to be transmitted together as a unit

20
However, Morgan still had to interpret two key observations Why did the F 2 generation have a significant number of nonparental combinations? Why was there a quantitative difference between the various nonparental combinations? Morgan Provided Evidence for the Linkage of Several X-linked Genes

21
Gray body, red eyes1,159 Yellow body, white eyes1,017 Gray body, white eyes 17 Yellow body, red eyes 12 Total2,205 Reorganize Morgan’s data considering pairs of genes separately Red eyes, normal wings 770 White eyes, miniature wings 716 Red eyes, miniature wings 401 White eyes, normal wings 318 Total2,205 It was fairly common to get this nonparental combination But this nonparental combination was rare

22
Figure 5.4 These parental phenotypes are the most common offspring because the genes are far apart These recombinant offspring are not uncommon

23
Figure 5.4 because the genes are very close together These recombinant offspring are fairly uncommon These recombinant offspring are very unlikely 1 out of 2,205 it is product of single cross over probabilities

24
Incomplete Linkage Linked loci that are sometimes separated by recombination are inherited in a pattern between linked and independently assorting not always together not present in normal dihybrid ratios The percentage of offspring with the loci linked vs those with the loci separated is a measure of the physical distance separating the loci on the chromosome

25
An undergraduate in the laboratory of T. H. Morgan Constructed first genetic map in 1911 Sturtevant wrote: “In conversation with Morgan … I suddenly realized that the variations in the length of linkage, already attributed by Morgan to differences in the spatial orientation of the genes, offered the possibility of determining sequences [of different genes] in the linear dimension of the chromosome. I went home and spent most of the night (to the neglect of my undergraduate homework) in producing the first chromosome map, which included the sex-linked genes, y, w, v, m, and r, in the order and approximately the relative spacing that they still appear on the standard maps.” Alfred Sturtevant’s Analysis
 in producing the first chromosome map, which included the sex-linked genes, y, w, v, m, and r, in the order and approximately the relative spacing that they still appear on the standard maps. Alfred Sturtevant’s Analysis.")
26
Estimating the relative distances between linked genes, based on the amount of recombination occuring between them allows us to generate genetic maps If the genes are far apart many recombinant offspring If the genes are close very few recombinant offspring Map distance = Number of recombinant offspring Total number of offspring X 100 The units of distance are called map units (mu) They are also referred to as centiMorgans (cM) One map unit is equivalent to 1% recombination frequency Linkage and Genetic Maps
 They are also referred to as centiMorgans (cM) One map unit is equivalent to 1% recombination frequency Linkage and Genetic Maps")
27
Genetic mapping experiments are typically accomplished by carrying out a testcross Example of a two-point mapping cross Cross of two linked genes affecting bristle length and body color in fruit flies e = ebony body color + = gray body color s = short bristles + = normal bristles One parent double recessive (homozygous recessive at both loci) – s/s ; e/e Other parent is heterozygous at both loci (+/s ; +/e) Linkage Analysis and Mapping
 – s/s ; e/e Other parent is heterozygous at both loci (+/s ; +/e) Linkage Analysis and Mapping")
28
5-47 Figure 5.9 Chromosomes are the product of a crossover during meiosis in the heterozygous parent Recombinant offspring are fewer in number than nonrecombinant offspring

29
The phenotype data are used to estimate the distance between the two loci Map distance = Number of recombinant offspring Total number of offspring X 100 Therefore, the s and e genes are 12.3 map units apart from each other along the same chromosome 76 + 75 542 + 537 + 76 + 75 X 100= = 12.3 map units Linkage Analysis and Mapping

30
Data from trihybrid crosses can also yield information about map distance and gene order The following experiment outlines a common strategy for using trihybrid crosses to map genes In this example, we will consider fruit flies that differ in body color, eye color and wing shape 5-59 Copyright ©The McGraw-Hill Companies, Inc. Permission required for reproduction or display Trihybrid Crosses b = black body color b + = grey body color pr = purple eye color pr + = red eye color vg = vestigial wings vg + = normal wings

31
Copyright ©The McGraw-Hill Companies, Inc. Permission required for reproduction or display 5-60 Step 1: Cross two true-breeding strains that differ at three loci. Female is mutant for all three traits Male is homozygous wildtype for all three traits The goal in this step is to obtain F1 individuals that are heterozygous for all three genes

32
Copyright ©The McGraw-Hill Companies, Inc. Permission required for reproduction or display 5-61 Step 2: Perform a testcross by mating F 1 female heterozygotes to homozygous recessive, male flies During gametogenesis in the heterozygous female F 1 flies, crossovers may produce new combinations of the 3 alleles

33
Copyright ©The McGraw-Hill Companies, Inc. Permission required for reproduction or display 5-62 Step 3: Collect data for the F 2 generation Phenotype Number of Observed Offspring (males and females) Gray body, red eyes, normal wings411 Gray body, red eyes, vestigial wings 61 Gray body, purple eyes, normal wings 2 Gray body, purple eyes, vestigial wings 30 Black body, red eyes, normal wings 28 Black body, red eyes, vestigial wings 1 Black body, purple eyes, normal wings 60 Black body, purple eyes, vestigial wings412
 Gray body, red eyes, normal wings411 Gray body, red eyes, vestigial wings 61 Gray body, purple eyes, normal wings 2 Gray body, purple eyes, vestigial wings 30 Black body, red eyes, normal wings 28 Black body, red eyes, vestigial wings 1 Black body, purple eyes, normal wings 60 Black body, purple eyes, vestigial wings412.")
34
5-63 Copyright ©The McGraw-Hill Companies, Inc. Permission required for reproduction or display Analysis of the F 2 generation flies will allow us to map the three genes The three genes exist as two alleles each Therefore, there are 2 3 = 8 possible combinations of offspring If the genes assorted independently, all eight combinations would occur in equal proportions It is obvious that they are far from equal In the offspring of crosses involving linked genes, Parental phenotypes occur most frequently Double crossover phenotypes occur least frequently Single crossover phenotypes occur with “intermediate” frequency

35
5-64 Copyright ©The McGraw-Hill Companies, Inc. Permission required for reproduction or display The combination of traits in the double crossover tells us which gene is in the middle A double crossover separates the gene in the middle from the other two genes at either end In the double crossover categories, the recessive purple eye color is separated from the other two recessive alleles Thus, the gene for eye color lies between the genes for body color and wing shape

36
Copyright ©The McGraw-Hill Companies, Inc. Permission required for reproduction or display 5-65 Step 4: Calculate the map distance between pairs of genes To do this, one strategy is to group the data according to pairs of phenotypes resulting from non-crossovers, single crossovers, & double crossovers

37
Copyright ©The McGraw-Hill Companies, Inc. Permission required for reproduction or display 5-71 PhenotypeNumber of Observed Offspring Gray body, purple eyes, vestigial wings 30 Black body, red eyes, normal wings 28 Gray body, red eyes, vestigial wings 61 Black body, purple eyes, normal wings 60 Gray body, purple eyes, normal wings 2 Black body, red eyes, vestigial wings 1 30 + 28 1,005 = 0.058 Single crossover between b and pr 61 + 60 1,005 = 0.120 Single crossover between pr and vg 1 + 2 1,005 = 0.003 Double crossover, between b and pr, and between pr and vg

38
Copyright ©The McGraw-Hill Companies, Inc. Permission required for reproduction or display 5-72 To determine the map distance between the genes, we need to consider both single and double crossovers To calculate the distance between b and pr Map distance = (0.058 + 0.003) X 100 = 6.1 mu To calculate the distance between pr and vg Map distance = (0.120 + 0.003) X 100 = 12.3 mu To calculate the distance between b and vg The double crossover frequency needs to be multiplied by two Because both crossovers are occurring between b and vg Map distance = (0.058 + 0.120 + 2[0.003]) X 100 = 18.4 mu
 X 100 = 6.1 mu To calculate the distance between pr and vg Map distance = ( ) X 100 = 12.3 mu To calculate the distance between b and vg The double crossover frequency needs to be multiplied by two Because both crossovers are occurring between b and vg Map distance = ( [0.003]) X 100 = 18.4 mu.")
39
Copyright ©The McGraw-Hill Companies, Inc. Permission required for reproduction or display 5-69 Step 5: Construct the map Based on the map unit calculation the body color and wing shape genes are farthest apart The eye color gene is in the middle The data is also consistent with the map being drawn as vg – pr – b (from left to right) In detailed genetic maps, the locations of genes are mapped relative to the centromere
 In detailed genetic maps, the locations of genes are mapped relative to the centromere.")
40
Copyright ©The McGraw-Hill Companies, Inc. Permission required for reproduction or display 5-73 Alternatively, the distance between b and vg can be obtained by simply adding the map distances between b and pr, and between pr and vg Map distance = 6.1 + 12.3 = 18.4 mu

41
The product rule allows us to predict the likelihood of a double crossover from the individual probabilities of each single crossover Interference P (double crossover) =P (single crossover between b and pr) P (single crossover between pr and vg) X = 0.061 X 0.123 = 0.0075 Based on a total of 1,005 offspring t he expected number of double crossover offspring is = 1,005 X 0.0075 = 7.5
 =P (single crossover between b and pr) P (single crossover between pr and vg) X = X = Based on a total of 1,005 offspring t he expected number of double crossover offspring is = 1,005 X = 7.5")
42
Copyright ©The McGraw-Hill Companies, Inc. Permission required for reproduction or display 5-75 Therefore, we would expect seven or eight offspring to be produced as a result of a double crossover However, the observed number was only three! Two with gray bodies, purple eyes, and normal sings One with black body, red eyes, and vestigial wings This lower-than-expected value is due to a common genetic phenomenon, termed positive interference The first crossover decreases the probability that a second crossover will occur nearby Interference

43
Interference (I) is expressed as I = 1 – C where C is the coefficient of coincidence C = Observed number of double crossovers Expected number of double crossovers 3 7.5 C = I = 1 – C = 1 – 0.4 = 0.6 or 60% This means that 60% of the expected number of crossovers did not occur = 0.40
 is expressed as I = 1 – C where C is the coefficient of coincidence C = Observed number of double crossovers Expected number of double crossovers C = I = 1 – C = 1 – 0.4 = 0.6 or 60% This means that 60% of the expected number of crossovers did not occur = 0.40")
44
Copyright ©The McGraw-Hill Companies, Inc. Permission required for reproduction or display 5-77 Since I is positive, this interference is positive interference Rarely, the outcome of a testcross yields a negative value for interference This suggests that a first crossover enhances the rate of a second crossover The molecular mechanisms that cause interference are not completely understood However, most organisms regulate the number of crossovers so that very few occur per chromosome

45
Somatic Cell Hybridization Fusion of human cell and rodent cell Eventually, most human sequences lost entire chromosomes, portions (arms) of chromosomes Lines carrying sub-sets of human chromosomes are compared to determine which express the given gene product have to have a detectible DNA sequence or protein Process of elimination determines on which chromosome (region of chromosome) a gene is located Hybrid Panel
 of chromosomes Lines carrying sub-sets of human chromosomes are compared to determine which express the given gene product have to have a detectible DNA sequence or protein Process of elimination determines on which chromosome (region of chromosome) a gene is located Hybrid Panel")
46
Other Mapping Techniques Cytogenetic Mapping Have a mutant phenotype Perform karyotype Observe altered chromosomes aneuploidies translocations deletions Aberrant chromosome probably location of gene normal translocation t(14;17)
")
47
Patau Syndrome - Trisomy 13 Karyotype: 47, 13+

48
Partial Chromosomal Deletions cri-du-chat - 46, 5p- Fragile X mental retardation – 46, Xp- Monosomy loss of an entire chromosome lethal in all cases for autosomes XO – Turner’s syndrome is only viable monosomy

49
Mapping Strategies Deletion Mapping Cross recessive heterozygote to deletion heterozygote lines appearance of recessive phenotype localizes recessive gene within deletion interval

50
Complementation Determines if two phenotypes are caused by same mutant gene

51
Complementation Analysis

53
Complementation Analysis of Eye Color Mutations Complementation groups white, cherry, coral, apricot, buff W 1, w ch, w c, w a, w b Alleles of white gene garnet ruby vermillion carnation

54
Complementation Analysis

55
Mapping with Unknown Phase of Linkage When you have heterozygotes, but do not know what the phenotypes of the parents were. 12 possible diploid arrangements for 3 linked loci bm pr bm pr + + bm + + pr + brown midrib, virescent seedling, purple aleurone

56
Use Results of Cross to Determine Phase of Linkage NCOs = parental chromosomes = phase DCOs = fewest Do not directly detect middle locus

57
NCO Gives 3 Possibilities for Phase 12 possible diploid arrangements for 3 linked loci bm pr bm pr + + bm + + pr +

58
DCO Gives Loci Order

Similar presentations


 Gray body Red eyes Normal wings Red.>")


 – Meiosis (238 – 249) II. Mendelian Genetics III. Chromosomal Genetics IV. Molecular.>")


 Studied genetics of Drosophila melangaster (the common.>")


