Download presentation
Presentation is loading. Please wait.

1
Adequate Yearly Progress 2012 Comfort ISD

2
Measures Evaluated Reading/ELA – Percent of students (Grades 3-8 and 10) who are Proficient in Reading/ELA – Percent of students (Grades 3-8 and 10) who Participate in Reading/ELA Math – Percent of students (Grades 3-8 and 10) who are Proficient in Math – Percent of students (Grades 3-8 and 10) who Participate in Math Other – Attendance Rate For elementary and middle school campuses Districts not offering 12 th grade – Graduation Rate For high school campuses Districts offering 12 th grade
 who are Proficient in Reading/ELA – Percent of students (Grades 3-8 and 10) who Participate in Reading/ELA Math – Percent of students (Grades 3-8 and 10) who are Proficient in Math – Percent of students (Grades 3-8 and 10) who Participate in Math Other – Attendance Rate For elementary and middle school campuses Districts not offering 12 th grade – Graduation Rate For high school campuses Districts offering 12 th grade")
3
Standards for Performance 2011-122012-132013-142010-112009-10 67 75 83 92 100 % Proficient Math 73 80 87 93 Reading % of students must pass in 2014

4
Student Groups Evaluated Performance Accountability Subset Participation All Students Enrolled Other Indicator Attendance & Graduation* All Students Group African American* Hispanic* White* Economically Disadvantaged* Special Education* Limited English Proficient* All Students Group African American* Hispanic* White* Economically Disadvantaged* Special Education* Limited English Proficient* All Students Group African American* Hispanic* White* Economically Disadvantaged* Special Education* Limited English Proficient* Provided that these groups meet the Minimum Size Requirement. 200 = Always Evaluated | 50-200 = Evaluated if equal to at least 10% of the All Student group *

5
AYP Status Labels Met AYP Missed AYP – (Reason) Reasons include: Math (Proficiency and/or Participation) Reading (Proficiency and/or Participation) Attendance Rate Graduation Rate
 Reasons include: Math (Proficiency and/or Participation) Reading (Proficiency and/or Participation) Attendance Rate Graduation Rate")
7
2 3 1 Accessing the AYP Report

8
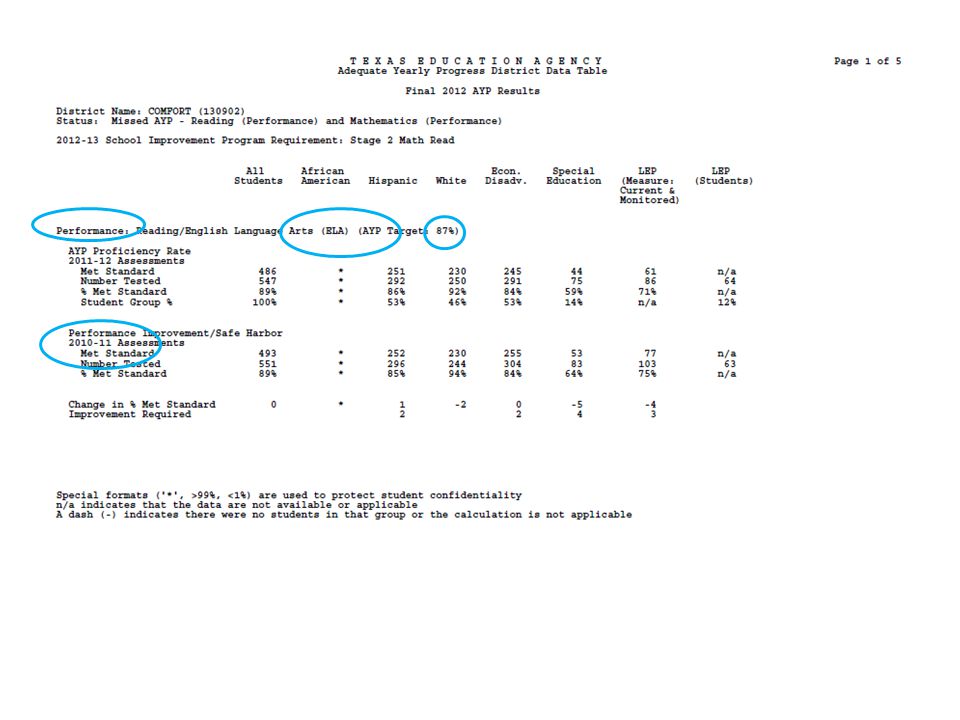
2012 AYP Report Overview Page One Performance: Reading/ELA – 87% Proficient Reading Performance, 2011-2012 – Used to demonstrate proficiency. Reading Performance, 2010-2011 – Used to calculate improvement (Safe Harbor).
..")
10
Performance: Mathematics – 83% Proficient Math Performance, 2011-2012 – Used to demonstrate proficiency. Math Performance, 2010-2011 – Used to calculate improvement (Safe Harbor). 2012 AYP Report Overview Page Two
 AYP Report Overview Page Two.")
12
Participation: Reading/ELA & Mathematics – 95% Participation Reading/ELA & Math Participation, 2011- 2012 – Used to demonstrate participation. Reading/ELA & Math Participation, 2010- 2011 – Used to calculate 2 year average, if needed. 2012 AYP Report Overview Page Three

14
Graduation Rate (75%) or Attendance Rate (90%) Graduation or Attendance Rate, 2011-2012 – Used to calculate whether or not the campus or district met the target rate. Graduation or Attendance Rate, 2010-2011 – Used to demonstrate improvement. 5 Year Longitudinal Graduation Rate, 2011- 2012 – Class of 2010 2012 AYP Report Overview Page Four

16
AYP Explanation Table Summarizes the results of the AYP report 2012 AYP Report Overview Page Five

18
2012 AYP Status Comfort ISD Campus Name2012 StatusStage Comfort Elementary School Missed AYP (Reading) Missed AYP (Math) None Comfort Middle SchoolMissed AYP (Math)Stage 1, Year 1 Math Comfort High SchoolMet AYPNone
 Missed AYP (Math) None Comfort Middle SchoolMissed AYP (Math)Stage 1, Year 1 Math Comfort High SchoolMet AYPNone")
19
CES – Reading 2010 – 73%2011- 80%2012– 87% AllMet HispanicMet Missed – 85% WhiteMet Econ. Disadv.Met Missed – 82% Special EducationN/A LEPN/A CES – Math 2010 – 67%2011- 75%2012– 83% AllMet Missed – 80% HispanicMet Missed – 74% WhiteMet Econ. Disadv.Met Missed – 72% Special EducationN/A LEPN/A

20
CMS – Reading 2010 – 73%2011- 80%2012– 87% AllMet HispanicMet Missed – 86% WhiteMet Econ. Disadv.Met Missed – 85% Special EducationN/A LEPN/A CMS – Math 2010 – 67%2011- 75%2012– 83% AllMet Missed – 79% HispanicMetMissed – 68%MET-RI WhiteMet Econ. Disadv.MetMissed – 67%MET-RI Special EducationN/A LEPN/A

21
CHS – Reading 2010 – 73%2011- 80%2012– 87% AllMet HispanicN/A WhiteN/A Econ. Disadv.N/A Special EducationN/A LEPN/A CHS – Math 2010 – 67%2011- 75%2012– 83% AllMetMissed – 70%MET- RI HispanicN/A WhiteN/A Econ. Disadv.N/A Special EducationN/A LEPN/A

22
2012 AYP Performance Reading/English Language Arts - (Grades 3-8 and 10)
")
23
2012 AYP Performance Mathematics- (Grades 3-8 and 10)
")
24
2012 AYP Participation Reading/English Language Arts - (Grades 3-8 and 10)
")
25
2012 AYP Participation Mathematics- (Grades 3-8 and 10)
")
26
2012 AYP Graduation Rate For High Schools and Districts with a 12 th Grade

Similar presentations


 U.S. Department of Education Adapted by TEA September 2003.>")


 “No Child Left Behind” (2002) Adequacy Committee February 6,2008.>")


 Needs Assessment (Why ) Improvement Plan (How) Implement and Monitor.>")


 & CAHSEE 2009-10 Results Update Prepared for the September 21, 2010 Board of Education.>")


 Results Lodi Unified School District Prepared by the Assessment, Research, and Evaluation August 17, 2010 Board Study.>")


>")
 Michigan Department of Education Office of Psychometrics, Accountability, Research, & Evaluation Summer.>")