Download presentation
Presentation is loading. Please wait.

1
WEST VIRGINIA DIVISION OF ENERGY

2
West Virginia Coal and Energy Trends

4
WEST VIRGINIA DIVISION OF ENERGY West Virginia Coal Production Source: EIA Year Coal Production (in thousand short tons) 2002150,078 2003139,711 2004147,993 2005153,650 2006152,374 2007153,480 2008157,778 2009137,127 2010135,220 2011134,662 2012120,138 2013112,876 Coal Production in million short tons
 , , , , , , , , , , , ,876 Coal Production in million short tons")
5
WEST VIRGINIA DIVISION OF ENERGY West Virginia Coal Production by County, 2013 Source: WV Office of Miner’s Health Safety and Training Tons Produced in 2013

6
WEST VIRGINIA DIVISION OF ENERGY Source: EIA - Annual Coal Distribution Report 2013 Domestic Distribution of West Virginia Coal, 2013 Tons Distributed

7
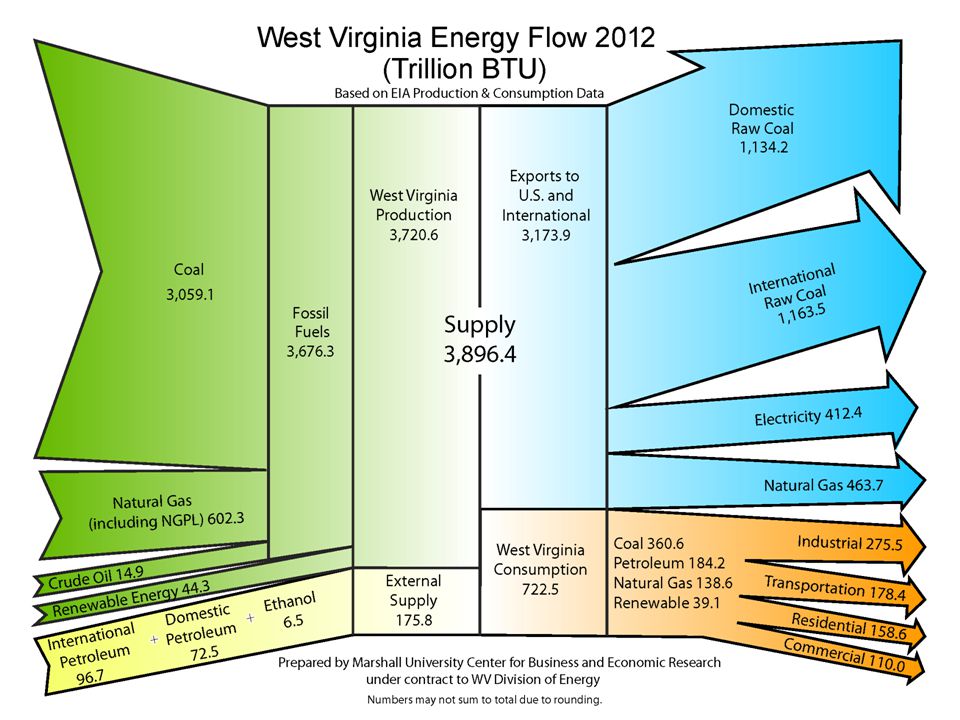
WEST VIRGINIA DIVISION OF ENERGY Source: EIA * 2013 volume estimated by MU CBER.

8
WEST VIRGINIA DIVISION OF ENERGY EIA Annual Energy Outlook 2014 U.S. Coal Projections (Base Case) U.S. total coal production will grow an average 0.3% per year through 2040. U.S. coal exports will increase gradually from 126 million tons in 2012 to 160 million tons in 2035 and remain constant through 2040 U.S. coal consumption is expected to increase 0.3% annually from 2012 to 2040, remaining between the 2011 and 2012 levels for the entire period Source: EIA Annual Energy Outlook 2014
 U.S. total coal production will grow an average 0.3% per year through U.S. coal exports will increase gradually from 126 million tons in 2012 to 160 million tons in 2035 and remain constant through 2040 U.S. coal consumption is expected to increase 0.3% annually from 2012 to 2040, remaining between the 2011 and 2012 levels for the entire period Source: EIA Annual Energy Outlook")
9
WEST VIRGINIA DIVISION OF ENERGY Consensus Forecast for WV Coal Production (million short tons), 2014
, 2014")
10
WEST VIRGINIA DIVISION OF ENERGY Coal to the WV Electric Power Sector, 2013 36,042 thousand short tons of WV coal was exported to the Electric Power Sector in other states. Source: EIA

11
WEST VIRGINIA DIVISION OF ENERGY Source: EIA

12
WEST VIRGINIA DIVISION OF ENERGY

13
World Energy Consumption Source: EIA International Energy Outlook

14
WEST VIRGINIA DIVISION OF ENERGY West Virginia Natural Gas Production Source: WV Geological and Economic Survey *West Virginia did not independently record Marcellus production before 2005. Year Natural Gas Production From Marcellus Shale (in Mcf) 2002202,130,029-* 2003202,061,508-* 2004210,513,371-* 2005216,934,506853,565 2006223,149,3844,555,266 2007233,970,53410,065,002 2008257,301,63219,325,834 2009265,315,40433,640,837 2010297,876,64474,439,147 2011400,791,090149,915,861 2012538,759,150301,700,000 2013742,375,637541,300,000
 ,130,029-* ,061,508-* ,513,371-* ,934,506853, ,149,3844,555, ,970,53410,065, ,301,63219,325, ,315,40433,640, ,876,64474,439, ,791,090149,915, ,759,150301,700, ,375,637541,300,000.")
15
WEST VIRGINIA DIVISION OF ENERGY Regional Natural Gas Net Exports, 2013 (BCF) Source: EIA and MU CBER calculations. NY DE MD NJ PA OH WV VAKY TN NC

16
WEST VIRGINIA DIVISION OF ENERGY U.S Natural Gas Prices Historical Data, through Dec. 2014

17
WEST VIRGINIA DIVISION OF ENERGY Henry Hub Natural Gas Price Recent and Projections

18
WEST VIRGINIA DIVISION OF ENERGY Source: EIA

19
WEST VIRGINIA DIVISION OF ENERGY Hydro Power Total Capacity: 463.1 MW Hawks Nest Hydro Facility Licensed WV Hydro Facilities NameCapacity (MW)LicenseeWaterway Belleville42.0American Minicipal Power, IncOhio River Dam No. 41.9PE Hydro Generation LLCPotomac River Dam No. 51.2PE Hydro Generation LLCPotomac River Hawks Nest & Glen Ferris108.2Hawks Nest Hydro, LLCNew River Jennings Randolph14.0Fairlawn Hydroelectric Co., LLCPotomac River Lake Lynn51.2Lake Lynn Generation, LLCMonongahela River London/Marmet28.8Appalachian Power Co. (VA)Kanawha River Millville2.8PE Hydro Generation LLCShenandoah River New Martinsville35.7City of New Martinsville (WV)Ohio River Racine47.5AEP Generation Resources, Inc.Ohio River Summersville80.0City of Summersville (WV)Gauley River Willow Island L&D35.0American Minicipal Power, IncOhio River Winfield14.8Appalachian Power Co. (VA)Kanawha River
Kanawha River Millville2.8PE Hydro Generation LLCShenandoah River New Martinsville35.7City of New Martinsville (WV)Ohio River Racine47.5AEP Generation Resources, Inc.Ohio River Summersville80.0City of Summersville (WV)Gauley River Willow Island L&D35.0American Minicipal Power, IncOhio River Winfield14.8Appalachian Power Co. (VA)Kanawha River.")
20
WEST VIRGINIA DIVISION OF ENERGY Hydro Power, Continued Total Preliminary Permit Capacity: 66.8 MW Opekiska Lock and Dam Preliminary Permitted WV Hydro Facilities NameCapacity (MW)LicenseeWaterway Hildebrand Lock & Dam7.5Lock+Hydro Friends Fund XLVIMonongahela River New Cumberland Locks & Dam49.8FFP Project 121 LLCOhio River Stonewall Jackson0.3Mahoning Hydropower, LLCWest Fork River Sutton9.2James R. RobertsonElk River

21
WEST VIRGINIA DIVISION OF ENERGY Wind Power NedPower Mount Storm Operating Capacity: 583.1 MW WV Wind Farms Operating NameCapacity (MW)OperatorCounty Beech Ridge Energy, LLC100.5Invenergy Services, LLCGreenbrier Laurel Mountain97.6AES Wind Generation, Inc.Randolph Mountaineer Wind Energy Center66.0FPL Energy, LLCTucker NedPower Mount Storm264.0Shell Wind Energy, Inc.Grant Pinnacle Wind Force, LLC55.0Edison Mission EnergyMineral Under Construction NameCapacity (MW)OperatorCounty New Creek*160.0AES Wind Generation, Inc.Grant *A construction extension was granted by the PSC in September 2014. AES Wind Generation, Inc. is looking for a buyer for the project. (Construction has been stalled since early 2012.)
.")
22
WEST VIRGINIA DIVISION OF ENERGY Data Source: EIA Graphic created by Marshall University CBER Net Interstate Electricity Trade (in short tons), 2012
, 2012")
23
WEST VIRGINIA DIVISION OF ENERGY 2012 State Rankings by Net Interstate Electricity Trade Volume Data Source: EIA Graphic created by Marshall University CBER

24
WEST VIRGINIA DIVISION OF ENERGY EIA Electric Trends EIA expects total U.S. generation of electricity to grow by 1.1% in 2015 and 0.9% in 2016. The share of generation fueled by coal falls from 39.0% in 2014 to 37.6% in 2016. Natural-gas-fired generation accounted for a 27.3% share of total generation during 2014 and is expected to increase to a 28.1% share in 2016 as a result of declining natural gas prices. EIA Short-Term Energy Outlook January 2014

25
WEST VIRGINIA DIVISION OF ENERGY Source: EIA Annual Energy Outlook 2014

26
WEST VIRGINIA DIVISION OF ENERGY Source: EDGAR, Emission Database for Global Atmospheric Research World CO 2 Emissions – The Top 10 (million metric tons) 20102013Change China8,69310,28118% U.S.5,5005,298-4% India1,7762,07217% Russian Federation1,7101,8035% Japan1,2371,36110% Germany8228453% Korea, Republic of5916276% Canada5535510% Brazil43551218% Indonesia4514878%
 Change China8,69310,28118% U.S.5,5005,298-4% India1,7762,07217% Russian Federation1,7101,8035% Japan1,2371,36110% Germany % Korea, Republic of % Canada % Brazil % Indonesia %")
27
WEST VIRGINIA DIVISION OF ENERGY Source: EIA Monthly Energy Review, December 2014 U.S. Carbon Dioxide Emissions from Energy Consumption

28
WEST VIRGINIA DIVISION OF ENERGY EPA 40 CR Part 60 EPA Clean Power Plan Proposed Rule Tasks state environmental agencies to develop a plan that will reduce carbon emissions from existing power plants. Emissions reduction goals set by EPA. Emissions reduction targets to be met by 4 “building blocks.” –Electric Generating Unit (EGU) heat rate improvement –Re-dispatch coal-fired generation to natural gas combined cycle Generation –Expand low- or zero-carbon (renewable) generating capacity –Expand use of demand side-efficiency
 heat rate improvement –Re-dispatch coal-fired generation to natural gas combined cycle Generation –Expand low- or zero-carbon (renewable) generating capacity –Expand use of demand side-efficiency.")
29
WEST VIRGINIA DIVISION OF ENERGY EPA Clean Power Plan TSD EPA Clean Power Plan Proposed Rule Environmental Protection Agency Clean Power Plan: West Virginia Goals 2020202120222023202420252026202720282029 MWh Existing and Incremental Renewable Net Electric Generation 2,451,2062,874,2623,370,3343,952,0234,634,1075,433,9126,371,7567,471,4648,760,97210,273,036 % of Avoided MWh Sales Demand Side Energy Efficiency 1.77%2.62%3.60%4.70%5.83%6.86%7.81%8.66%9.43%10.11% West Virginia Proposed Goals EGU Heat Rate Improvement:6% Redispatch Coal Generation:0 MWh (No NGCC)
")
30
WEST VIRGINIA DIVISION OF ENERGY Clean Power Plan Renewable Energy Goals for West Virginia Total EPA Goal Feasible New Wind Feasible New Biomass Feasible New Hydro Installed Solar or Purchased Wind to Meet Goal 2030 MWh10,273,026760,368595,680440,1028,476,876 % of Goal100%7.4%5.8%4.3%82.5% Additional Installed MW 6,983310200123 650 (solar) 3,100 (purchased wind) Capacity Factor 28%34%41%15% (solar) 28% (wind) Estimates of Feasible Additions to Wind, Hydro and Biomass Energy & Net Needed to Meet Goal
 3,100 (purchased wind) Capacity Factor 28%34%41%15% (solar) 28% (wind) Estimates of Feasible Additions to Wind, Hydro and Biomass Energy & Net Needed to Meet Goal")
31
WEST VIRGINIA DIVISION OF ENERGY Thank you.

Similar presentations


 Source: U.S. Energy Information Administration, Annual Energy Review 2009, Tables.>")


 November 7th, 2006 Northwest Energy: A Look at the Past, Present and Future of Electricity Generation in the Pacific Northwest.>")


