Download presentation
Presentation is loading. Please wait.

2
Correlation Coefficient Measures how related 2 variables are Measures how related 2 variables are Shown as #s b/t +1 and -1 Shown as #s b/t +1 and -1 Determines: Determines: – STRENGTH Closer to 1/-1 = strong correlation Closer to 1/-1 = strong correlation Closer to 0 = weak/no correlation Closer to 0 = weak/no correlation – DIRECTION (positive or negative) Determined through statistical magic! Determined through statistical magic!

3
Scatter Plots

4
1. Birth Rate (CBR) Calculated how? Calculated how? High =40+Low = <15 High =40+Low = <15 Wealth and CBR Wealth and CBR – Positive/negative correlation? – Exceptions: China (12) E. Europe (12)Low wealth and low CBR. Otherwise, high wealth, low CBR. Highest: Chad (51) and Niger (50) Highest: Chad (51) and Niger (50) Lowest: Germany/Bosnia/Japan @ 8 Lowest: Germany/Bosnia/Japan @ 8 U.S.: 13 U.S.: 13 World average = 20 World average = 20 MDCs = 11, Dev = 22, w/o China = 25, LDCs = 34 MDCs = 11, Dev = 22, w/o China = 25, LDCs = 34
 E. Europe (12)Low wealth and low CBR. Otherwise, high wealth, low CBR. Highest: Chad (51) and Niger (50) Highest: Chad (51) and Niger (50) Lowest: 8 Lowest: 8 U.S.: 13 U.S.: 13 World average = 20 World average = 20 MDCs = 11, Dev = 22, w/o China = 25, LDCs = 34 MDCs = 11, Dev = 22, w/o China = 25, LDCs = 34.")
5
2. Death Rate (CDR) Calculated? Calculated? High = 18 Low = <10 High = 18 Low = <10 Stat can change dramatically Stat can change dramatically – War, pandemic, famine, etc. – W. Hem in 16th Century was 900/1,000 Correlation Wealth and CDR? Correlation Wealth and CDR? – NOT Really? Highest: Sierra Leone (18) & E. Europe ~15 Highest: Sierra Leone (18) & E. Europe ~15 Lowest: U.A.E (1) and Qatar & Oman (2) Lowest: U.A.E (1) and Qatar & Oman (2) U.S.: 8 U.S.: 8
 & E. Europe ~15 Highest: Sierra Leone (18) & E. Europe ~15 Lowest: U.A.E (1) and Qatar & Oman (2) Lowest: U.A.E (1) and Qatar & Oman (2) U.S.: 8 U.S.: 8.")
6
3. Natural Rate of Increase (NRI) or (RNI) Calculated how? Calculated how? Ex: CBR 20 CDR 5 THEN NIR = 15/1000 = 1.5% Ex: CBR 20 CDR 5 THEN NIR = 15/1000 = 1.5% High = 2-3%Low = Less than 1% High = 2-3%Low = Less than 1% USA formula CBR 13.8 minus CDR 8.4 = 5.4/1,000 =.54% USA formula CBR 13.8 minus CDR 8.4 = 5.4/1,000 =.54% Europe: Denmark, Finland, Iceland, Ireland, Norway, Sweden, U.K., Belgium, France, Luxembourg, Netherlands, Switzerland, Albania, Kosovo, Spain have slightly pos, NRI. A number of others have a 0 or negative NRI. Why? Highest in world = Niger. Europe: Denmark, Finland, Iceland, Ireland, Norway, Sweden, U.K., Belgium, France, Luxembourg, Netherlands, Switzerland, Albania, Kosovo, Spain have slightly pos, NRI. A number of others have a 0 or negative NRI. Why? Highest in world = Niger.

7
4. Population growth rates (PGR) Calculated how? Calculated how? High = 2+%Low = <1% or negative High = 2+%Low = <1% or negative U.S.: 13.8 (CBR) – 8.4 (CDR) + Net migration 4.3 (per 1000) = 9.7/1000 =.97% U.S.: 13.8 (CBR) – 8.4 (CDR) + Net migration 4.3 (per 1000) = 9.7/1000 =.97% Population Growth trends Population Growth trends – Negative/Positive Correlations? Women’s rights Impact of immigration? Women’s rights Impact of immigration? Economic growth Economic growth Literacy rate Literacy rate
 – 8.4 (CDR) + Net migration 4.3 (per 1000) = 9.7/1000 =.97% U.S.: 13.8 (CBR) – 8.4 (CDR) + Net migration 4.3 (per 1000) = 9.7/1000 =.97% Population Growth trends Population Growth trends – Negative/Positive Correlations. Women’s rights Impact of immigration. Women’s rights Impact of immigration. Economic growth Economic growth Literacy rate Literacy rate.")
8
*Why would a country want a pro-natalist policy ? replaces those lost in war and civil unrest build up the military replace retiring folks in the workforce support the increasing number of seniors occupy parts of a country that are virtually empty help develop the resources of a state lead to economic growth increase majority/minority percentages gain more influence internationally

9
Why would a country want an anti-natalist policy ? cannot afford to provide for them overpopulation concerns - limited available resources local, national, international SCALE allow more women in the workforce and boost economy repress a group of people separate policy for certain groups or different applications of the policy (see 2 nd last slide)
.")
10
6. Doubling Time Def.? Def.? Assumption?? Constant PGR Assumption?? Constant PGR World’s doubling time is 64 years World’s doubling time is 64 years – As TFR increases, doubling time ___________. – At 1% growth rate it takes 70 years to double – At 2% growth rate takes 35 years to double U.S. = 70/.9% = 78 U.S. = 70/.9% = 78 What is Eastern Europe’s doubling time? What is Eastern Europe’s doubling time? Japan’s?? Japan’s?? Japan’s??

11
7. Dependency ratio Calculated: Calculated: (Pop. <15) + (65+) divided by working-age population (those aged 15-64) Dependency ratio tells us how strained working pop. is Dependency ratio tells us how strained working pop. is – Ex. Dependency ratio of 0.9 means there are 9 dependants for every 10 working-age people Keep in mind: Keep in mind: – Negative correlation b/t dependency ratio and the ability to take care of dependents
 + (65+) divided by working-age population (those aged 15-64) Dependency ratio tells us how strained working pop. is Dependency ratio tells us how strained working pop. is – Ex. Dependency ratio of 0.9 means there are 9 dependants for every 10 working-age people Keep in mind: Keep in mind: – Negative correlation b/t dependency ratio and the ability to take care of dependents.")
13
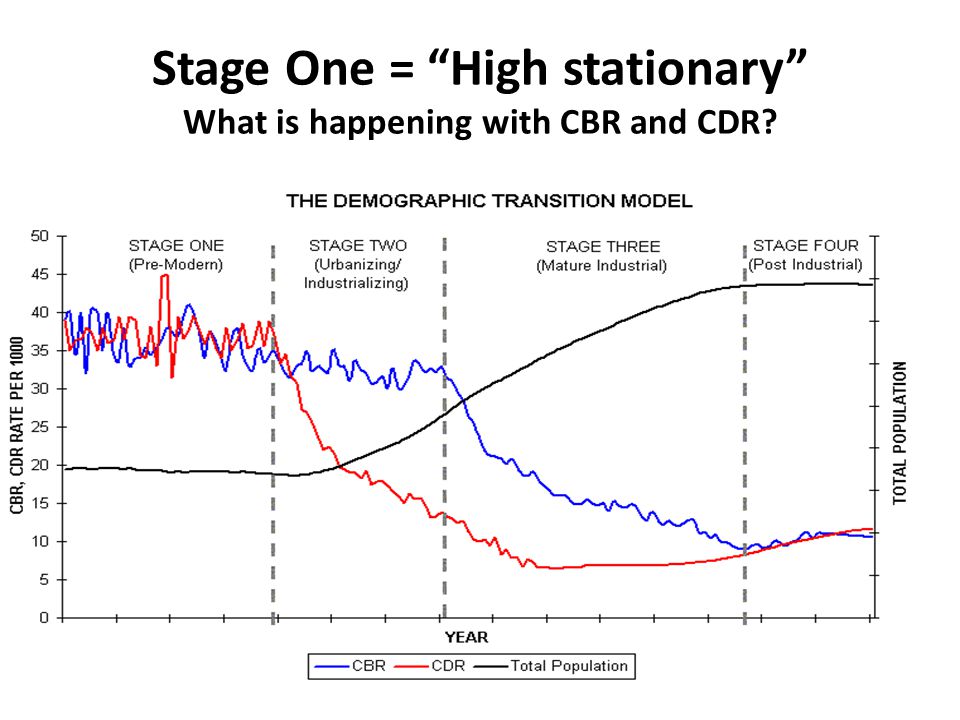
Stage One = “High stationary” What is happening with CBR and CDR?

14
Stage Two = “Early Expansion”

15
Stage Three = “Late Expanding” Declines in birth rate WHY? Declines in birth rate WHY? – Drop in IMR – Urban life too expensive/not enough space – Gains for women Increase in literacy rate Increase in literacy rate More access to education More access to education – Postponing marriage – (Contraceptives were not widely available in the first half 20 th ) MDCs moved into Stage 3 during early 20 th MDCs moved into Stage 3 during early 20 th If LDCs are in Stage 3, they did so in the last 20 years If LDCs are in Stage 3, they did so in the last 20 years
 MDCs moved into Stage 3 during early 20 th MDCs moved into Stage 3 during early 20 th If LDCs are in Stage 3, they did so in the last 20 years If LDCs are in Stage 3, they did so in the last 20 years.")
16
Stage Four = Low Stationary

17
What does it mean to be overpopulated?

18
II. Population Theories Thomas Malthus published his essay in 1798 Malthus’ three assumptions (This was before the Industrial Revolution) Malthus’ three assumptions (This was before the Industrial Revolution) – food grows __________ – pop grows __________ – Britain was a closed sys. = People will eventually run out of food = People will eventually run out of food
 Malthus’ three assumptions (This was before the Industrial Revolution) – food grows __________ – pop grows __________ – Britain was a closed sys. = People will eventually run out of food = People will eventually run out of food.")
19
Our text says there are 3 types of Push & Pull factors PoliticalEconomicEnvironmental Net migration Net migration – Immigrants – emigrants (# out of 1000) – Net in-migration – Net out-migration Ravenstein’s 12 laws of migration
 – Net in-migration – Net out-migration Ravenstein’s 12 laws of migration")
Similar presentations


 CRUDE DEATH RATE (CDR)>")


