Download presentation
Presentation is loading. Please wait.

1
Child Growth in Bangladesh: An Introduction Presentor Dr. Md. Ayub Ali Professor Department of Statistics University of Rajshahi Rajshahi 6205 Email: ayubali67@yahoo.comayubali67@yahoo.com

2
Outline Definition Stages in Child Growth Morphometrics Growth Chart Growth Indices Biological Parameters Growth Models Growth Failure Conclusion

3
Definition of Growth A physical change, usually resulting from either an increase in cell number or cell size.

4
Stages in Child Growth Child Development BoysGirls Early childhood:up to 7 yearsup to 6–7 years Later childhood:7 to 12 years7 to 10 years Adolescence:12 to 15 years10 to 13 years Puberty:15 to 16 years13 to 14 years

5
Stages in Child Growth

7
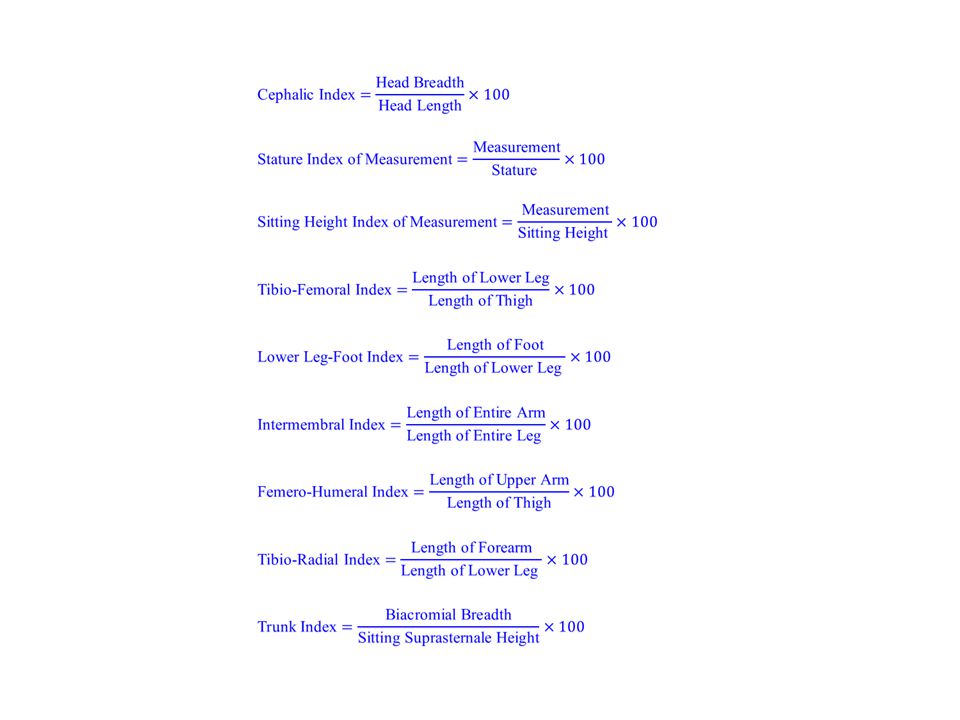
Morphometrics (Length) Body Height (or Recumbent Length), Sitting Height, Estimated Leg Length, Thigh Length, Calf Length, Arm Span, Shoulder-Elbow Length, Elbow-Wrist Length, Hand Length, Forearm-Hand Length, Head Height, Head Length, etc.
 Body Height (or Recumbent Length), Sitting Height, Estimated Leg Length, Thigh Length, Calf Length, Arm Span, Shoulder-Elbow Length, Elbow-Wrist Length, Hand Length, Forearm-Hand Length, Head Height, Head Length, etc.")
8
Morphometrics (Breadth) Biacromial Breadth, Chest Breadth, Chest Depth, Biiliac Breadth, Bitrochanteric Breadth, Knee Breadth, Ankle Breadth, Elbow Breadth, Wrist Breadth, Head Breadth, etc.
 Biacromial Breadth, Chest Breadth, Chest Depth, Biiliac Breadth, Bitrochanteric Breadth, Knee Breadth, Ankle Breadth, Elbow Breadth, Wrist Breadth, Head Breadth, etc.")
9
Morphometrics (Circumference) Head Circumference, Minimal Neck Circumference, Shoulder Circumference, Chest Circumference, Weist Circumference, Abdominal Circumference, Hip (Buttock) Circumference, Proximal Thigh Circumference, Mid-Thigh Circumference, Distal-Thigh Circumference, Calf Circumference, Ankle Circumference, Arm Circumference,
 Head Circumference, Minimal Neck Circumference, Shoulder Circumference, Chest Circumference, Weist Circumference, Abdominal Circumference, Hip (Buttock) Circumference, Proximal Thigh Circumference, Mid-Thigh Circumference, Distal-Thigh Circumference, Calf Circumference, Ankle Circumference, Arm Circumference,")
10
Growth Charts Look at any class picture, and you'll see kids of the same age in all shapes and sizes. Some kids look tiny next to their peers, while others literally stand head and shoulders above their classmates. As easy as it is to make these comparisons and to draw conclusions about what you see, the reality is that kids grow at their own pace. Big, small, tall, short — there is a wide range of healthy shapes and sizes among children. Genetics, gender, nutrition, physical activity, health problems, environment, hormones, and lifestyle factors like nutrition and physical activity all influence a child's height and weight. And many of these factors can vary widely from family to family. So how does a doctor figure out whether a child's height and weight measurements are "normal"? Whether he or she is developing on track? Whether any health problems are affecting growth? A doctor uses growth charts to help answer those questions. Here are some facts about growth charts and what they say about a child's health.

11
Why Do Doctors Use Growth Charts? Growth charts are a standard part of any checkup, and they show health care providers how kids are growing compared with other kids of the same age and gender. They also allow doctors and nurses to see the pattern of kids' height and weight gain over time, and whether they're developing proportionately. Let's say a child was growing along the same pattern until he was 2 years old, then suddenly started growing at a much slower rate than other kids. That might indicate a health problem. Doctors could see that by looking at a growth chart.

12
If a Growth Chart Shows a Different Pattern, Is There a Problem? Not necessarily. The doctor will interpret the growth charts in the context of the child's overall well-being, environment, and genetic background. Is the child meeting other developmental milestones? Are there other signs that a child is not healthy? How tall or heavy are the child's parents and siblings? Was the child born prematurely? Has the child started puberty earlier or later than average? These are all factors that the doctor will use to help understand the numbers on the growth chart.

13
Are All Kids Measured on One Growth Chart? No. Girls and boys are measured on different growth charts because they grow in different patterns and at different rates. And one set of charts is used for babies, from birth to 36 months. Another set of charts is used for kids ages 2 to 20 years old. Also, special growth charts are used for children with certain conditions, such as Down syndrome.

14
Commonly used standard growth charts include Ages birth to 36 months (3 years): Boys' length- and weight-for-age Girls' length- and weight-for-age Girls' head circumference-for-age and weight- for-length Boys' head circumference-for-age and weight- for-length Ages 2 to 20 years: Girls' stature- and weight-for-age Boys' stature- and weight-for-age Girls ' weight-for-stature (height) Boys' weight-for-stature (height)
: Boys length- and weight-for-age Girls length- and weight-for-age Girls head circumference-for-age and weight- for-length Boys head circumference-for-age and weight- for-length Ages 2 to 20 years: Girls stature- and weight-for-age Boys stature- and weight-for-age Girls weight-for-stature (height) Boys weight-for-stature (height)")
15
What Measurements Are Put on Growth Charts? Up until the time babies are 36 months old, doctors measure weight, length, and head circumference. With older kids, doctors measure weight, height, and body mass index (BMI). It's important to look at and compare weight and height measurements to get a full picture of a child's growth.
. It s important to look at and compare weight and height measurements to get a full picture of a child s growth..")
16
Why Is Head Circumference Measured? In babies, head circumference (the distance around the largest part of the head) can provide clues about brain development. If a baby's head is bigger or smaller than most other kids' or the head circumference stops increasing or increases quickly, it may indicate a problem. For example, an unusually large head may be a sign of hydrocephalus, a buildup of fluid inside the brain. A head that's smaller than average may be a sign that the brain is not developing properly or has stopped growing.
 can provide clues about brain development. If a baby s head is bigger or smaller than most other kids or the head circumference stops increasing or increases quickly, it may indicate a problem. For example, an unusually large head may be a sign of hydrocephalus, a buildup of fluid inside the brain. A head that s smaller than average may be a sign that the brain is not developing properly or has stopped growing..")
17
What Are Percentiles? Percentiles are measurements that show where a child is compared with others. On the growth charts, the percentiles are shown as lines drawn in curved patterns. When doctors plot a child's weight and height on the chart, they see which percentile line those measurements land on. The higher the percentile number, the bigger a child is compared with other kids of the same age and gender, whether it's for height or weight; the lower the percentile number, the smaller the child is. For example, if a 4- year-old boy's weight is in the 10th percentile, that means that 10% of boys that age weigh less than he does and 90% of 4-year-old boys weigh more.

18
What's the Ideal Percentile for My Child? There is no one ideal number. Healthy children come in all shapes and sizes, and a baby who is in the 5th percentile can be just as healthy as a baby who is in the 95th percentile. Ideally, each child will follow along the same growth pattern over time, growing in height and gaining weight at the same rate, with the height and weight in proportion to one another. This means that usually a child stays on a certain percentile line on the growth curve. So if our 4- year-old boy on the 10th percentile line has always been on that line, he is continuing to grow along his pattern, which is a good sign.

19
What Could Signal a Problem? A few different growth chart patterns might signal a health problem, such as: When a child's weight or height percentile changes from a certain pattern it's been following. For example: If height and weight consistently are on the 60th percentile line until a child is 5 years old, then the height has dropped to the 30th percentile at age 6, that might indicate that there's a growth problem because the child is not following his or her previous growth pattern. Many kids may show changes in growth percentiles at certain points in development, when it's normal for growth rates to vary more from child to child. This is particularly common during infancy and puberty.

20
What Could Signal a Problem? When kids don't get taller at the same rate at which they're gaining weight. Let's say a boy's height is in the 40th percentile and his weight is in the 85th percentile. (So he's taller than 40% of kids his age, but weighs more than 85% of kids his age.) That might be a problem. On the other hand, if he's in the 85th percentile for height and weight and follows that pattern consistently over time, that usually means that he's a normal child who's just larger than average.
 That might be a problem. On the other hand, if he s in the 85th percentile for height and weight and follows that pattern consistently over time, that usually means that he s a normal child who s just larger than average..")
21
Growth Chart Explained While all children grow at different rates, there are some guidelines that can help you identify if your child falls within the normal range, or if you need to be at all concerned.

22
Typical Growth Rates for Children One of the stages of child development that parents eagerly anticipate is the first year of a child’s life. This is a time of rapid physical growth and development when noticeable changes are seen from week to week. Infants tend to grow approximately 10 inches in this year, and have usually tripled their birth weight by the time they reach their first birthday. Because this stage is characterized by such rapid growth, parents often get somewhat concerned when this growth drastically slows down in the years to follow.

23
Typical Growth Rates for Children Even more concerning is that this decrease in growth rate often coincides with a slump in appetite as the body does not need as much energy. And so it is not uncommon for parents to suddenly become concerned as first their child loses interest in food with a decreased appetite, and now it seems they have stopped growing!

24
Typical Growth Rates for Children This fairly drastic decline in growth rate is normal and you can expect to see a decline as your infant enters the toddler years. From the age of 2 to 3 years you can expect your child to grow fairly steadily at a rate of about 2 inches per year all the way until adolescence. Keep in mind that this growth may happen during growth spurt intervals and is not a steady rate for many children.

25
Stature for Bangladeshi Male Children, n=<162 (Data from Rajshahi District)
")
26
Stature for Bangladeshi Female Children, n=<134

27
Sitting Height for Bangladeshi Male Children

28
Sitting Height for Bangladeshi Female Children

29
Weight for age of Bangladeshi Male Children

30
Weight for age of Bangladeshi Female Children

31
BMI for Bangladeshi Male Children

32
BMI for Bangladeshi Female Children

33
Chest Circumference for Bangladeshi Male Children

34
Chest Circumference for Bangladeshi Female Children

35
Head Circumference for Bangladeshi Male Children

36
Regional Difference in Growth (Data from Jessore District)
")
40
Quetelet’s Index (1836) or Bouchard’s Index (1897): 540 = Obese290 = Emaciated 400 = Normal 200 = Starving 360 = Thin Growth Indices Livi’s Weight-Height Index (1898): Rohrer’s Body Build Index (1908):
 or Bouchard’s Index (1897): 540 = Obese290 = Emaciated 400 = Normal 200 = Starving 360 = Thin Growth Indices Livi’s Weight-Height Index (1898): Rohrer’s Body Build Index (1908):")
41
Index of Morphological Equilibrium: Superior morphological value =120 and over. Optimum morphological value =109 to 119. Average morphological value =90 to 108. Inferior morphological value =84 to 94. Very low morphological value =83 and under. Manouvrier’s Index of Body Build (Indice Skelique): Brachyskelia ……….……Below 85 Mesatyskelia ……….……[85, 90) Macroskelia …..…………90 and over
: Brachyskelia ……….……Below 85 Mesatyskelia ……….……[85, 90) Macroskelia …..…………90 and over.")
42
Cormic Index: Brachycormic..…….……Below 51 Metriocormic...…….……[51, 53) Macrocormic....…………53 and over Pirquet’s Index of Body Build (Pelidisi): Malnutrition..……...……Up to 95 Normal nutrition …...……95 to 100 Overfed …….....…………100 and over
 Macrocormic....…………53 and over Pirquet’s Index of Body Build (Pelidisi): Malnutrition..……...……Up to 95 Normal nutrition …...……95 to 100 Overfed …….....…………100 and over")
43
Demeny’s Vital Index: Spehl’s Vital Index: Up to 1000 =Very weak 1000 to 1100 =Weak 1200 to 1400 =Average 1500 to 1700 =Sturdy 1800 to 2000 =Very sturdy

44
Narroe chest..……...……Up to 51 Average chest... …...……51.1 to 55.9 Wide chest …....…………56.0 and over Brugsch’s Chest-Stature Index: Pignet’s Coefficient of Robusticity: Under 10 =Very sturdy 11 to 15 = Sturdy 16 to 20 = Good 21 to 25 = Average 26 to 30 = Weak 31 to 35 =Very weak Over 35 = Poor

46
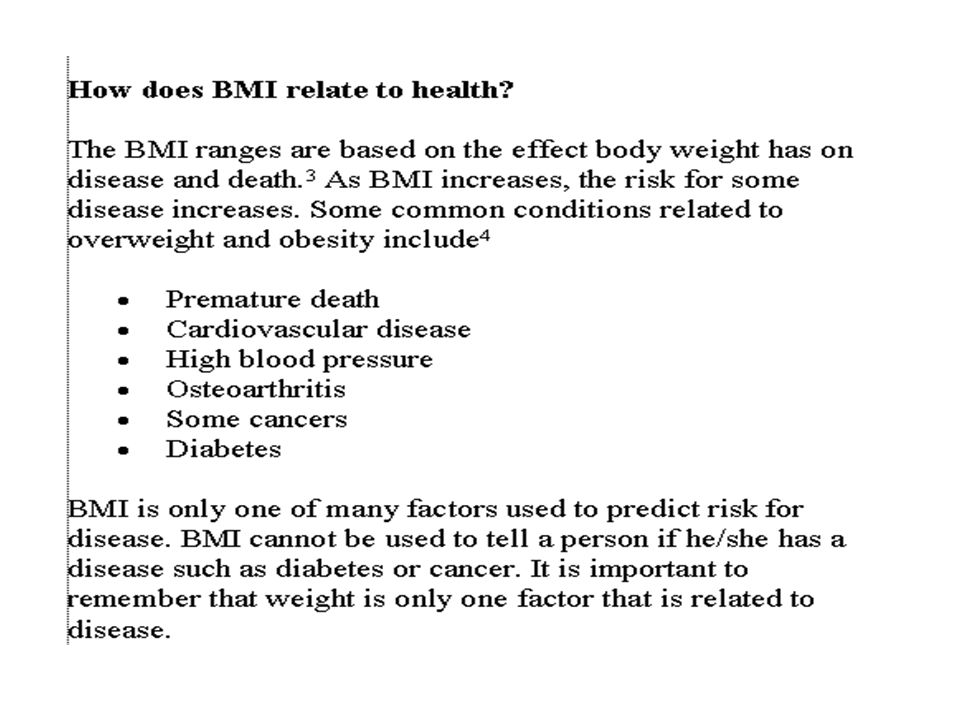
BMI

47
Be careful about BMI

49
Biological Parameters Age at take-off (for Early Childhood) Age at take-off (for Mid-Childhood) Age at take-off (for Adolescent) Age at Peak Velocity (for Early Childhood) Age at Peak Velocity (for Mid-Childhood) Age at Peak Velocity (for Adolescent) Age at Final Stature Stature at take-off (for Early Childhood) Stature at take-off (for Mid-Childhood) Stature at take-off (for Adolescent) Stature at Peak Velocity (for Early Childhood) Stature at Peak Velocity (for Mid-Childhood) Stature at Peak Velocity (for Adolescent) Final Stature Velocity at take-off (for Early Childhood) Velocity at take-off (for Mid-Childhood) Velocity at take-off (for Adolescent) Velocity at Peak Velocity (for Early Childhood) Velocity at Peak Velocity (for Mid-Childhood) Velocity at Peak Velocity (for Adolescent) Velocity at Final Stature
 Age at take-off (for Mid-Childhood) Age at take-off (for Adolescent) Age at Peak Velocity (for Early Childhood) Age at Peak Velocity (for Mid-Childhood) Age at Peak Velocity (for Adolescent) Age at Final Stature Stature at take-off (for Early Childhood) Stature at take-off (for Mid-Childhood) Stature at take-off (for Adolescent) Stature at Peak Velocity (for Early Childhood) Stature at Peak Velocity (for Mid-Childhood) Stature at Peak Velocity (for Adolescent) Final Stature Velocity at take-off (for Early Childhood) Velocity at take-off (for Mid-Childhood) Velocity at take-off (for Adolescent) Velocity at Peak Velocity (for Early Childhood) Velocity at Peak Velocity (for Mid-Childhood) Velocity at Peak Velocity (for Adolescent) Velocity at Final Stature")
50
Biological Parameters

51
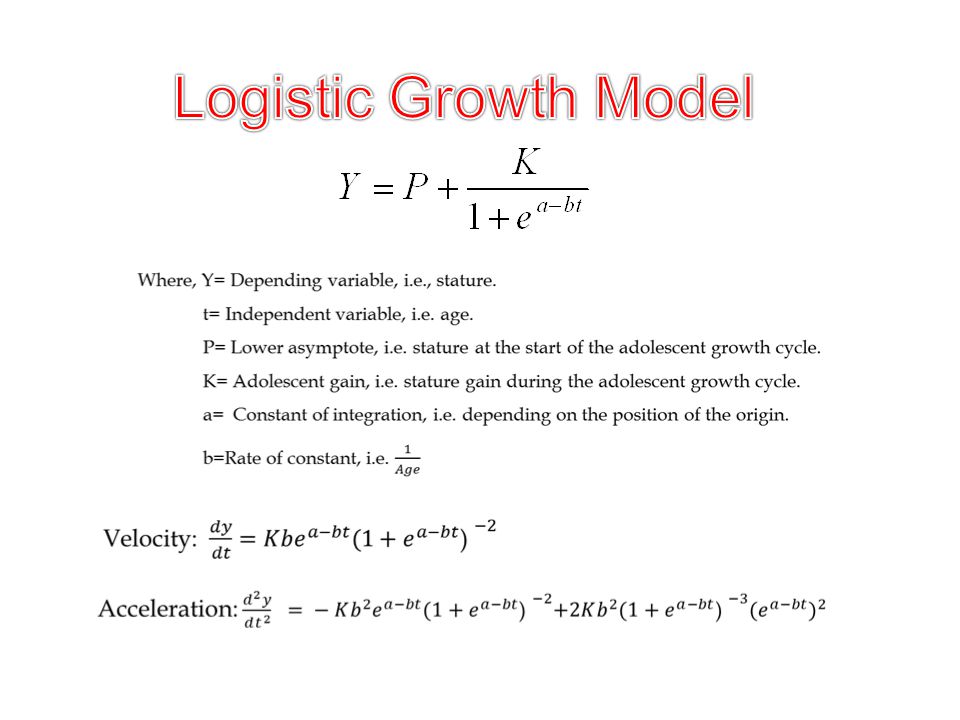
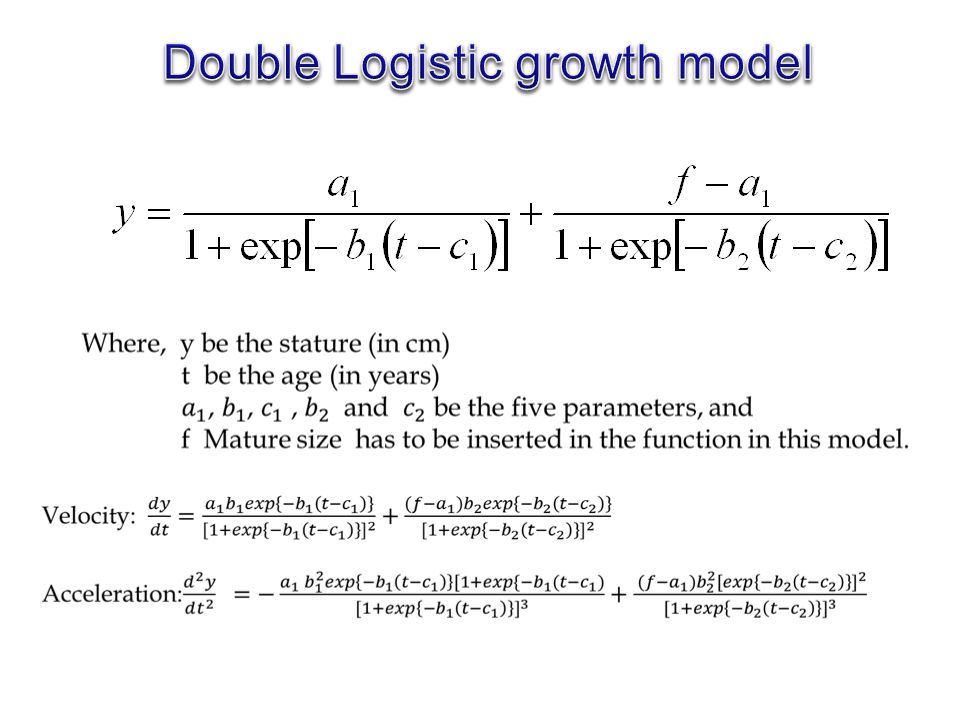
Growth Model Gompertz and the logistic growth model (Merrell 1931, Deming 1957, Marubini et. al. in 1971) Jenss model (Jenss and Bayley, 1937) Count model (Count (1943, Tanner et. al., 1956; Israelsohn, 1960, Wingerd, 1970; and Mata, 1978) Double logistic model (Bock et al., 1973 PB models (Preece and Baines, 1978; Billiwicz and Mc Gregor, 1982; Bogin et al., 1990; Bogin et al., 1992; Brown and Townsend, 1982; Byard et al., 1993; Cameron et al., 1982; Guo et al., 1992; Hauspie, 1980; Hauspie et al., 1980a; Hauspie et al., 1980b; Jolicoeur et al., 1988; Jolicoeur et al., 1991; Jolicoeur et al., 1992; Ledford and Cole, 1998; Mirwald et al., 1981; Qin et al., 1996; Tanner et al., 1982; Zemel and Johnston, 1994)
 Jenss model (Jenss and Bayley, 1937) Count model (Count (1943, Tanner et. al., 1956; Israelsohn, 1960, Wingerd, 1970; and Mata, 1978) Double logistic model (Bock et al., 1973 PB models (Preece and Baines, 1978; Billiwicz and Mc Gregor, 1982; Bogin et al., 1990; Bogin et al., 1992; Brown and Townsend, 1982; Byard et al., 1993; Cameron et al., 1982; Guo et al., 1992; Hauspie, 1980; Hauspie et al., 1980a; Hauspie et al., 1980b; Jolicoeur et al., 1988; Jolicoeur et al., 1991; Jolicoeur et al., 1992; Ledford and Cole, 1998; Mirwald et al., 1981; Qin et al., 1996; Tanner et al., 1982; Zemel and Johnston, 1994).")
52
Growth Model ICP model (Karlberg, 1987) Reed models (Berkey and Reed, 1987) SSC model (Shohoji and Sasaki, 1987; Berkey, 1982; Cole, 1993 Kanefuji and Shohoji, 1990; Shohoji and Sasaki, 1987; Ledford and Cole, 1998) JPPS model (Jolicoeur et al., 1988) JPA-1 and JPA-2 model (Jolicoeur et al., 1992) Modified ICP model (Johnson, 1993) BTT model (Bock et al., 1994) Kernel’s (non-parametric) model (Gasser et al., 1985; Gasser, Sheehy & Largo, 2001) Wavelet model (Fujii and Yamamoto, 1995)
 Reed models (Berkey and Reed, 1987) SSC model (Shohoji and Sasaki, 1987; Berkey, 1982; Cole, 1993 Kanefuji and Shohoji, 1990; Shohoji and Sasaki, 1987; Ledford and Cole, 1998) JPPS model (Jolicoeur et al., 1988) JPA-1 and JPA-2 model (Jolicoeur et al., 1992) Modified ICP model (Johnson, 1993) BTT model (Bock et al., 1994) Kernel’s (non-parametric) model (Gasser et al., 1985; Gasser, Sheehy & Largo, 2001) Wavelet model (Fujii and Yamamoto, 1995)")
59
A Childhood component: This component starts during the first year of life having a slowly decelerating course and continuing until end of growth. A second degree polynomial function explained this component and this polynomial function could be written could be written as: An Infancy component: This component assumed to start during fetal life with a rapidly decelerating course ceasing at 3 – 4 years of age and also it was explained by an exponential function: A Puberty component: This component representing the additional growth induced by puberty and accelerating up to age at peak velocity (age = ), then decelerating until the end of the growth (age = ). A logistic function represented this component and that function was:
, then decelerating until the end of the growth (age = ). A logistic function represented this component and that function was:.")
61
The second-order Reed model

62
Shohoji and Sasaki (1987) described a growth model, which has six parameters. It can be written as: Where t is postnatal age, y(t) is stature at age, A is adult stature, W(t) is a weighting function given by, f(t) is a function of stature in infancy given by and is a error. Let Velocity:
 is stature at age, A is adult stature, W(t) is a weighting function given by, f(t) is a function of stature in infancy given by and is a error. Let Velocity:.")
63
A seven-parameter model was described by Jolicoeur et al. (1988) and written as: Let Velocity: Acceleration:
 and written as: Let Velocity: Acceleration:.")
64
JPA-1 is the nickname of the model in equation (1) and JPA-2 is the nickname of the model in equation (2). The models JPA-1 retains the theoretically desirable quality of passing through the origin with respect to total age while, JPA-2 fits human stature data better than all other asymptotic models proposed till 1991 (Jolicoeur et al., 1992). …(1) …(2)
. …(1) …(2).")
65
Let Velocity: Acceleration:

66
Let Velocity: Acceleration:

68
Velocity: Acceleration:

69
Non-parametric growth model Kernel model Wavelet model Functional Growth model

70
Growth Failure

71
Symptoms of Growth Failure in Children The child's height, weight, and head circumference do not progress normally according to standard growth charts. Physical skills, such as rolling over, sitting up, standing, or walking, are slow to develop. Social and mental skills are delayed. The development of secondary sexual characteristics (for example, men's facial hair, women's breasts) is delayed in adolescents.
 is delayed in adolescents..")
72
Causes of Growth Failure Malnutrition Diseases and disorders: Chronic diseases and systemic disorders that involve the nervous, circulatory, or gastrointestinal systems may be a cause of growth failure. Diseases or disorders involving the liver, kidneys, lungs, or connective tissue may also be a cause.Chronicsystemiccirculatorygastrointestinalliver lungsconnective tissue Psychosocial dwarfism: This is a disorder of short stature or growth failure and/or delayed puberty. This often occurs in association with emotional deprivation and/or child abuse and neglect.child abuse Syndromes: Growth failure can be a feature of genetic syndromes, such as Turner syndrome and Down syndrome. It can also be a part of other syndromes, such as Noonan syndrome, Russell-Silver syndrome, and Prader-Willi syndrome. Turner syndromeDown syndromeNoonan syndromePrader-Willi syndrome Endocrine (hormonal): Endocrine causes include thyroid hormone deficiency (hypothyroidism), growth hormone deficiency, or other hormone disorders. Thyroid hormone is necessary for normal growth; in children with hypothyroidism, growth is extremely slow. Children with growth hormone deficiency have normal body proportions, but they may appear younger than their actual age.thyroid hormonehypothyroidism Thyroid
: Endocrine causes include thyroid hormone deficiency (hypothyroidism), growth hormone deficiency, or other hormone disorders. Thyroid hormone is necessary for normal growth; in children with hypothyroidism, growth is extremely slow. Children with growth hormone deficiency have normal body proportions, but they may appear younger than their actual age.thyroid hormonehypothyroidism Thyroid.")
73
Causes of Growth Failure Familial short stature: Children with this condition have parents with short stature. They have a normal growth velocity, and bone age is not delayed. They enter puberty at a normal time and often complete growth with a short adult height. Constitutional growth delay: Also called delayed puberty, children with constitutional growth delay have a normal birth weight, and their growth slows usually during the first year of life. From about age 3 to puberty, these children have an adequate growth velocity. Bone age is usually delayed, and puberty is late. Late puberty allows for more prepubertal growth, usually resulting in a normal adult height. Usually, children with constitutional growth delay do not show growth failure but a period of slow growth velocity occurs during the first year of life and just before puberty.prepubertal Other: Growth failure may be related to intrauterine growth retardation (a condition in which children weigh less than 5 pounds at full term or who are small for gestational age if born preterm). Bone and cartilage disorders (called chondrodystrophies) may also be a cause of growth failure. Achondroplasia (one of the most common conditions that cause growth failure and short stature) is a genetic disorder of bone and cartilage. People with achondroplasia have a normal-sized trunk, short arms and short legs, and a slightly enlarged head with a prominent forehead. Adults with this condition are typically about 4 feet tall. There are other chondrodystrophies, such as hypochondroplasia, which are similar to achondroplasia but not as severe.intrauterine growth retardationsmall for gestational agecartilageAchondroplasiahypochondroplasia
. Bone and cartilage disorders (called chondrodystrophies) may also be a cause of growth failure. Achondroplasia (one of the most common conditions that cause growth failure and short stature) is a genetic disorder of bone and cartilage. People with achondroplasia have a normal-sized trunk, short arms and short legs, and a slightly enlarged head with a prominent forehead. Adults with this condition are typically about 4 feet tall. There are other chondrodystrophies, such as hypochondroplasia, which are similar to achondroplasia but not as severe.intrauterine growth retardationsmall for gestational agecartilageAchondroplasiahypochondroplasia.")
74
Exams and Tests thyroxine and thyroid-stimulating hormone tests,thyroxine serum electrolyte levels,serumelectrolyte complete blood count and sedimentation rate,complete blood countsedimentation rate insulin-like growth factor 1 and insulin-like growth factor - - binding protein 3 tests, or a growth hormone stimulation test.protein An MRI of the head may be indicated in children with growth hormone deficiency to rule out a brain tumor.MRIbrain tumor X-rays may be taken of the left wrist to compare with standard charts. This image can also be used to determine the child's bone age and growth potential.X-rays

75
Diagnosing a Growth Problem Your pediatrician or the staff at your community clinic will keep a check on your child’s development and growth, and so it is important to keep regular appointments so that any problems can be quickly spotted. While weight and height are predominantly guided by genetic factors, you should consider contacting a physician or endocrinologist (specialist in the area of growth disorders) if you suspect any serious problems or if your child’s growth rate seems to be drastically falling behind peers. Children tend to remain along a similar growth pattern, and if this pattern
 if you suspect any serious problems or if your child’s growth rate seems to be drastically falling behind peers. Children tend to remain along a similar growth pattern, and if this pattern.")
76
Growth Charts and Body Mass Index Growth charts will help you to determine what percentile your child is at. For example if your child is in at the 50th percentile for height, it really means that for that age and gender, your child is taller than 50% of his or her peers and shorter than 50% of his or her peers. Keep in mind however, that these are merely rough guidelines and are generally not used as diagnostic tools.

77
Possible Signs of a Growth Problem in Children If your child's plotted percentile changes drastically. For example, if your child’s height was marked at the 70th percentile and has now moved down to the 20th or 10th percentile. Your child is plotted on the growth curve below the 3rd percentile. Consistently poor appetite and/or poor nutrition. Chronic abdominal pain and/or diarrhea. Marked weight loss or weight gain. Delayed puberty. A height very much below that predicted by the heights of both parents. If other dismorphic signs are present which can be indicative of a chromosomal disorder.

78
Conclusion It is essential to make different growth charts for different age groups and for different ethnic groups. Different indices may be calculated for better understanding of the segmental growth process. Appropriate Growth model should be found out for detecting different growth parameters. And for this—

79
Conclusion A project (for collecting longitudinal data) may be started. Growth failure should be addressed timely for taking proper initiative. Growth enemies should be under controlled.

80
Thank you very much for your kind attention

Similar presentations