Download presentation
Presentation is loading. Please wait.

1
TRENDS IN PARTY SUPPORT POLI 423 N. R. Miller

2
American National Election Studies ANES studies have been held in conjunction with every Presidential election since 1952 (and most off-year) Congressional elections. A large portion of political science knowledge concerning U.S. electoral behavior is derived from this series of studies. Each ANES is a survey of approximately one to two thousand randomly selected respondents who collectively constitute a representative sample of the American voting-age population at the time.

3
National Election Day Exit Polls

4
Party Identification and Ideology (ANES) Party affiliation and identification –Generally speaking, do you think of yourself as a Republican, a Democrat, an Independent, or what? [If partisan] Would you call yourself a strong Republican/Democrat or a not very strong Republican/Democrat? [If Independent] Do you think of yourself as closer to the Democratic Party or the Republican Party? –About 95% of the mass public identify themselves as Democratic, Republican, or Independent. Ideology: –We hear a lot of talk these days about liberals and conservatives. Where would you place yourself in these terms, or haven’t you thought much about this? –About 20-25% of the mass public “haven’t thought much about this.”

5
Party Identification: 1952-2008

6
Dems, Reps, and Pure Independents: 1952-2008

8
Ideology: 1972 - 2008

9
Party ID and Ideology Note the anomaly: –more Democrats than Republicans, but –more conservatives than liberals.

10
Party Identifi- cation and Ideology: 1970s vs. 2000s

11
Ideology at the Mass Level Abortion and Health Insurance opinions are largely unrelated.

12
Ideology at the Mass Level Economic/New Deal Issues vs. Social/Cultural/”Family Values” Issues

13
Presidential Approval “Do you approve or disapprove of the way George W. Bush is handling his job as President?”

14
Party Identification “Colors” Presidential Approval (and other opinions)
")
15
Obama Approval (Gallup)
")
16
Democratic Vote By Party ID

17
Turnout (Self-Reported) Voted by Party ID
 Voted by Party ID")
18
What Is This Map?

19
2008 Electoral Map (Red Blue)
")
20
Voting by States The Electoral College system means that geography (in particular, state boundaries) is important in President elections. Historically, Presidential (and other) voting has exhibited sectional (geographical) patterns).
 voting has exhibited sectional (geographical) patterns)..")
21
Sectionalism:1904

22
Cartogram 2008: Area Proportional to Electorate

23
Presidential Vote by County

24
County Bubbles (NY Times)
")
26
County Shifts: 2004-2008 (NY Times)
")
27
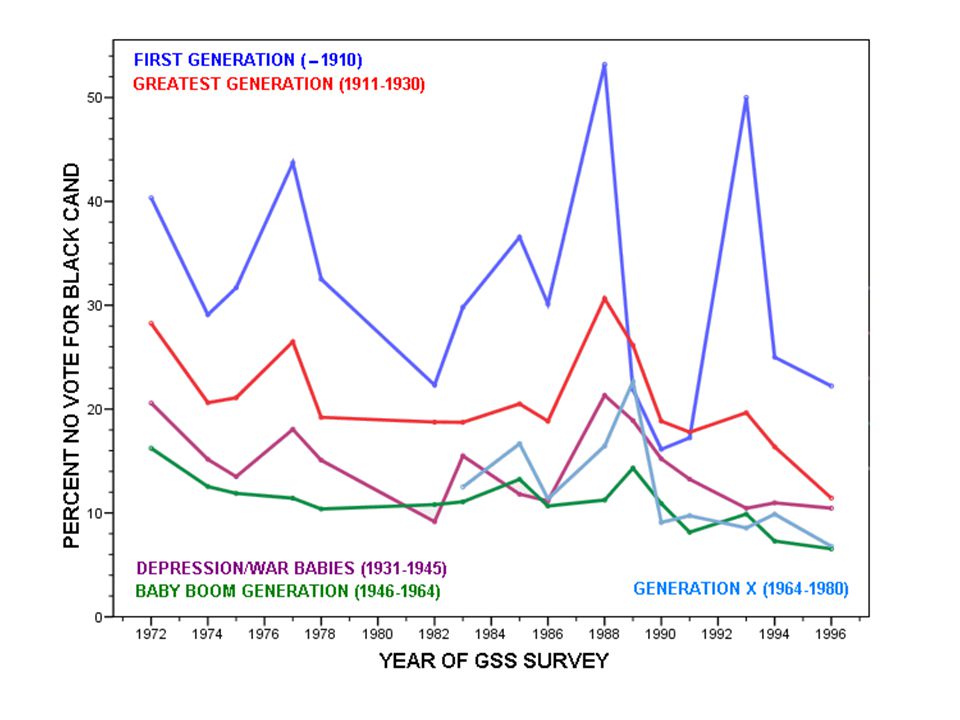
“Would You Vote for a Qualified Black Candidate of Your Own Party?” (Whites Only) Gallup 1958 Gallup 2007 Yes 34% 93% No 58% 5%
 Gallup 1958 Gallup 2007 Yes 34% 93% No 58% 5%")
29
We Would Expect Opinion to Vary with Age

33
Behavior vs. Survey Responses?

34
2004 Electoral Map (Red Blue)
")
35
2004 Pivot Map

36
The 2004 Battleground (± 3%)
")
37
2000 Electoral Map

38
2000 Pivot Map

39
2000 Battleground

40
What Is This Map?

41
1896 Electoral Map

42
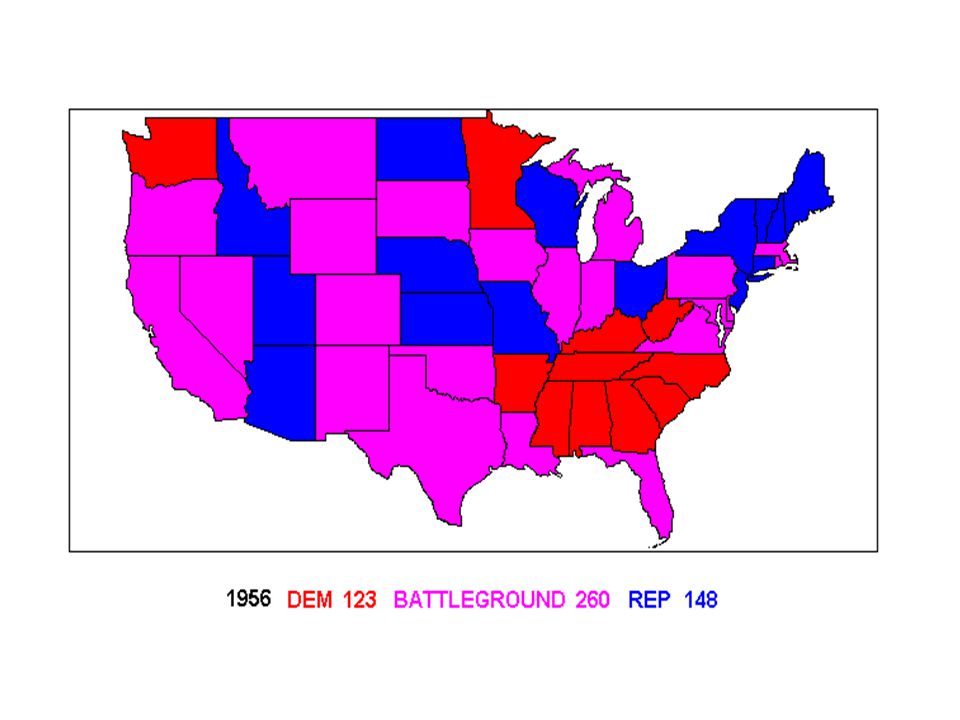
A Much Quicker Electoral Flip: 1956 vs. 1964

43
What Is This Map?

44
Median Household Income

46
What Is Going On? “Wal-Mart [or Sam’s Club] Republicans”? “Trust fund Democrats”? What’s The Matter With Kansas? How Conservatives Won the Heart of America? (Thomas Frank) Are we that far beyond the New Deal electoral alignment? Actually -- No
![What Is Going On. Wal-Mart [or Sam’s Club] Republicans .](http://images.slideplayer.com/14/4211843/slides/slide_46.jpg "Trust fund Democrats . What’s The Matter With Kansas. How Conservatives Won the Heart of America. (Thomas Frank) Are we that far beyond the New Deal electoral alignment. Actually -- No.")
48
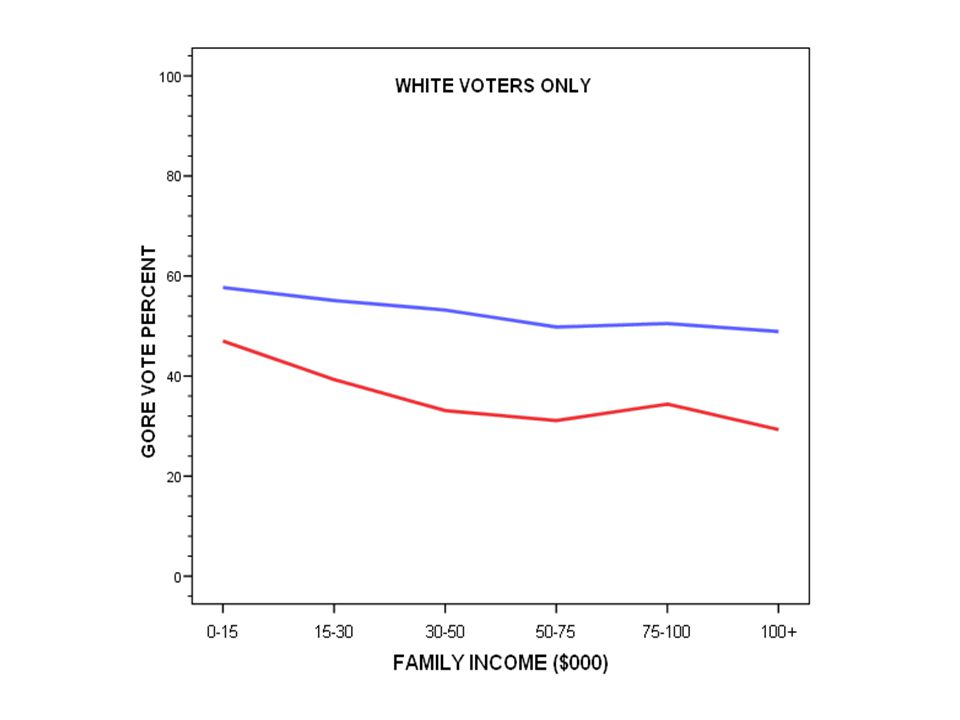
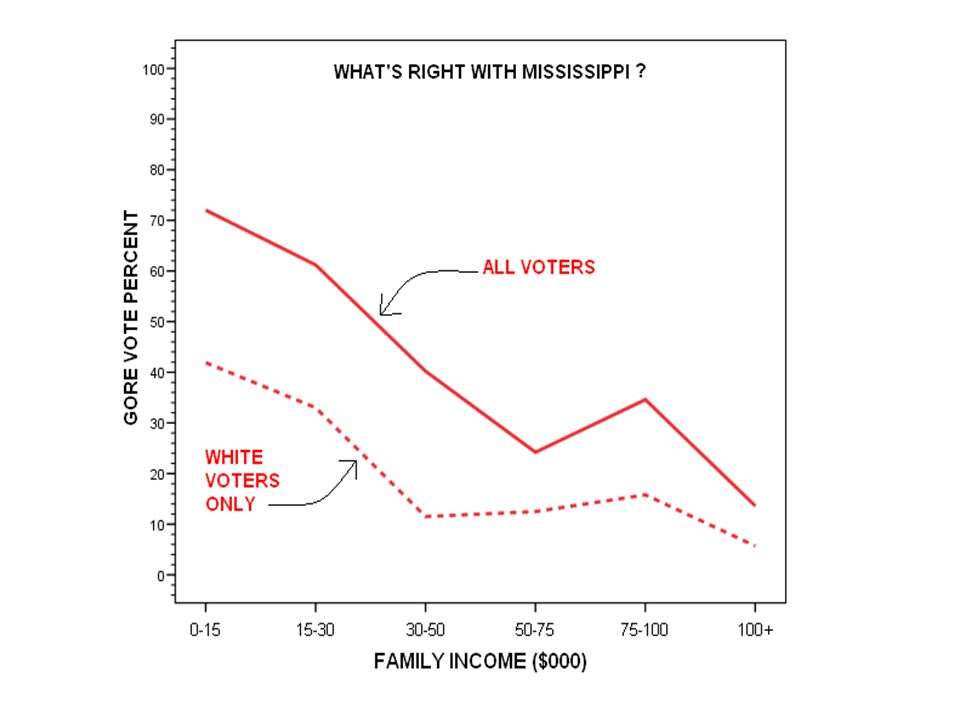
Uses 2000 and 2004 National and State Exit Polls –Plus ANES Andrew Gelman et al., “Rich State, Poor State, Red State, Blue State: What’s the Matter with Connecticut,” Quarterly Journal of Political Science (March 2007) The following charts are all from the 2000 National and State Exit Polls.
 The following charts are all from the 2000 National and State Exit Polls.")
58
2004: If Only Rich Voted

59
2004: If Only Middle $ Voted

60
2004: If Only Poor Voted

61
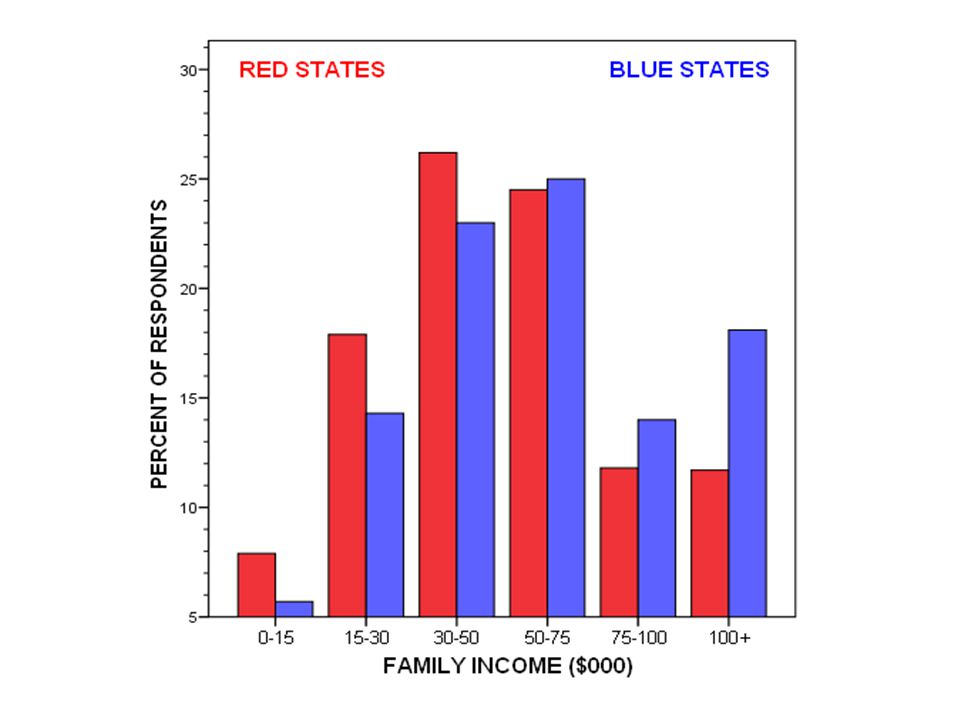
Rich vs. Poor States/ Rich vs. Poor Voters

62
Bartels: “What’s the Matter with What’s the Matter with Kansas” Yes, white (“working class”) voters without college degrees have become less Democratic in voting habits. But this results almost entirely from the realignment in the South. Moreover, while “social/cultural issues” have become more important, they are more important among (middle/upper class) voters with college degrees than those without. Many middle/upper class voters in blue states are socially liberal and vote Democratic, many fewer in red states.
 voters with college degrees than those without. Many middle/upper class voters in blue states are socially liberal and vote Democratic, many fewer in red states..")
69
Religion and Class Voting Around the World

70
Religion and Class Voting Around the World (cont.)
")
73
1960 vs. 2000: Red Gets Reder and Blue Gets Bluer Mean Winner’s Margin in Victory at State Level UnweightedWeighted by State’s Electoral Vote 1960200019602000 8.514.6 6.5 12.6 19602000 CANixon 0.5Gore11.7 FLNixon 3.0Bush 0.0 ILKennedy0.2Gore12.0 MIKennedy3.1Gore 5.2 NJKennedy0.8Gore15.8 NYKennedy5.2Gore25.0 OHNixon 6.6Bush 3.6 PAKennedy2.4Gore 4.2 TXKennedy2.0Bush21.7 Mean 2.611.0

74
1960 vs. 2000 (cont.) Many of the most lopsided states in 1960 were even more lopsided in 2000. KSNixon21.4Bush20.8 MAKennedy20.6Gore27.3 NENixon24.2Bush20.8 RIKennedy27.2Gore29.1 UTNixon 9.6Bush40.5 WYNixon10.0Bush40.1 Mean18.330.0

75
1960 vs. 2000 (cont.) Here is a more comprehensive overview. Kennedy vote in 1960 vs. Gore vote in 2000 Unweighted Weighted by State’s Electoral Vote 1960200019602000 Min37.928.337.928.3 Max63.865.763.865.7 Mean49.247.450.249.8 SD 5.7 9.1 5.0 8.0 All percentages are based on the two-party vote only, and DC [which did not vote in 1960] and MS [where a slate of unpledged electors won in 1960] are excluded from the statistics.

76
1960 vs. 2000 (cont.)
")
78
Battleground State = in a 50-50% Election, State Winner Would Get less than 53%

91
The Shrinking Battleground

94
The Bradley/Wilder and Whitman Effects?

95
The Front-Runner Effect?

Similar presentations


>")


