Download presentation
Presentation is loading. Please wait.

1
Mapping Science: Lecture 1
What are maps? Cartographic basics A Brief History of Maps

2
Maps as a Model of the Real World
Abstraction Communication

3
Map Abstraction Selection Classification Simplification Exaggeration
Symbolization

4
Map as Communication Goal is to capture the spatial character of particular area and help the user to understand the geographic relationships The principal task of cartography is to communicate environmental information. The task of the map designer is to enhance the map user's ability to retrieve information.

5
Map as Communication Maps perform two important functions:
Storage medium for information that humanity needs Provides a picture of the world to help understand spatial patterns, relationships, and environmental complexity

6
Cartographic Basics Maps tell us: What is it? (often) When is it?
Where is it? What is it? (often) When is it? What is nearby? How far away? In which direction? How do I get there? What other things are there also? How might they be related? Location - position in two-dimensional space Attributes - qualities or magnitudes such as language or temperature Reduction of reality - obviously cannot map at 1:1, thus Scale Transformations - from round earth to flat map or screen Abstractions - only some environmental information can fit on any given map. Information is subject to classification, simplification and perhaps other operations to make it easier to portray and understand. Symbolism - signs stand for elements of reality.
 When is it What is nearby How far away In which direction How do I get there What other things are there also How might they be related Location - position in two-dimensional space. Attributes - qualities or magnitudes such as language or temperature. Reduction of reality - obviously cannot map at 1:1, thus. Scale. Transformations - from round earth to flat map or screen. Abstractions - only some environmental information can fit on any given map. Information is subject to classification, simplification and perhaps other operations to make it easier to portray and understand. Symbolism - signs stand for elements of reality.")
7
Understanding the Environment
Represent real world features Tangible Intangible Simplified/Categorized

8
Feature Types Discrete Dispersed/Discontinuous Continuous Distinct
Homogeneous Dispersed/Discontinuous Continuous

9
Feature Dimensionality
0-D Points 1-D Lines 2-D Areas 3-D Volume 4-D Time/Change

10
Cartographic Basics Basic characteristics of all maps: Location
Attribution Reduction of reality Scale Geometrical transformation/projection Abstractions of reality Symbolism

11
Cartographic Basics Location and Attribution allow many types of relationships to be formed: Relationships among locations with no attributes – distance, bearing Relationship among various attributes at the same point Relationship among different locations of the same attribute Relationships among locations of combined/derived attributes of given distributions -- spatial distribution of per capita income vs. educational attainment Get 'standard' fractions for each scale. General reference - topo maps - show the locations of a variety of different features such as water, coastlines, roads. Thematic - distribution of a single attribute or the relationship among several attributes. Precipitation, cloud cover, average annual income, population, etc. Charts - designed for nautical and aeronautical navigators. Charts are to be worked on rather than looked at. Plot courses, determine position, mark bearings, etc. Road map could be thought of as a chart for land navigation. Cadastral - official land holdings and property owners; land parcels; used for tax assessment. Plans - large scale detailed maps showing buildings, roadways, property lines, etc. Used for urban planning.

12
Cartographic Basics Classification of maps: Classed by Scale
Small scale Medium scale Large scale Classed by Function General reference maps Thematic/special purpose maps Charts Classed by Subject Matter Cadastral maps Plans Soil, vegetation, precipitation, etc.

13
Cartographic Basics Mapping involves information transformations:
Data collection Selection Classification Simplification Exaggeration Symbolization Use of map Data collection - where did your data come from? Census, ground survey, remote sensing, compilation of other data. Selection - not all data can be presented on every map Classification - how is your data broken up for viewing? How many categories of population size? What level is your soil survey? Simplification - very sinuous roads or rivers cannot be depicted accurately - they are straightened for mapping purposes Exaggeration - a small stock tank is much smaller than the dot on the map that represents it Symbolization - water=blue, forest=green. What color are cows? What shape is precipitation? Use of map - depends on users skill in map reading, analysis, interpretation. 1)may be done for you 2)most time consuming 3)the best way to find errors/poor design/omissions - never leave this out 4)if you can't read your own map, will anybody else be able to?
may be done for you. 2)most time consuming. 3)the best way to find errors/poor design/omissions - never leave this out. 4)if you can t read your own map, will anybody else be able to")
14
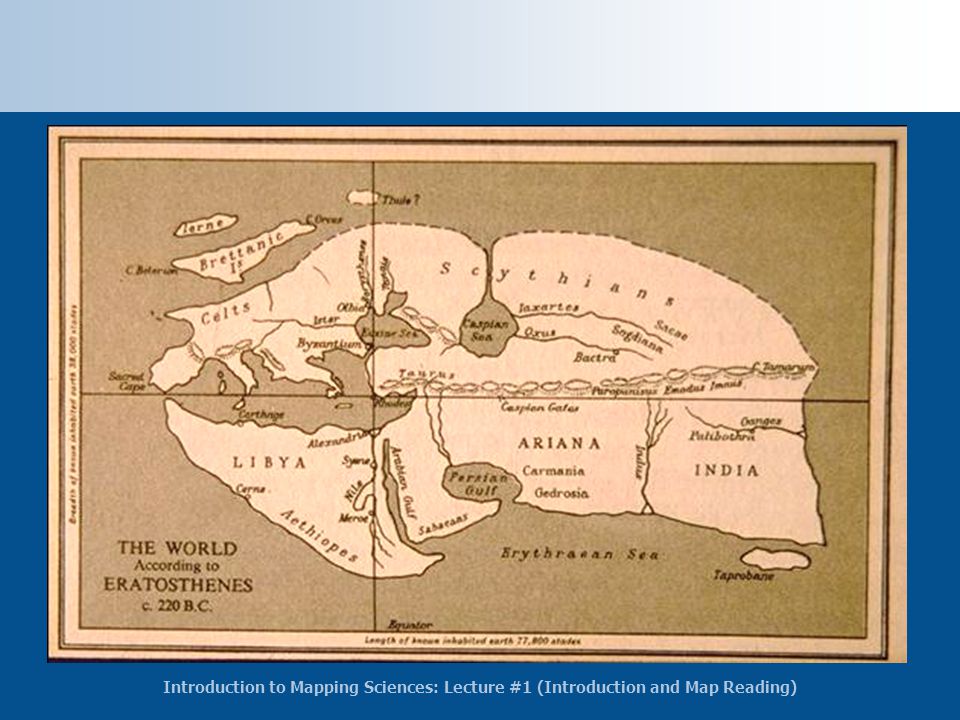
A Brief History of Maps pre 2000 B.C. Earliest direct evidence of mapping comes from the middle east. These ancient Babylonian clay tablets depict the earth as a flat circular disk. Ancient Chinese Maps In ancient times, Chinese cartography was more advanced than their contemporaries'. Their maps were accurate and detailed compared to other ancient maps. 200 B.C. The Greeks understood that the earth was a sphere. Eratosthenes accurately calculated the circumference of the earth using angle measures.

15
Clay tablet from Ga-Sur, ca. 2300 B.C.

16
Town Plan from Catal Hyuk (6200 B.C.)
")
17
Mesopotamian City Plan, Nippur 1500 BC

18
Turin Papyrus ca B.C.

19
Babylonian clay tablet world map, ca. 600 B.C.

20
Reconstruction of Herodotus World Map
ca. 450 B.C.

21
The Babylonian cosmos

22
A Brief History of Maps (cont.)
150 A.D. Ptolemy defined in Geography the elements and form of scientific cartography. In spite of his errors (he maintained that the sun revolved around the earth, and calculated the earth as 3/4 its actual size), Ptolemy was far ahead of his time on how scientific research should be conducted. He proposed a system of projections and coordinate systems that are still used today Middle Ages European maps were more ecclesiastic than cartographic. Cosmas exemplified this concept, incorporating religious themes and references into many of his maps. In contrast, Arab maps advanced the earlier Greek practices. Al-Idrisi designed a still- famous world map.
, Ptolemy was far ahead of his time on how scientific research should be conducted. He proposed a system of projections and coordinate systems that are still used today. Middle Ages European maps were more ecclesiastic than cartographic. Cosmas exemplified this concept, incorporating religious themes and references into many of his maps. In contrast, Arab maps advanced the earlier Greek practices. Al-Idrisi designed a still- famous world map.")
23
Reconstruction of Homer's view of the world

25
Reconstruction of the Orbis Terrarum (20 A.D.)
")
26
Reconstruction of the world map
according to Dionysius (124 A.D.)
")
27
Ptolemaic World Map, 12th -13th century

28
A small section of Tabula Peutingeriana 350 A.D.

29
Catalan Atlas (1375)
")
30
Martin Behaim's Globe, 1492

31
A Brief History of Maps (cont.)
16th century Mercator created a map- the Mercator Projection that allowed mariners to sail to their destinations by following a fixed rule called a rhumb line. 17th century Newton postulated that, due to the centrifugal force of the spinning earth, strongest at its equator, the earth bulges at the equator and flattens at the poles. The earth is not a true sphere, but a spheroid.

32
Cantino's world map, 1502

33
Gerard Mercator's famous world map, 1569
(first known use of the "Mercator projection" on a world map)
")
34
Europae Abraham Ortelius, 1564

35
World map, John Speed, 1627

36
Nova Totius Americae Descripto, 1666

37
A Brief History of Maps (cont.)
19th century Europeans implemented the metric system which introduced a simpler and more universal language for map scale. The Greenwich prime meridian was established 20th century Aerial photographs, computers, electronic distance-measuring instruments, inertial navigation systems, remote sensing, and applications of space science create new extensions of cartography's reach. The Internet makes that reach accessible to all of us.

Similar presentations


. Location – the space.>")

 attribute characteristic of entity (discharge) relationship linkages amongst.>")
