Download presentation
Presentation is loading. Please wait.

1
Ondoy Tragedy Lessons to be learned… Fernando Siringan ando.msi@gmail.com Marine Science Institute, University of the Philippines Diliman Gemma Narisma, Rosa Perez, Celine Vicente, Antonia Loyzaga Manila Observatory Mahar Lagmay National Institute of Geological Sciences, University of the Philippines Diliman

2
http://earthobservatory.nasa.gov Observations from TRMM from Sept 21 to 27, 2009

3
Wind Direction and Wind Speed The highest rainfall was measured in Manila Observatory between 9 AM and 1 PM. Highest rainfall of 61.4 mm/hr was measured at 10 AM

4
Weekly Accumulated Rain = 459.8 mm Daily Rain 26 Sep 2009 368.6 mm “Ondoy” brought a total of 368.8 mm of rain over Manila Observatory on September 26, 2009. This daily rain measured in Manila Observatory is higher than the monthly normal (330.3mm) in the Port Area.
 in the Port Area..")
5
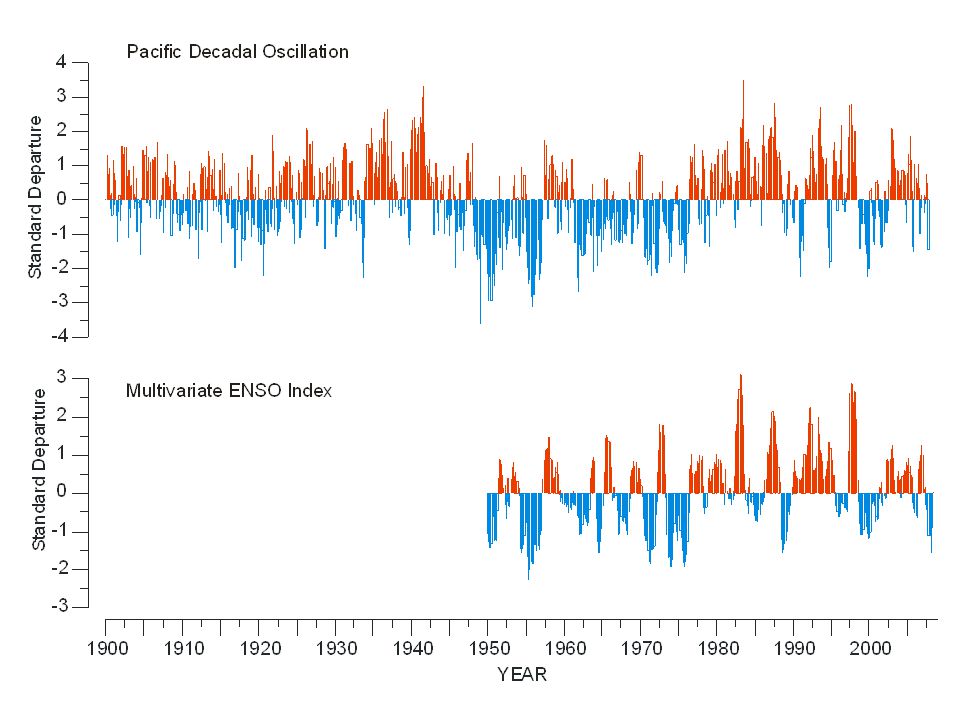
330.3 mm Accumulated rainfall over a week measured by TRMM was over 500 mm in Metro Manila. This value is higher than the monthly normal. http://www.nscb.gov.ph/headlines/StatsSp eak/2009/030909_rav_climatechange.asp http://trmm.gsfc.nasa.gov/trmm_rain/Events/manila_rainfall_perspective_21-28sep09.jpg Rain Accumulated in Southern and Central Luzon (21-28 Sep 2009) Ondoy is an extreme event. But is Ondoy a manifestation of climate change?
 Ondoy is an extreme event. But is Ondoy a manifestation of climate change .")
6
Daily rainfall at Science Garden (1961-2004) 334.5 276.5 267 246.4 223 Daily rainfall at Port Area (1961-2004) 403.1 265.4 257.4 252.8 371.4
 Daily rainfall at Port Area ( )")
7
Essential parts of a warning system … Since rainfall is highly variable even over a small area, it is best to have a good network of weather stations – data can be viewed by anybody through the internet. A similar network of river gages – also viewable through the internet. Water level of dams can be included in the network.

8
River channel capacities are decreased by … Encroaching houses and fishponds Increased siltation due to deforestation Garbage What is causing our worsening floods?

9
River Guagua River Pasac Sta. 7+000 130m 250m Malusac River Fishpond encroachment (from DPWH)
")
10
Where is the river?

13
channel capacities decreased by … encroachment of structures … filling up of river channels … by sediments and garbage In Metro Manila worsening floods are typically attributed to insufficient drainage … disappearance of about 21 km of small rivers (Zoleta-Nantes, 2000) – converted for housing or other uses by government and private entities drainage structures are outdated relative to degree of urbanization … some are century old Climate change?
 – converted for housing or other uses by government and private entities drainage structures are outdated relative to degree of urbanization … some are century old Climate change")
14
Where is the river? Missing river? River Longos area Letre Rd

15
Decrease in floodplain area Urban sprawl Flood control dikes Fishponds Global sea level rise Land subsidence. The least understood, but very important. Other causes of worsening floods

16
Lowering of land, even large areas, due to: Natural compaction of underlying soil and sediment Compaction sped up by rapid withdrawal of groundwater Land subsidence

17
Long-lasting floods that now last for months occur in… coastal CAMANAVA and the Pateros- Taguig-Muntinlupa area where floods are due to elevated lake levels during the rainy season But in CAMANAVA, floods can be caused by high tide alone… but this was not so in the past.

18
At Manila’s South Harbor mean sea level rose at about 2 millimeters per year from 1902 to the early 1960’s...... then started rising ten times as fast. WHY? Groundwater withdrawal! <20 million liters per day (MLD) 250 MLD 778 MLD 1770 MLD in 2004 (CEST 2004) 989 MLD in 1990 (JICA 1992) Metro Manila`s groundwat er demand is still increasing. Consequent subsidence will continue and may even accelerate !
 250 MLD 778 MLD 1770 MLD in 2004 (CEST 2004) 989 MLD in 1990 (JICA 1992) Metro Manila`s groundwat er demand is still increasing. Consequent subsidence will continue and may even accelerate !.")
19
If too much water is pumped out of the aquifer, the pressure is reduced in the pore spaces between grains of sand and gravel. Water in the clay layers is sucked into the aquifer. This causes the clay layers to shrink...... and the ground surface to sink. Pipe appears to rise out of the ground Pumps extract water from “aquifers” –layers of sand and gravel soaked with water. How groundwater withdrawal causes land to subside We need to lessen our dependence on groundwater.

20
Benchmarks used for re- leveling (1978 vs 2000) survey (Jacob 2004) Tuff Coastal/Alluvial Lake/Alluvial 0.95 1.40 1.46 0.76 0.79 0.16 0.77 0.96 0.88 0.57 0.67 0.95 0.73 0.61 0.59 0.51 0.57 0.43 0.46 0.47 0.64 Maximum magnitude of subsidence – 1.46 m (6.1 cm/y) Change in height of maximum high tide, from 1991 to 2002 based on social survey ranges from 0.5 - 1.0 m (4.5 – 9.1 cm/y) There appears to be an acceleration in rate of subsidence in recent years. Lateral variation in magnitude of subsidence is not a function of underlying lithology.

21
Piezometric Level 1951 (NHRC, 1991) -120 Piezometric Surface 2004 (CEST, 2004)
 -120 Piezometric Surface 2004 (CEST, 2004)")
22
(Sources: 1:50,000 topographic maps of Namria, 1990 and 1992) M 6-7 earthquakes recur every 200 to 400 years (Nelson et al., 2000) and have an associated ~0.5 m vertical displacement (R. Rimando pers. comm.) Trace of West Marikina Valley Fault Subsidence along the Marikina Valley can be due to combined natural, earthquake and human induced compaction.
 Trace of West Marikina Valley Fault Subsidence along the Marikina Valley can be due to combined natural, earthquake and human induced compaction..")
23
Other SE Asian sites experiencing subsidence due to over extraction of groundwater SUBSIDENCE LOCATION PERIOD Meters cm/year Tokyo, 1918-87 4.5 6.5 Japan Tokyo Osaka, 1934-68 2.8 8.2 Japan Osaka Shanghai, 1921-65 2.63 6 China Shanghai Yun-Lin, 1989-97 0.66 8.25 Taiwan (Fishpond area!) Yun-Lin Hanoi, 1988-93 0.1-0.3 2-6 Vietnam Hanoi CAMANAVA 1991-2002 0.3 - 1 2.7 – 9.1 Manila Bangkok, 1980-90 0.5-1 5-10 Thailand Bangkok Jakarta, 1991-99 0.3-0.8 4-10 Indonesia Jakarta
 Yun-Lin Hanoi, Vietnam Hanoi CAMANAVA – 9.1 Manila Bangkok, Thailand Bangkok Jakarta, Indonesia Jakarta")
26
Bathymetric data based on 1920 to 1939 hydrographic surveys Lake surface area 922 km 2 Total lake volume 2.32 x 10 9 m 3 Average water depth 2.52 m Bathymetric data based on 1997 to 1998 hydrographic surveys Lake surface area 869 km 2 Total lake volume 1.95 x 10 9 m 3 Average water depth 2.24 m

27
Change in Bathymetry (1939 to 1968)
")
28
Change in Bathymetry (1968 to 1998) The Manggahan Floodway is a major source of sediment.
 The Manggahan Floodway is a major source of sediment.")
29
Immediate and long-term solutions to Laguna de Bay inundation … Increase the number of channels draining the lake - widen Taguig River and revive other rivers in Taguig Delta Plain. For the long-term, modification of Napindan structure might be required. Increase the capacity of Pasig River through channel widening – remove major constrictions. … a shallow but wide channel is more efficient than a deep but narrow channel because the gradient is almost flat. … allow planned, episodic high discharges to flush accumulated sediment and other debris within the channel. Control erosion in the watersheds and sedimentation in Laguna de Bay. We need a good forest cover.

30
The Ondoy tragedy is due to an extreme event … But ….. Magnitude and extent could have been much less Given wider and deeper channel ways Greater capacities of natural retention ponds For the future, among others we should increase, widen and deepen our channel ways, implement easement rules, reforest, allocate retention ponds

31
FLOOD HEIGHT: 4-5m Houses on stilt in Candaba Photo by J. Ong

Similar presentations


 and Debra Lam (Arup).>")


