Download presentation
Presentation is loading. Please wait.

1
Università degli Studi di Roma “La Sapienza” Dipartimento di Meccanica e Aeronautica Biomedical applications of a Contact Resistance Variation p-mat Roberto Steindler Tel Aviv University Fleishman Faculty of Engineering Dept. of Biomedical Enginering

2
DMA pressure map sensor:applications Static and dynamic fatiguing exercises: postural stability increases, particularly in one leg stance posture – the p-mat can be used to quantify the increases Functional Reach test - the p-mat can be used to control the test is made correctly Human hopping and lower limb diagnostic - the p-mat can be used to analyse hopping characteristics Normal sitting involves displacements and changes in p-distribution - the p-mat can be used to acquire the changes in view of decubitus ulcer prevention

3
The p-mat sensor Conductive strips velostat kapton row kapton column velostat Contact resistences Lateral view Sensor of 32x64=2048 sensing elementsDimentions: 16x32 cm 2

4
The new p-mat sensor

5
Thickness:150 m Range: 400 – 500 kPa Sensitivity threshold: 15 – 20 kPa No hysteresis No response delay Some drift The p-mat sensor

6
Human posture Human posture is a dynamic fact Human posture is characterized by body sway Body sway increases with fatigue One leg posture underlines the body sway Postural stability (or instability) can be shown by a p- mat acquisitions
 can be shown by a p- mat acquisitions")
7
Plantar pressure map acquisition during one leg posture

8
How postural stability can be quantified? COP coordinates are calculated for each acquisition (30s) X COP (t) and Y COP (t) are plotted and RMS(x) and RMS(y) are calculated FFT come from time trends and maximum significative frequencies are shown COP trajectory (stabilogram) is plotted and its length and area are calculated All these parameters can be assumed as postural stability indexes: the greatest the index is
 X COP (t) and Y COP (t) are plotted and RMS(x) and RMS(y) are calculated FFT come from time trends and maximum significative frequencies are shown COP trajectory (stabilogram) is plotted and its length and area are calculated All these parameters can be assumed as postural stability indexes: the greatest the index is.")
9
Fatigue effect on postural stability p maps are acquired (three 30 s acquisitions or longer time acquisitions) Fatiguing exercise p map acquisitions Postural stability indexes are calculated before and after the fatiguing exercise Index variations for single subjects and for a whole population are calculated Statistic tests are applied to index variations
 Fatiguing exercise p map acquisitions Postural stability indexes are calculated before and after the fatiguing exercise Index variations for single subjects and for a whole population are calculated Statistic tests are applied to index variations")
10
Y COP X COP 20 frames=1s Amplitude (distancerows/columns: 0.5cm) 20 frames=1s RMS Y COP 0.30 cm RMS X COP 0.21 cm RMS Y COP 0.61 cm RMS X COP 0.28 cm X COP and Y COP displacements vs time and the corresponding RMS values before a fatiguing exercise X COP and Y COP displacements vs time and the corresponding RMS values after the fatiguing exercise X COP and Y COP - time trend
 20 frames=1s RMS Y COP 0.30 cm RMS X COP 0.21 cm RMS Y COP 0.61 cm RMS X COP 0.28 cm X COP and Y COP displacements vs time and the corresponding RMS values before a fatiguing exercise X COP and Y COP displacements vs time and the corresponding RMS values after the fatiguing exercise X COP and Y COP - time trend")
11
Frequency [Hz] Frequency amplitude [mm/Hz] X COP and Y COP - frequency spectrums X COP Frequency amplitude [mm/Hz] Y COP Frequency [Hz] X COP Y COP Frequency amplitude [mm/Hz] Frequency [Hz] frequency spectrum of the X COP and Y COP signals before a fatiguing exercise frequency spectrum of the X COP and Y COP signals after the fatiguing exercise
![Frequency [Hz] Frequency amplitude [mm/Hz] X COP and Y COP - frequency spectrums X COP Frequency amplitude [mm/Hz] Y COP Frequency [Hz] X COP Y COP Frequency amplitude [mm/Hz] Frequency [Hz] frequency spectrum of the X COP and Y COP signals before a fatiguing exercise frequency spectrum of the X COP and Y COP signals after the fatiguing exercise](http://images.slideplayer.com/13/4102121/slides/slide_11.jpg "Frequency [Hz] Frequency amplitude [mm/Hz] X COP and Y COP - frequency spectrums X COP Frequency amplitude [mm/Hz] Y COP Frequency [Hz] X COP Y COP Frequency amplitude [mm/Hz] Frequency [Hz] frequency spectrum of the X COP and Y COP signals before a fatiguing exercise frequency spectrum of the X COP and Y COP signals after the fatiguing exercise")
12
Scarto quadratico medio di Xb e Yb: Analisi in frequenza: Massima ampiezza Frequenza in corrispondenza alla massima ampiezza Massima frequenza significativa

13
Rows Columns Length: 53.5 cm Area: 1.01 cm 2 Stabilogram before a fatiguing exercise Stabilogram after the fatiguing exercise The stabilogram characteristics Rows Length: 80.6 cm Area: 2.16 cm 2

14
Static fatiguing protocols Weight on dominant leg 30 s single stance posture (acquisition) 4 min of fatiguing exercise 30 s single stance posture (acquisition) Keeping Crouching 5 min single stance posture (acquisition) Fatiguing exercise: as long as possible 5 min single stance posture (acquisition)
 4 min of fatiguing exercise 30 s single stance posture (acquisition) Keeping Crouching 5 min single stance posture (acquisition) Fatiguing exercise: as long as possible 5 min single stance posture (acquisition)")
15
Cycling on a cyclette at 20 km/h an increasing inclinations Dynamic fatiguing protocols 3 min and 30 s single stance posture (acquisition) Fatiguing exercise :4 min and 30 s 3 min and 30 s single stance posture (acquisition) Fatiguing exercise:12 min 3 min and 30 s single stance posture (acquisition) Aerobic run on a treadmill
 Fatiguing exercise :4 min and 30 s 3 min and 30 s single stance posture (acquisition) Fatiguing exercise:12 min 3 min and 30 s single stance posture (acquisition) Aerobic run on a treadmill")
16
Weight on dominant leg 30 s with dominant leg on p-mat, contralateral knee flexed at 90°, hands resting on waist 4 min sitting in upright position, 10 kg dead weight hanged up with a strap on the dorsal aspect of the dominant foot Each subject repeats the protocol three times in three different days

17
10 young healthy subjects (9 males, 1 female) Age 26.5 1 years All the subjects have given their approval The results of each subject come from the means of the three acquisitions Weight on dominant leg
 Age 26.5 1 years All the subjects have given their approval The results of each subject come from the means of the three acquisitions Weight on dominant leg")
18
The whole population mean values, the standard deviations and the percentage increases of the postural stability indexes from non fatigued to fatigued condition standing on the dominant leg Weight on dominant leg increase 36%21%38%31%32%54%

19
Weight on dominant leg

20
5 min with dominant leg on p- mat, contralateral knee flexed at 90°, hands resting on waist Keeping crouching with knee flexed at 90° as long as possible Crouching fatiguing protocol

21
11 young healthy subjects (7 males, 4 females) Age 25.2 1.3 years Crouching fatiguing protocol All the subjects have given their approval The results of each subject come from the means of the 30 s ten periods
 Age 25.2 1.3 years Crouching fatiguing protocol All the subjects have given their approval The results of each subject come from the means of the 30 s ten periods")
22
The whole population mean values, the standard deviations and the percentage increases of the postural stability indexes from non fatigued to fatigued condition standing on the dominant leg Crouching fatiguing protocol -

24
3 min and 30 s with dominant leg on p-mat, contralateral knee flexed at 90°, hands resting on waist 4 min and 30 s cycling at 20 km/h at the growing inclinations Cyclette fatiguing protocol

25
10 young healthy subjects (5 males, 5 females) Age: 25,5 + 1,5 years All the subjects have given their approval The results of each subject come from the means of the 30 s seven periods
 Age: 25,5 + 1,5 years All the subjects have given their approval The results of each subject come from the means of the 30 s seven periods")
26
The whole population mean values, the standard deviations and the percentage increases of the postural stability indexes from non fatigued to fatigued condition standing on the dominant leg Cyclette fatiguing protocol -

28
12 min min running at the anaerobic speed 3 min and 30 s with dominant leg on p-mat, contralateral knee flexed at 90°, hands resting on waist Treadmill fatiguing protocol

29
10 subjects (9 males, 1 female) Age 25.9 3.5 Treadmill fatiguing protocol All the subjects have given their approval The results of each subject come from the means of the 30 s seven periods
 Age 25.9 3.5 Treadmill fatiguing protocol All the subjects have given their approval The results of each subject come from the means of the 30 s seven periods")
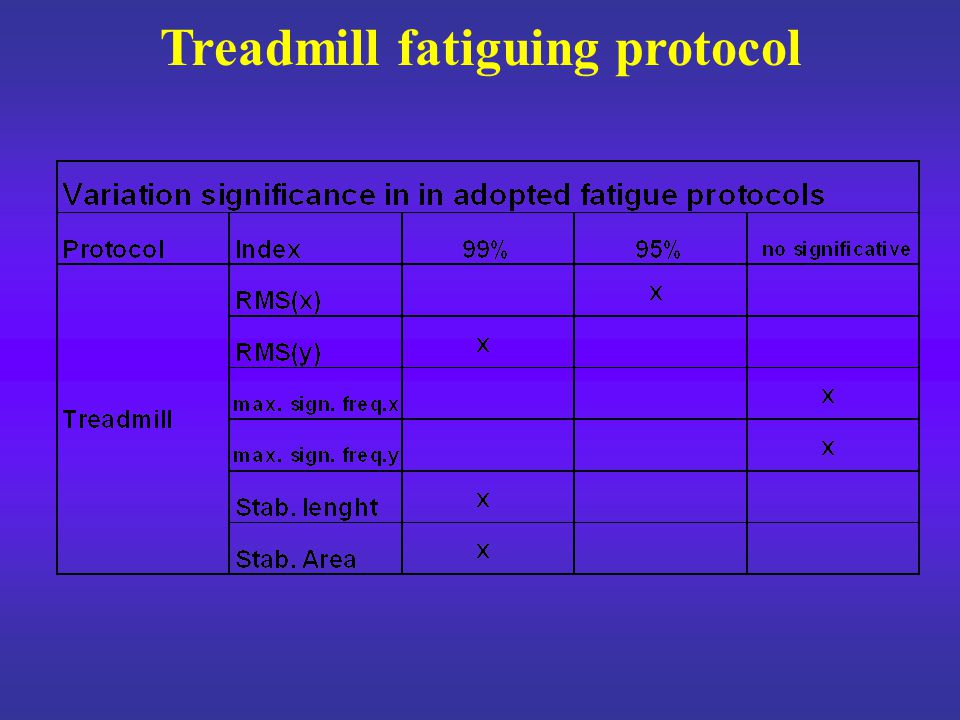
30
Treadmill fatiguing protocol

32
Functional Reach Test Functional Reach: is the maximal distance one can reach forward beyond prevalent arm lenght, while mantaining a fixed base of support in a a standing position Test start: right angle with the trunk Correct test: the clenched fist must be mantained at the same height; the heel must not rise

33
Functional Reach: a test run varing normal posture A test which can put in evidence muscolar-skeletal or neurological problems These problems change the ability in mantaining equilibrium The movement during the test is natural and istinctive

34
Facilities A tape is used to misure the Functional Reach The p-mat is used to control the test (the heels do not rise) From the p-map acquisitions the CoP trajectory and its components can be plotted
 From the p-map acquisitions the CoP trajectory and its components can be plotted")
35
Parameters acquired during Functional Reach test 2) CoP displacement in test direction - CoP [cm] 1) Functional Reach displacement - FR[cm] 3) Test lenght – time [s]
![Parameters acquired during Functional Reach test 2) CoP displacement in test direction - CoP [cm] 1) Functional Reach displacement - FR[cm] 3) Test lenght – time [s]](http://images.slideplayer.com/13/4102121/slides/slide_35.jpg "Parameters acquired during Functional Reach test 2) CoP displacement in test direction - CoP [cm] 1) Functional Reach displacement - FR[cm] 3) Test lenght – time [s]")
36
Plantar pressure acquisition with p-mat

37
X-CoP(t) and Y-CoP(t) Test lenght: 15 s Subjects stands upright 5 s Functional Reach movement Waiting upright stabilogram
 and Y-CoP(t) Test lenght: 15 s Subjects stands upright 5 s Functional Reach movement Waiting upright stabilogram")
38
Functional Reach test - execution Tested populations 20 young healthy subject ; 10 males and 10 females; medium age: 22,3 ± 2,1 years 14 elder healthy subjects ; 11 males and 3 females; medium age 61,5 ± 3,8 years All the subjects are healthy (no orthopedic or neurological problems) and they can mantein upright position at least 10 minutes All subjects have given their approval Each subject runs three tests at natural speed and three tests at maximum speed allowed by his status The resuslts of each subject (Functional Reach and CoP in the two conditions), come from the means of three acquisitions
 and they can mantein upright position at least 10 minutes All subjects have given their approval Each subject runs three tests at natural speed and three tests at maximum speed allowed by his status The resuslts of each subject (Functional Reach and CoP in the two conditions), come from the means of three acquisitions")
39
Population’s Results Young subjects Elder subjects

40
Result comparison Comparison between young and elder subjects

41
About results FR young: normal speed 35,6 ± 3,5 cm; max speed 35,0 ± 3,5 cm CoP young: normal speed 7,0 ± 1,7 cm; max speed 7,4 ± 1,5 cm FR elder: normal speed 31,0 ± 4,3 cm; max speed 28,9 ± 2,6 cm CoP elder: normal speed 5,1 ± 1,5 cm; max speed 5,1 ± 1,1 cm Functional Reach decreases for both population from normal to maximum speed; the decrease, significative 95% only for elder population, comes from requirement of going back as soon as possible to the upright position CoP movement shows a light increase from normal to maximum speed; the increase means a grater effort in mantaining equilibrium Functional Reach decreases from young to elder population both at normal and maximum speed; the decrease significance is 99% Also CoP movements decreases from young to elder population both at normal and maximum speed; also in this case the decrease significance is 99%

42
About Functional Reach The comparison shows a significant decrease of FR and CoP with age Functional Reach measure may identify damages that cause balance instability Functional Reach test can be extended to not completely self- sufficient subjects (ictus, Parkinson, Alzheimer, orthopedic traumas) Functional reach is a real clinical test to compare different age population
 Functional reach is a real clinical test to compare different age population")
43
Human hopping Characteristics and purposes of human hopping test By the p-mat it is possible to measure flight lenght; it is also possible to study the “take-off” and the “landing” characteristics Normal hopping and abnormal hopping can be compared Human hopping analysis is useful for limb diagnostic

44
Hopping test description 30 seconds hopping from 6 healthy subjects 3 test from each subject after their approval Hopping phases Take-offLandingFlight lenght

45
Plantar pressure acquisitions Two legs hoppingOne leg hopping

46
About hopping During take-off and landing anterior foot is more loaded During landing weight increases are about 15% Time flight decreases from test n°1 to test n°3 flight lenght and flight height decrease as the subjects is getting fatigued The test is a not invasive test and can be applied to sporting people Preliminar results

47
Decubitus ulcer prevention To be developed common program Roma – Tel Aviv Acquiring p-maps during healthy subjects sitting Characterization of buttom displacements Imposing the dispalcements to invalid subjects Decubitus ulcer prevention

48
THANK YOU FOR YOUR ATTENTION

Similar presentations


 n Important component.>")


