Download presentation
Presentation is loading. Please wait.

1
Eric Luebehusen Meteorologist eluebehusen@oce.usda.gov 202-720-3361 Northern Hemisphere Weather Outlook for Spring and Summer USDA Agricultural Outlook Forum February 24, 2012

2
A Few Quick Notes about Forecasting….

3
? The primary difference among forecasters and their respective forecasts is the amount of time it takes people to figure out they were wrong. –Yours Truly

4
Case In Point: On December 29, 2000 (yes, I remember)… In line with NWS and TV Meteorologists, I strongly advised family and friends of an impending 12-18” snowstorm for much of central MD…
… In line with NWS and TV Meteorologists, I strongly advised family and friends of an impending snowstorm for much of central MD…")
5
My family still brings it up.

6
? But it’s not just meteorologists…

7
"We see no serious broad spillover to banks or thrift institutions from the problems in the subprime market." – Ben Bernanke, May 2007 ? Dow Jones

8
"We see no serious broad spillover to banks or thrift institutions from the problems in the subprime market." – Ben Bernanke, May 2007 Dow Jones

9
? … and then there’s sports.

10
Of the 12 ESPN “Experts”, all failed to pick the eventual Super Bowl Winner, and none had the eventual winner even making it to the game (only 1 picked the Giants make the playoffs).
.")
11
Now that I have set the stage… let’s give it a spin!

12
Primary Tools for Long Range Forecasts · Current: “Where do we stand heading into the spring?”

13
Primary Tools for Long Range Forecasts · Current: “Where do we stand heading into the spring?” · Climate Indices: El Nino, La Nina, North Atlantic Oscillation (NAO), etc… NAO Timeseries
, etc… NAO Timeseries")
14
Primary Tools for Long Range Forecasts · Current: “Where do we stand heading into the spring?” · Climate Indices: El Nino, La Nina, North Atlantic Oscillation (NAO), etc… · Models: GFS, Ensemble Means, CFS, etc…
, etc… · Models: GFS, Ensemble Means, CFS, etc…")
15
Primary Tools for Long Range Forecasts · Current: “Where do we stand heading into the spring?” · Climate Indices: El Nino, La Nina, North Atlantic Oscillation (NAO), etc… · Models: GFS, Ensemble Means, CFS, etc… · Agency: Experts from NWS-CPC, IRI, UK Met Office, etc…
, etc… · Models: GFS, Ensemble Means, CFS, etc… · Agency: Experts from NWS-CPC, IRI, UK Met Office, etc…")
16
Primary Tools for Long Range Forecasts · Current: “Where do we stand heading into the spring?”

17
Fall Drought led to poor crop establishment in eastern Europe and Ukraine…

18
In contrast, above-normal rainfall benefited wheat in nrn Africa and Russia

19
During the winter, conditions vastly improved over Ukraine and the Balkans, but a good spring will be vital for winter grains and oilseeds

20
Conversely, Spain (and to a lesser extent Morocco) has slipped rapidly into drought, raising concerns for their wheat and barley; Spain, however, accounts for only ~5% of EU Wheat
 has slipped rapidly into drought, raising concerns for their wheat and barley; Spain, however, accounts for only ~5% of EU Wheat")
21
Year-to-Year change in soil moisture highlights the dryness

22
The bigger concern in Europe will be the amount of winterkill in northern wheat and rapeseed areas…

23
The threshold for burnback/winterkill is ~ -18°C (0°F); Min temps are overlaid on wheat areas, and lack of snow cover in key wheat and rapeseed areas of northeast Germany and northwest Poland increasing the risk for winterkill The threshold for burnback/winterkill is ~ -18°C (0°F); Min temps are overlaid on wheat areas, and lack of snow cover in key wheat and rapeseed areas of northeast Germany and northwest Poland increasing the risk for winterkill
; Min temps are overlaid on wheat areas, and lack of snow cover in key wheat and rapeseed areas of northeast Germany and northwest Poland increasing the risk for winterkill The threshold for burnback/winterkill is ~ -18°C (0°F); Min temps are overlaid on wheat areas, and lack of snow cover in key wheat and rapeseed areas of northeast Germany and northwest Poland increasing the risk for winterkill")
24
Also France’s durum wheat (threshold closer to -10°C (14°F). Also France’s durum wheat (threshold closer to -10°C (14°F).
..")
25
We won’t know the full impact of the freeze until crops emerge in the spring

26
Farther east, China’s primary winter wheat benefited from favorable autumn pcp

27
China’s rapeseed – which like wheat is irrigated – experienced some dryness (but favorably wet leading up to planting)
")
28
A favorable end to the monsoon was likewise beneficial for India’s wheat and rapeseed, which is also irrigated…

29
Much of Asia’s wheat and rapeseed is heavily irrigated, due in part to the strong seasonality of the pcp

30
In fact, winter is a very dry time of year over much of central and eastern Asia, so small departures can yield alarming percent of normal values.

31
Winter crop prospects are mostly favorable, but localized autumn drought (Ukraine, eastern EU), a cold snap (northern EU), and developing drought (Spain) reveal potential yield-impacting issues
, a cold snap (northern EU), and developing drought (Spain) reveal potential yield-impacting issues")
32
In South & East Asia, winter crop prospects are currently favorable with no major underlying issues

33
Primary Tools for Long Range Forecasts · Currently: “Where do we stand heading into the spring?” · Climate Indices: El Nino, La Nina, North Atlantic Oscillation (NAO), etc… NAO Timeseries
, etc… NAO Timeseries")
34
La Niña/El Niño Impacts La Niña weather impacts are greatest the closer you are to the actual phenomenon

35
The spring La Niña temperature correlation is weak, but toward the cool side The spring La Niña temperature correlation is weak, but toward the cool side Cool Warm Cool Data provided by the NOAA/ESRL Physical Sciences Division, Boulder Colorado from their Web site at http://www.esrl.noaa.gov/psd

36
With a weakening La Niña, the summer temperature correlation is less likely to verify; nevertheless, the overall idea is still the same. Cool Warm Data provided by the NOAA/ESRL Physical Sciences Division, Boulder Colorado from their Web site at http://www.esrl.noaa.gov/psd

37
Wet Dry Wet Dry The weak EU/FSU La Niña precip correlation shows a gradual eastward shift of the initial Iberian wetness and northern Europe dryness. Meanwhile, the signal in China and India shift north and weaken with time (Spring Pcp Relationship Depicted) The weak EU/FSU La Niña precip correlation shows a gradual eastward shift of the initial Iberian wetness and northern Europe dryness. Meanwhile, the signal in China and India shift north and weaken with time (Spring Pcp Relationship Depicted)
 The weak EU/FSU La Niña precip correlation shows a gradual eastward shift of the initial Iberian wetness and northern Europe dryness. Meanwhile, the signal in China and India shift north and weaken with time (Spring Pcp Relationship Depicted).")
38
Data provided by the NOAA/ESRL Physical Sciences Division, Boulder Colorado from their Web site at http://www.esrl.noaa.gov/psd Wet Dry Wet Dry The weak EU/FSU La Niña precip correlation shows a gradual eastward shift of the initial Iberian wetness and northern Europe dryness. Meanwhile, the signal in China and India shift north and weaken with time (Summer Pcp Relationship Depicted) The weak EU/FSU La Niña precip correlation shows a gradual eastward shift of the initial Iberian wetness and northern Europe dryness. Meanwhile, the signal in China and India shift north and weaken with time (Summer Pcp Relationship Depicted)
 The weak EU/FSU La Niña precip correlation shows a gradual eastward shift of the initial Iberian wetness and northern Europe dryness. Meanwhile, the signal in China and India shift north and weaken with time (Summer Pcp Relationship Depicted).")
39
In short, La Niña supports a cooler- and drier-than-normal spring in nrn India and much of China Warm Cool Wet Dry

40
If La Niña holds on into the summer, it would suggest cooler summer weather and some enhanced nrn rainfall in Asia Warm Cool Wet Dry Warm

41
While La Niña does play a small role in Europe, there’s a much closer, larger-impacting phenomenon to assess… Warm Cool Wet Dry Cool

42
While La Niña does play a small role in Europe, there’s a much closer, larger-impacting phenomenon to assess…

43
The NAO (North Atlantic Oscillation) is, in short, a means of measuring the flow aloft over the northern Atlantic The NAO (North Atlantic Oscillation) is, in short, a means of measuring the flow aloft over the northern Atlantic H Iceland Low L Azores High COLD WARM
 is, in short, a means of measuring the flow aloft over the northern Atlantic The NAO (North Atlantic Oscillation) is, in short, a means of measuring the flow aloft over the northern Atlantic H Iceland Low L Azores High COLD WARM")
44
During a “Positive” Phase, one or both of the main drivers is stronger than normal, enhancing the flow (I call it the “North Atlantic Shop Vac”) During a “Positive” Phase, one or both of the main drivers is stronger than normal, enhancing the flow (I call it the “North Atlantic Shop Vac”) H Iceland Low + L Azores High COLD WARM
 During a Positive Phase, one or both of the main drivers is stronger than normal, enhancing the flow (I call it the North Atlantic Shop Vac ) H Iceland Low + L Azores High COLD WARM")
45
Iceland “Blocking High” L - H Azores “Low” During a “Negative” Phase, one or both of the main drivers is weaker or reversed, disrupting the flow and buckling the jet stream COLD WARM

46
During a “Negative” Phase, one or both of the main drivers is weaker or reversed, disrupting the flow and buckling the jet stream Iceland “Blocking High” L - H Azores “Low” COLD WARM

47
The NAO operates on many scales; A decadal signal is evident (using 3-month avg: Jan-Mar)… The NAO operates on many scales; A decadal signal is evident (using 3-month avg: Jan-Mar)… - Source: NOAA/NCEP Climate Prediction Center + Fast Flow Blocking High
… The NAO operates on many scales; A decadal signal is evident (using 3-month avg: Jan-Mar)… - Source: NOAA/NCEP Climate Prediction Center + Fast Flow Blocking High")
48
But embedded within this is considerable year-to-year variability… But embedded within this is considerable year-to-year variability… Source: NOAA/NCEP Climate Prediction Center - + Fast Flow Blocking High

49
Fast Flow Blocking High The monthly-average NAO was negative in 2009 & 2010, but reverted back to positive for much of 2011 The monthly-average NAO was negative in 2009 & 2010, but reverted back to positive for much of 2011 20092010 2011 Data from NWS, Climate Prediction Center Monthly NAO Index

50
Embedded within this are notable daily/weekly fluctuations… Data from NWS, Climate Prediction Center Fast Flow Blocking High 20092010 2011 Monthly NAO Index

51
2009 20102011 NovDec JanFeb This Season’s Daily NAO – Since October 24, 2011 Data provided by the NOAA/ESRL Physical Sciences Division, Boulder Colorado from their Web site at http://www.esrl.noaa.gov/psd

52
2009 20102011 NovDec JanFeb Northern France: Daily Temperature Departure (°C) Daily NAO Index The NAO-Europe Wx relationship, not surprisingly, is nearly instantaneous
 Daily NAO Index The NAO-Europe Wx relationship, not surprisingly, is nearly instantaneous")
53
2009 20102011 NovDec JanFeb Northern France: Daily Temperature Departure (°C) Daily NAO Index The NAO-Europe Wx relationship, not surprisingly, is nearly instantaneous
 Daily NAO Index The NAO-Europe Wx relationship, not surprisingly, is nearly instantaneous")
54
Data provided by the NOAA/ESRL Physical Sciences Division, Boulder Colorado from their Web site at http://www.esrl.noaa.gov/psd The NAO winter correlation for Europe and the Mediterranean has been almost spot on (precip depicted), although the sharply negative NAO in Feb reversed the impacts for a while Dry Wet Dry Wet
, although the sharply negative NAO in Feb reversed the impacts for a while Dry Wet Dry Wet")
55
Knowing how strong the relationship is going forward, a continuation of the current positive NAO would lead to spring warmth in the north Cool Warm Cool Data provided by the NOAA/ESRL Physical Sciences Division, Boulder Colorado from their Web site at http://www.esrl.noaa.gov/psd

56
Spring dryness would have a higher-than-normal likelihood of occurring in western FSU/Mideast, with a dry bias in most growing areas Wet Dry Cool Wet Dry Wet Data provided by the NOAA/ESRL Physical Sciences Division, Boulder Colorado from their Web site at http://www.esrl.noaa.gov/psd

57
Summer would feature more of the same temperature wise, although the contrast over Europe and the Middle East strengthens. Warm Cool Data provided by the NOAA/ESRL Physical Sciences Division, Boulder Colorado from their Web site at http://www.esrl.noaa.gov/psd

58
Summer dryness would become an increasing concern across the north is we maintain the current positive NAO cycle Wet Dry Cool Wet Dry Data provided by the NOAA/ESRL Physical Sciences Division, Boulder Colorado from their Web site at http://www.esrl.noaa.gov/psd

59
In short, a continuation of a positive NAO would point to increasingly warm, dry conditions in nrn Europe contrasting with cooler, wetter weather farther south and east Dry Wet Dry Warm Cool

60
How does this compare with the latest IRI Spring forecast?

61
The IRI Spring Precip Outlook does not lean in either direction, except for depicting some dryness in the Mideast, while the NAO supports more widespread dry weather Dry Wet Dry

62
The IRI Spring Temperature Outlook supports the NAO’s warm EU signal but is opposite of the NAO’s Mideast/Black Sea region’s cool Warm Cool

63
Farther East, the IRI Asia Spring Precip Outlook more or less lines up with the La Niña signal, which would dominate due to the proximity to the Pacific Ocean Farther East, the IRI Asia Spring Precip Outlook more or less lines up with the La Niña signal, which would dominate due to the proximity to the Pacific Ocean Dry Wet Dry

64
Conversely, outside of equatorial areas, the IRI Spring Temperature Outlook quite different from the La Niña correlation, strongly suggesting other overwhelming factors at play Cool

65
Seasonal Outlook - Conclusions

66
The NAO is forecast to remain in a positive phase into early March, which supports a warmer- and drier-than-normal weather to begin the spring from Europe into western portions of the FSU Dry Wet Dry Warm Cool

67
Persistence would support an unfavorable forecast of warmth and dryness during the summer in Europe and western FSU, while favorable weather would persist in the Mediterranean Dry Wet Dry Warm Cool

68
Seasonal Outlook - Conclusions

69
In Asia, the disparity between expert IRI outlooks and La Niña temperature correlation means – as one would expect – that other issues are weighing heavily into the equation. Given the IRI high probability and the waning La Niña, it is hard to discount the warmer-than-normal weather forecast by IRI for the spring. Warm Cool

70
The spring precipitation correlation and IRI forecast line up better, leading to the expectation of wet weather in Indochina and southern India to contrast with drier conditions in the primary winter wheat and rapeseed areas. Dry Wet Dry

71
A waning La Niña does not offer much confidence, but lingering summer impacts would include cooler conditions in the south with wetter weather in northern China Wet Dry Warm Cool Warm

72
How about the next week?

73
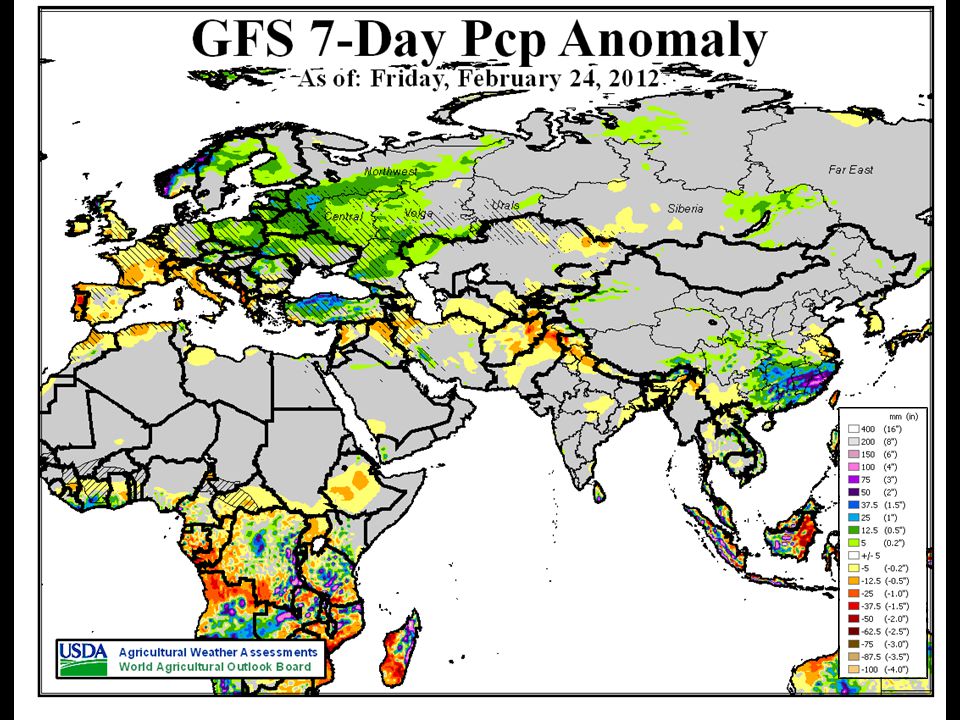
GFS Pcp Data provided in GIS format by the NOAA/NWS Climate Prediction Center, Washington, D.C.

76
DRY WET LOCUSTS HOT DROUGHT Example: Hi-resolution Ensemble Forecast Model

77
Eric Luebehusen Meteorologist eluebehusen@oce.usda.gov 202-720-3361 Questions?

Similar presentations


, it is all the players on the field that count (Joe Bastardi of Accu-Weather).”>")


 Winter Weather Forecast Conference OMSI / Oregon Chapter of the AMS 29 October 2011 Winter Weather Forecast Conference OMSI.>")


