Download presentation
Presentation is loading. Please wait.

1
Observations show that the increase of carbon dioxide is fully caused by human activities Pieter P. Tans NOAA Earth System Research Laboratory Boulder, Colorado AGU fall meeting 10 December 2007

3
Fossil fuel data: CDIAC and BP DECADAL MASS BALANCE OF CARBON

4
Pulse response: CO2 ATM = 0.131 + 0.201 exp( -t /363) + 0.321 exp( -t /74) + + 0.249 exp ( -t /17) + 0.098 exp( -t /1.9) DECADAL MASS BALANCE OF CARBON Hamburg Ocean Carbon Cycle Model, E.Maier-Reimer, 1987
 exp( -t /74) exp ( -t /17) exp( -t /1.9) DECADAL MASS BALANCE OF CARBON Hamburg Ocean Carbon Cycle Model, E.Maier-Reimer, 1987")
5
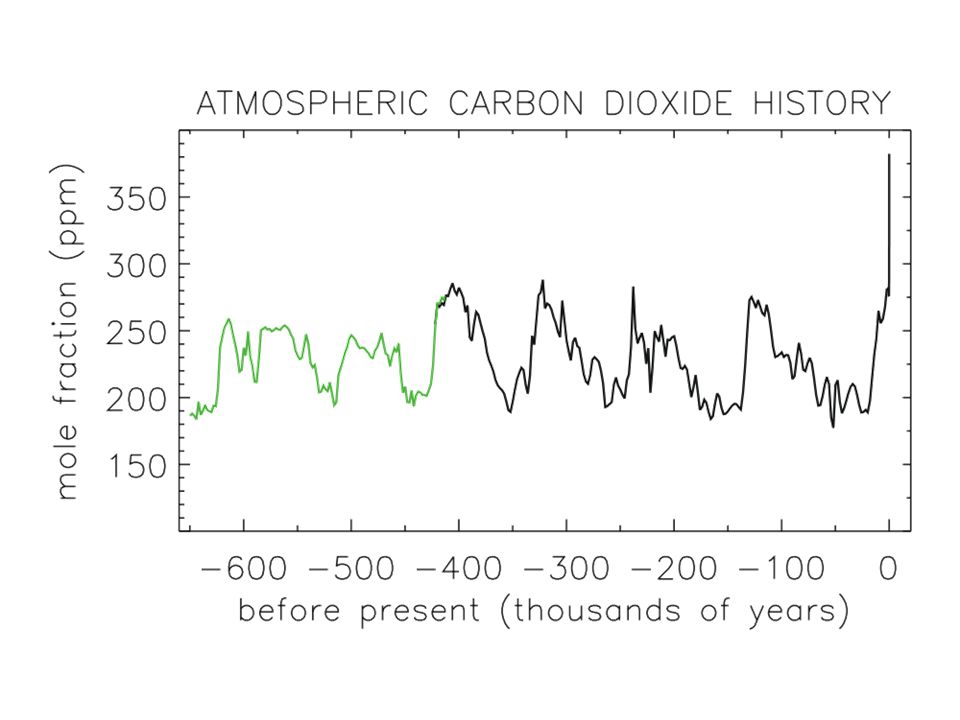
sources: David Etheridge, CSIRO, Australia; ESRL DECADAL MASS BALANCE OF CARBON

6
GtC Cumulative fossil fuel emissions (Jan. 2007)331 ± 25 (source: CDIAC) Observed atmospheric increase (Jan. 2007)214 ± 8 (source: ESRL) Observed ocean increase through 1994118 ± 19 (Sabine et al., Science 2004) oceans, extrapolated through 2006148 DECADAL MASS BALANCE OF CARBON fossil fuel emissions + terrestrial sources = atmospheric increase + ocean
331 ± 25 (source: CDIAC) Observed atmospheric increase (Jan. 2007)214 ± 8 (source: ESRL) Observed ocean increase through ± 19 (Sabine et al., Science 2004) oceans, extrapolated through DECADAL MASS BALANCE OF CARBON fossil fuel emissions + terrestrial sources = atmospheric increase + ocean.")
7
DECADAL MASS BALANCE OF CARBON fossil fuel emissions + terrestrial sources = atmospheric increase + ocean Hamburg Ocean Carbon Cycle Model, E. Maier-Reimer, 1987

8
DECADAL MASS BALANCE OF CARBON fossil fuel emissions + terrestrial sources = atmospheric increase + ocean Princeton Ocean Carbon Cycle Model, J. Sarmiento, 1992

9
DECADAL MASS BALANCE OF CARBON fossil fuel emissions + terrestrial sources = atmospheric increase + ocean Bern Model (HILDA), F. Joos, 2005

10
Conclusions: The observed increase in atmospheric carbon dioxide since pre-industrial times is entirely due to human activities. The measured increases in the atmosphere and oceans add up to the cumulative fossil fuel emissions. The relative contribution of NET changes in terrestrial biomass and organic matter has dwindled over time and is now relatively small. DECADAL MASS BALANCE OF CARBON

11
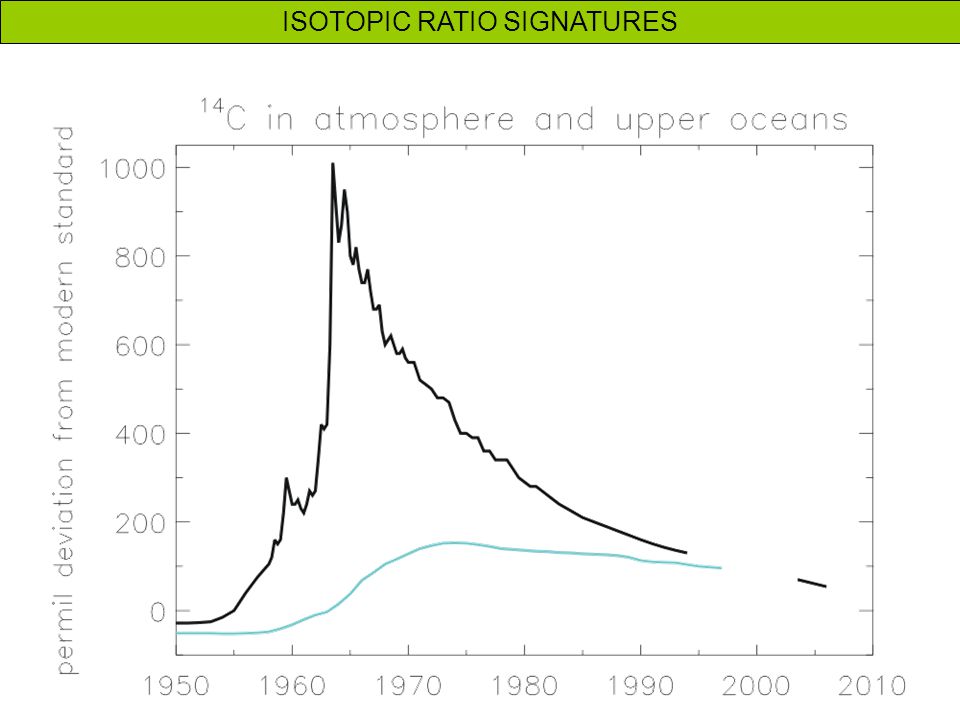
Use of isotopic ratios to distinguish sources 13 C/ 12 C sample – 13 C/ 12 C reference 13 C/ 12 C reference 14 C/C sample δ 13 C 13 C/ 12 C ratio 14 C/C reference (approximate) (approximate) Atmosphere -8 ‰ 0.011147 1.06 From oceans -8 ‰ 0.011147 1.08 Terrestrial biosphere -26 ‰ 0.010945 1.10 Coal -24 ‰ 0.010967 0 Oil -28 ‰ 0.010923 0 Natural gas -45 ‰ 0.010732 0 ISOTOPIC RATIO SIGNATURES
 (approximate) Atmosphere -8 ‰ From oceans -8 ‰ Terrestrial biosphere -26 ‰ Coal -24 ‰ Oil -28 ‰ Natural gas -45 ‰ ISOTOPIC RATIO SIGNATURES")
12
Sources: Friedli (1986), Francey (1999 ), and ESRL & INSTAAR ISOTOPIC RATIO SIGNATURES
, Francey (1999 ), and ESRL & INSTAAR ISOTOPIC RATIO SIGNATURES")
15
RECENT RATES OF CHANGE

16
more uptake

17
RECENT RATES OF CHANGE

18
5-year averaged, centered on 2000 (Gton C/year) 5-year averaged, centered on 2005 (Gton C/year) fossil emissions 7.0 8.1 atmos. increase 4.0 4.4 total uptake, 3.0 3.7 of which: oceans 2.9 3.2 terrestrial 0.1 0.5 RECENT RATES OF CHANGE carbon budgets

19
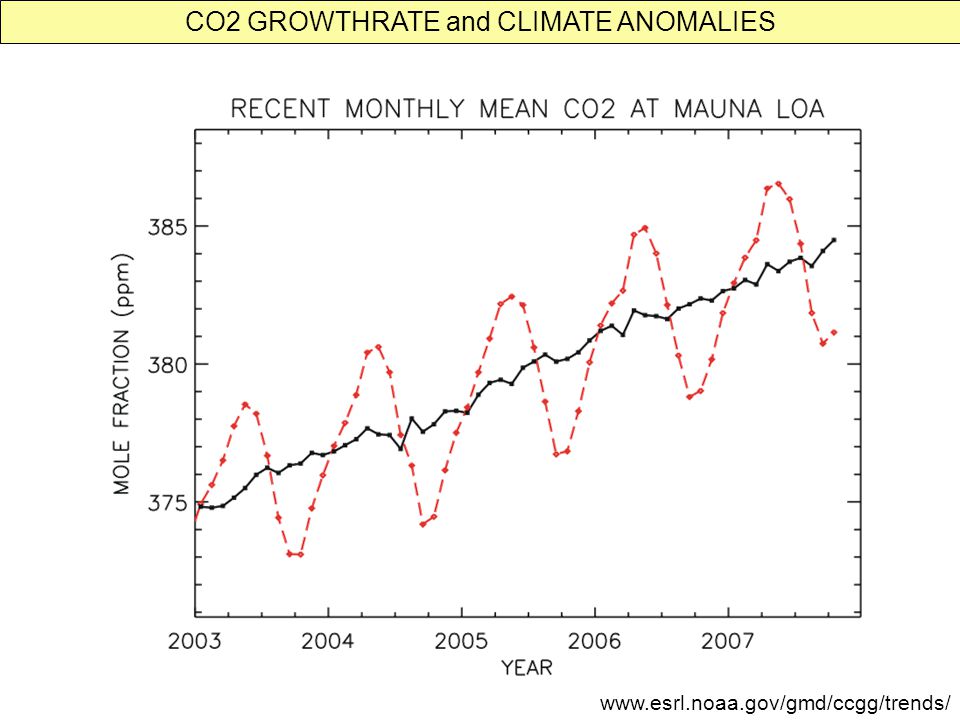
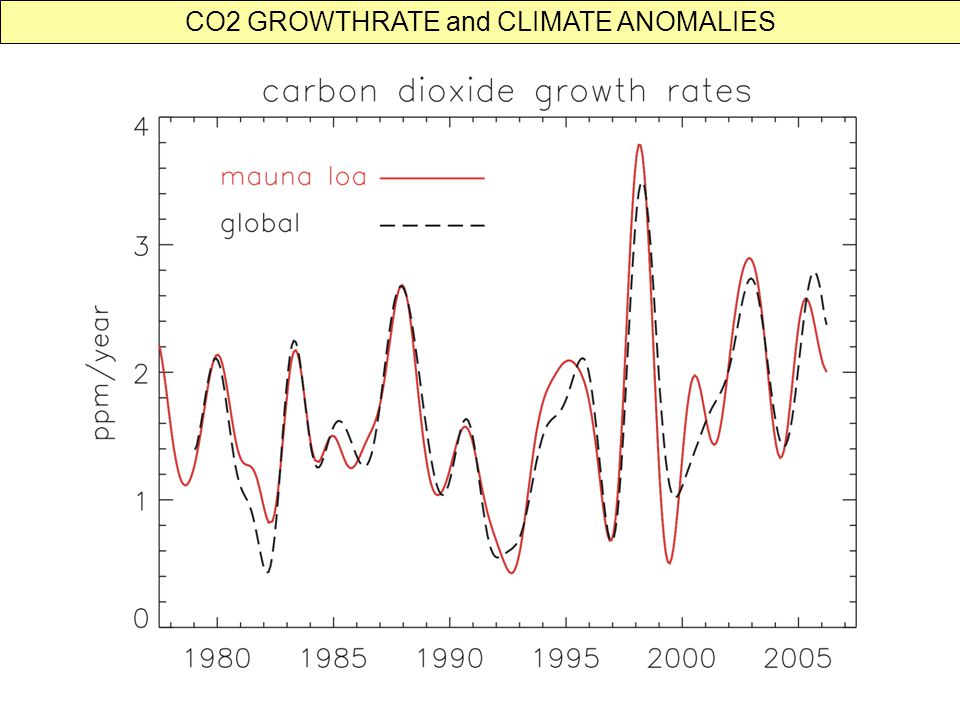
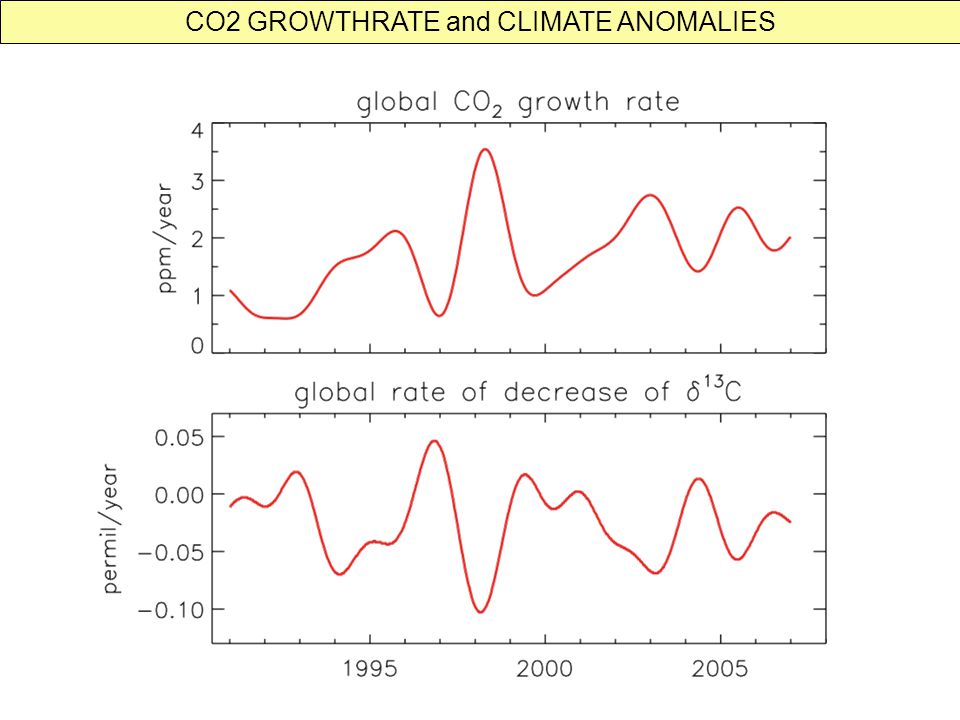
CO2 GROWTHRATE and CLIMATE ANOMALIES

22
www.esrl.noaa.gov/gmd/ccgg/trends/
23
CO2 GROWTHRATE and CLIMATE ANOMALIES

27
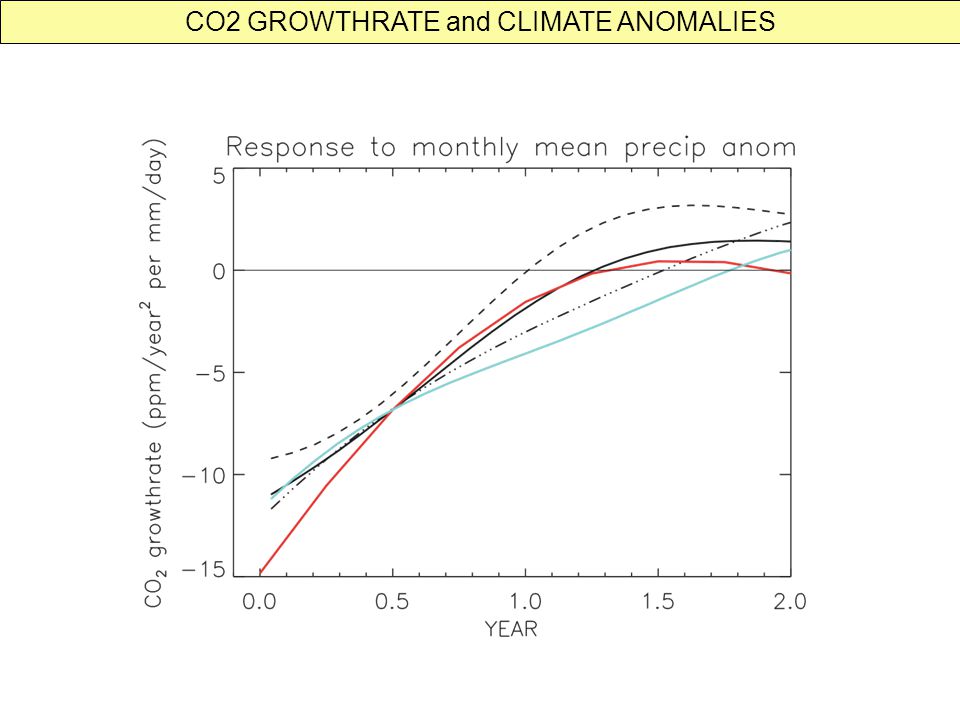
Conclusion: 2/3 of the interannual variance of the CO2 growth rate is explained by the delayed response of the terrestrial biosphere to interannual variations of temperature and precipitation. CO2 GROWTHRATE and CLIMATE ANOMALIES

Similar presentations


 Multiple species measurement What is expected from A.>")


 Sinks for Anthropogenic Carbon Physics Today August 2002 30-36.>")


 (1 GtC = 10 15 gC)>")


