Download presentation
Presentation is loading. Please wait.

1
Technion Israel Institute of Technology Introduction Denis Shteynberg M.Sc Aug 2013

3
Techion - Israel Institute of Technology Israel Institute of Technology Established at 1912 Located in Haifa, IsraelHaifa The university offers degrees in science and engineering, and related fields such as architecture, medicine, industrial management and education Has 18 academic departments and 52 research centers 13,000 students (9500 undergraduate) 3 Nobel prize winners
 3 Nobel prize winners")
4
Haifa city 3 rd largest city in Israel Pop of 300,000 Located at the north of Israel The city is a major seaport located on Israel's Mediterranean coastline in the Bay of Haifa Has the shortest subway line in the world

5
The faculty Civil & Environmental Engineering Vision Maintain and enhance the leading position of the Faculty of Civil & Environmental Engineering amongst the top departments in the world. Position the Faculty as the national center for research & development and human resources for the sustainable development of the national infrastructure of Israel. Consist of 9 departments : structural engineering, construction management, Geotechnology, Building Materials, Performance & Technology, Water Resources & Hydraulic Engineering, Transportation Engineering, Mapping & Geo-Information, Agricultural Engineering and Environmental Engineering.

6
About myself 29 years old Born in Belarus B.Sc Biotechnology engineering Worked for 3 years in a Biotech start-up company Started master study last year (wastewater and gray water treatment)
")
7
Denis Shteynberg Technion – Israel Institute of Technology July, 2013 Flow-Pressure apparatuses for identification of individual domestic appliances

8
Introduction Determine typical use patterns of domestic appliances Simulate diurnal individual domestic wastewater streams for input into an integrated dynamic simulation model To characterize GW composition

9
Introduction Current data is nearly 20 years old, no longer represents actual behavior patterns nor the flow characteristics of modern appliances Need to find a way to obtain flow rates and volumes of wastewater discharged from individual microcomponents in multiple households Several different techniques – past and modern : Diary Survey,SIMDEUM,HydroSens, FlowTrace, Identiflow

10
Our System

11
System concept To recognize the usage pattern of the different water using elements in the domestic use (dish washer, shower, toilet flush, etc.) Data obtained based on continuous analysis of volumetric flow rate changes within a home’s plumbing system The data will be collected with data logger which is connected to the standard water meter and the automatic GW sampler After the collection of the data water patterns will be recognized and analyzed (using Matlab or another software)
 Data obtained based on continuous analysis of volumetric flow rate changes within a home’s plumbing system The data will be collected with data logger which is connected to the standard water meter and the automatic GW sampler After the collection of the data water patterns will be recognized and analyzed (using Matlab or another software)")
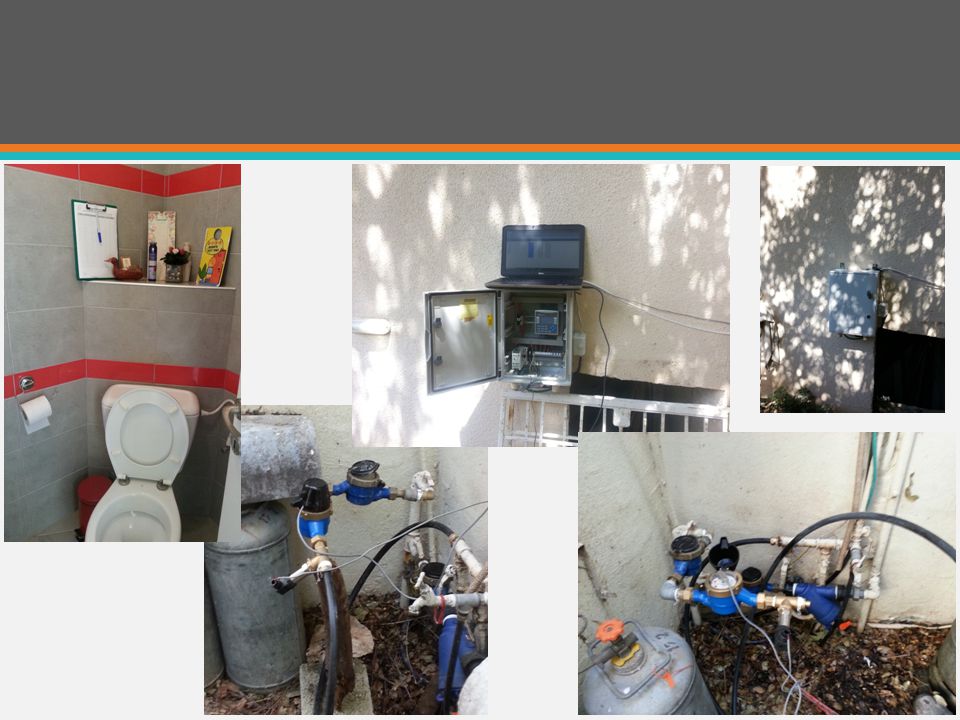
12
System components Standard water meter Controller/data logger reads the pressure and the volumetric flow rate (sample every sec.). Also controls the automatic sewerage sampler GW automatic sampler Pattern recognition software (being developed)
.")
13
Data logger/controller Water meter & pressure probe Automatic GW sampler Usage pattern analysis Gray water characterization Fresh water inlet GW outlet Water usage GW “production” Volumetric flow and GW quality characterization of single appliances System flow chart

15
Project status Two units of the apparatuses were built and tested The system was installed in five houses ( 3 completed, 2 on the run ) Duration of data acquisition in each house is 3 weeks Four of the houses have GW systems GW sampling haven’t been done yet
 Duration of data acquisition in each house is 3 weeks Four of the houses have GW systems GW sampling haven’t been done yet")
16
Data analyze The data is analyzed using MATLAB Data upload Import excel tables Data arrangement Adding zeros Identify “event” Separate to individual events Categorize / index Groups analyze Data summary Create output Data analyze

17
Results (House #1) Basal pressure (24hr)
 Basal pressure (24hr)")
18
Results (House #1)
")
19
717 events were recognized ( 277 were documented) Results (House #1)
 Results (House #1)")
20
Total volume (7 days) Results (House #1)
 Results (House #1)")
21
Total volume ( 7 days ) Results (House #3)
 Results (House #3)")
22
18 Liter each Results (House #3) 1 2 3 4
")
23
Multi events Results (House #3)
")
24
All events Results (House #3)
")
25
Further work Need to find a better way to identify a single “Event” Normalize the flow and the volume with the pressure change Construct a decision tree Collect data from more houses Multi event analysis

26
Decision tree

27
Conclusion There is a difficult to identify the dish washer and washing machine patterns A lot of background noise that needs to be filtered Pressure resolution is too high, difficult to get relevant data from the readings Multi event analysis is possible, but it requires better identification of multi event

Similar presentations


 Thesis Title: The integration and evaluation.>")
>")


>")
![The Urban Infrastructure Challenge in Canada: Focusing on Housing Affordability and Choice Presentation by CHBA – [Name] to The Municipal Council of [Name]](/17/5358765/big_thumb.jpg "The Urban Infrastructure Challenge in Canada: Focusing on Housing Affordability and Choice Presentation by CHBA – [Name] to The Municipal Council of [Name]>")


 School of Chemical Engineering Unit of Environmental Science and Technology (UEST) Katherine Haralambous.>")
