Download presentation
Presentation is loading. Please wait.

1
Assessment of the effects of greywater reuse on gross solids movement in sewer system
Roni Penn 1 Eran Friedler 1 , Manfred Schütze 2 1. Environmental, Water & Agricultural Eng. Faculty of Civil & Environmental Eng. Technion – Israel Institute of Technology Haifa, Israel 2. ifak- Institut fuer Automation und Kommunikation Magdeburg, Germany

2
Introduction Shortage of fresh water is a serious worldwide problem
Urban consumption (Israel) Over 700*106 m3/year- The sector consuming the largest amount of freshwater Domestic consumption 70% Greywater (GW) 60-70% Blackwater 30-40% Toilets Dark Kitchen sink Dishwasher Washing machine? Light Bath Shower Washbasin Potential reduction of GWR Toilet ~ 30% Toilet +garden irrigation ~ 40%
 Over 700*106 m3/year- The sector consuming the largest amount of freshwater. Domestic consumption. 70% Greywater (GW) 60-70% Blackwater % Toilets. Dark. Kitchen sink Dishwasher. Washing machine Light. Bath Shower Washbasin. Potential reduction of GWR. Toilet ~ 30% Toilet +garden irrigation ~ 40%")
3
Introduction GWR research focused, on a single-house scale, on recycling systems and possible sanitary and environmental affects. Effects on domestic WW quantity and quality, on urban wastewater collection systems and on urban wastewater treatment plants (WWTP) overlooked Questions to be asked: What could be the effects of GWR on urban WW collection systems and on WWTPs? Are these effects positive or negative? How will they change with increasing penetration of on-site GWR?
 overlooked. Questions to be asked: What could be the effects of GWR on urban WW collection systems and on WWTPs Are these effects positive or negative How will they change with increasing penetration of on-site GWR")
4
Introduction GW can contain non negligible concentrations of organic and microbial contamination. Treatment of GW before reuse Prevent sanitary and environmental hazards Prevent aesthetic disturbance Within the urban environment, GW "demand" < GW "production" Treat and reuse the less polluted GW streams (SH, BT and WB) The more polluted discharge to the urban sewer system
 The more polluted discharge to the urban sewer system.")
5
Types of homes contributing WW
“GWR” home “Conventional” home A B

6
Effect of GWR- quantity and quality effects
Quantity effects Wastewater flows released to the sewer reduced wastewater flows in the sewer network reduced wastewater flows to the WWTP reduced Quality effects Treatment changes the quality of the wastewater discharged to the urban sewer Reduced flows (less dilution?)
")
7
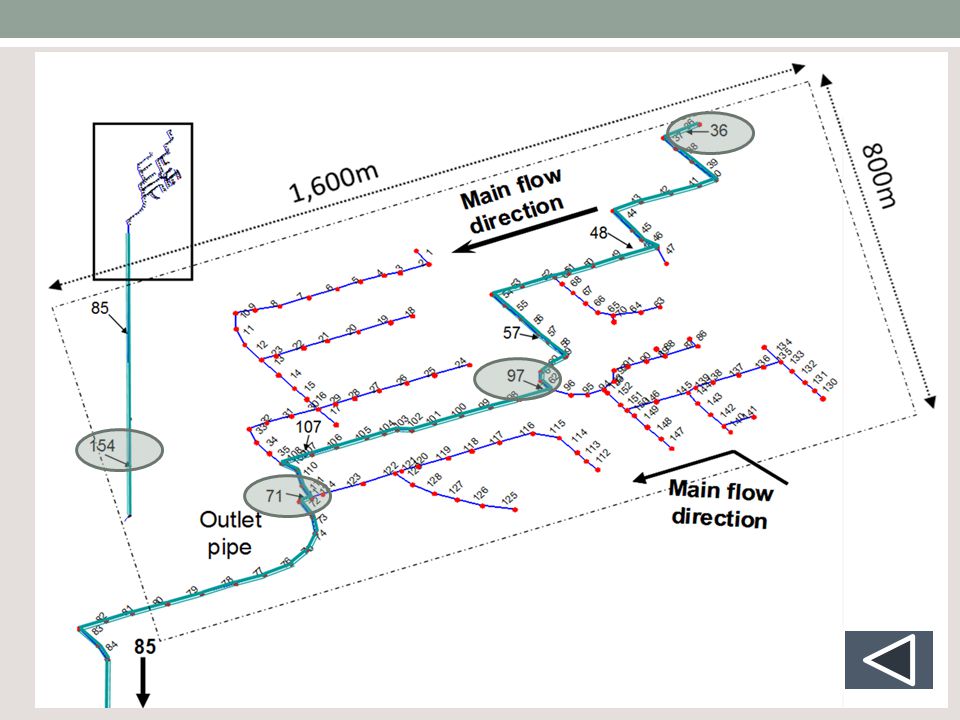
SIMBA 6 The chosen neighborhood 15,000 residents Flat
densely populated coastal area neighborhoods sewer pipes ~ 6 km Separate sewer 7

8
Scenarios examined Separate sewer systems, Sludge released at 8:00,
Current situation Extreme situation To be expected 1 2 3 4 5 GWR type & penetration proportion (1) NR 100% 0% 70% (2) RWC 30% 15% (3) RWC+IR Separate sewer systems, Sludge released at 8:00, Toilet flush volume: (1) 9L full, 6L half (2) 6L full, 3L half Effects of GWR on: Flow characteristics Gross solids movement sewer blockages? 8
 NR. 100% 0% 70% (2) RWC. 30% 15% (3) RWC+IR. Separate sewer systems, Sludge released at 8:00, Toilet flush volume: (1) 9L full, 6L half. (2) 6L full, 3L half. Effects of GWR on: Flow characteristics. Gross solids movement. sewer blockages 8.")
9
PROPORTIONAL DEPTH (d/D) [-]
Diurnal pattern LINK 36 LINK 97 LINK 71 LINK 154 FROUDE [-] FLOW [m3/min] VELOCITY [m/s] PROPORTIONAL DEPTH (d/D) [-] 0.5 1 5 4.5 4 3.5 3 2.5 2 1.5 0.08 0.07 0.06 0.05 0.04 0.03 0.02 0.01 1.4 1.2 0.8 0.6 0.4 0.2 0.7 0.3 0.1 T [h]
![PROPORTIONAL DEPTH (d/D) [-]](http://slideplayer.com/slide/5685233/18/images/9/PROPORTIONAL+DEPTH+%28d%2FD%29+%5B-%5D.jpg "Diurnal pattern. LINK 36. LINK 97. LINK 71. LINK 154. FROUDE [-] FLOW [m3/min] VELOCITY [m/s] PROPORTIONAL DEPTH (d/D) [-] T [h]")
10
Gross solid transport GWR domestic WW - reduces flows with in the sewer system – reduced higher rate of blockages? Upstream Downstream Flow Intermittent More steady Solids Larger, un-submerged Smaller, submerged different approaches for each part of the sewer: Upstream: based on model by Walslki et al., 2011. Downstream: based on model based on tractive force (TF) (Walski et al., 2004.)
 (Walski et al., 2004.)")
11
no attenuation, long duration with attenuation, short duration
Gross solid transport – upstream (Walslki et al., 2011) Flow to move solid no attenuation, long duration Pulse to move solid with attenuation, short duration 𝑽=𝒂𝑺𝑮/ 𝑺 𝟎.𝟐 SG specific gravity S slope of pipe Q flow (L/s) V volume of pulse (L) a 0.45: full - partial movement a 18: full - partial movement 0.25: no movement - partial movement 10: no movement - partial movement
 Flow to move solid. no attenuation, long duration. Pulse to move solid. with attenuation, short duration. 𝑽=𝒂𝑺𝑮/ 𝑺 𝟎.𝟐. SG specific gravity S slope of pipe. Q flow (L/s) V volume of pulse (L) a 0.45: full - partial movement a 18: full - partial movement. 0.25: no movement - partial movement 10: no movement - partial movement.")
12
Gross solid transport - upstream
0.02 0.22 0.76 0.28 0.39 0.33 0.06 0.94 0.11 0.38 0.51 0.14 0.86 0.18 0.36 0.46 0.27 0.38 0.35 0.02 0.21 0.77 𝟑.𝟓× 𝟑× 0.85 0.05 0.1 0.78 0.03 0.19 0.66 0.1 0.24 0.78 0.04 0.17 0.75 0.03 0.21 0.82 0.05 0.13

13
Gross solid transport - downstream
Average boundary tractive stress Critical Tractive Force TF (Walski et al., 2004) 𝝉=𝝆𝒈𝑹 𝑺 𝟏𝟎𝟎 𝝉 𝒄 =𝒌 𝒅 𝟎.𝟐𝟕𝟕 d=6mm 𝝆=1000 𝒌𝒈/𝒎 𝟑 𝝉 tractive stress (Pa), 𝝆 density of liquid (kg/m3) R hydraulic radius (m) K (N/m2) d diameter (mm) for a discrete design sand particle of 2.7 specific gravity For: discrete grit particle Transported often enough
 𝝉=𝝆𝒈𝑹 𝑺 𝟏𝟎𝟎. 𝝉 𝒄 =𝒌 𝒅 𝟎.𝟐𝟕𝟕. d=6mm 𝝆=1000 𝒌𝒈/𝒎 𝟑. 𝝉 tractive stress (Pa), 𝝆 density of liquid (kg/m3) R hydraulic radius (m) K (N/m2) d diameter (mm) for a discrete design sand particle of 2.7 specific gravity. For: discrete grit particle. Transported often enough.")
14
Modeling gross solid transport
Generator module SIMBA Velocity

15
Conclusions GWR: toilet flushing: saves ~25% of the water consumption
GWR: toilet flushing & irrigation: saves ~40% Higher GWR: Instantaneous: Q, V, (d/D) decrease Highest reduction – peak usage hours d/D decrease connect additional homes to existing sewers construct smaller systems Gross solid transport: Upstream links Middle links Downstream links Small amounts of WW discharged additional houses discharge WW full movement in all scenarios no GWR GWR Higher proportions of the day for full movement 67% of the day full / partial movement 76% of the day no movement
 decrease. Highest reduction – peak usage hours. d/D decrease connect additional homes to existing sewers. construct smaller systems. Gross solid transport: Upstream links. Middle links. Downstream links. Small amounts of WW discharged. additional houses discharge WW. full movement in all scenarios. no GWR. GWR. Higher proportions of the day for full movement. 67% of the day full / partial movement. 76% of the day no movement.")
16
THANKS FOR LISTENING! QUESTIONS?

17
Effects of GWR on domestic sewage
Parameter No GWR WC WC + Irrig Flow l/(cap·d) 138 102 81 COD load g/(cap·d) 148 137 130 TSS load 87 85 83 NH4-N load 2.9 2.8 PO4-P load 10 9.8 Bio. + Phys. Treatment (RBC) 17
 COD load. g/(cap·d) TSS load NH4-N load PO4-P load Bio. + Phys. Treatment. (RBC) 17.")
18
SIMBA model Hydrodynamic simulations- solves the full Saint Venant differential equations 18

19
SIMBA model The subsystem for inflow to a single node in the hydrodynamic model 19

21
Diurnal pattern LINK 36 LINK 97 LINK 71 LINK 154 Concentrations COD
3500 3000 2500 2000 1500 1000 500 80 70 60 50 40 30 20 10 180 160 140 120 100 2400 2200 1800 1600 1400 1200 800 600 400 Concentrations COD [mg/l] NH4+-N TSS PO43--P T [h]

22
Gross solid transport - upstream
Velocity Only solids with full movement solids move <<< liquid 𝑽 𝒔 𝑽 𝒇 =𝟏.𝟗𝟓 𝑺𝑮 −𝟐.𝟓 𝑺 𝟎.𝟐𝟓 𝑸 𝟏.𝟐 Vs velocity of the solid (m/s) Vf velocity of the liquid (m/s)
 Vf velocity of the liquid (m/s)")
23
Conclusions Q, V, (d/D) - Two main peaks significant morning peak
smaller evening peak COD & TSS concentrations - morning peak NH4+-N & PO43- -P - night peak Different use patterns of contributing appliances A decrease in the daily maximum flow and an increase in the daily minimum flow were found as a result of the attenuation and shift in time of the flows occurring aseptically in long pipes, which are in this case, the links located at the outlet of the neighborhood. When no additional wastewater is discharged to the sewer - the momentary, daily average and minimum values continue to increase, while the maximum values do not show a specific trend. velocity - no specific patterns of its momentary, daily maximum, minimum and average increase/decrease were found, this is since the velocity is influenced by the flow and geometry of the pipes. Further, low momentary velocities and proportional depth were found in links located upstream; this is because of the combination of the small pipe diameter and the small number of residents discharging their WW to those links. 23 23

24
Conclusions GWR: toilet flushing: saves 26% of the daily water consumption GWR: toilet flushing & irrigation: saves 41% Higher GWR: Instantaneous: Q, V, (d/D) decrease Highest reduction – peak usage hours Vmax > Vmin low possibility of negative effect on blockages rate (?) d/D decrease connect additional homes to existing sewers construct smaller systems (under some circumstances) Pollutants loads decrease (treatment) Pollutants concentrations increase (since higher decrease in flows) Sludge release (in morning peak) COD & TSS concentration peak (smaller peak in PO43--P) daily average, maximum and minimum concentrations of the pollutants examined also increased. This was as a result of the decrease in flow and hardly any changes in the pollutants loads Some decrease in the diurnal pollutants loads -in the peak water consumption times, aspectual in the morning. Greater reuse – Greater reduction The peak of the sludge release- accurse before the consumption peak 24 24
 decrease. Highest reduction – peak usage hours. Vmax > Vmin low possibility of negative effect on blockages rate ( ) d/D decrease connect additional homes to existing sewers. construct smaller systems (under some circumstances) Pollutants loads decrease (treatment) Pollutants concentrations increase (since higher decrease in flows) Sludge release (in morning peak) COD & TSS concentration peak (smaller peak in PO43--P) daily average, maximum and minimum concentrations of the pollutants examined also increased. This was as a result of the decrease in flow and hardly any changes in the pollutants loads. Some decrease in the diurnal pollutants loads -in the peak water consumption times, aspectual in the morning. Greater reuse – Greater reduction. The peak of the sludge release- accurse before the consumption peak")
25
Conclusions Gross solid transport: Upstream links Middle links
Downstream links Small amounts of WW discharged additional houses discharge WW full movement in all scenarios Higher proportions of the day for full movement no GWR GWR 75% of the day full / partial movement 65% of the day no movement

Similar presentations


 WP2 – INTEGRATED CATCHMENT SIMULATOR.>")

 Isaac Volschan Jr. Water Resources and Environmental Engineering Department Federal.>")


