Download presentation
Presentation is loading. Please wait.

1
Critical Design Review November 2015
SAM 301 Critical Design Review November 2015

2
Critical Design Review
Question Y/N Slide? 1 Are action items from PDR complete? Y 2 Are detailed summaries of each module/storyboards complete? * 3 Have any copyright issues developed? NA 4 Is all required media (articles, videos etc.) available? 5 Are draft quizzes, tests and associated rubrics complete? 6 What is the course transition strategy? 7 Is the instructor pilot scheduled? Who will attend and where? TBD
 available 5. Are draft quizzes, tests and associated rubrics complete 6. What is the course transition strategy 7. Is the instructor pilot scheduled Who will attend and where TBD.")
3
CDR Focused on new LOs Contained in Instructor ISP 2
Are detailed summaries of each module/storyboards complete? Y Focused on new LOs Contained in Instructor ISP

4
New ELO Mapping to Modules
Enabling Learning Objectives Module Given an IT acquisition scenario, modify a software development capability release plan to increase the likelihood of success (on-time, on-schedule and with the required functionality) in delivering an IT system. (BL 3) Update Module 04 (Case Study) Given a software system lifecycle approach, evaluate the effectiveness and efficiency of the approach over its lifecycle. (BL 5) Module 14 : Adapt and improve the IT measurement process. (BL 3) (IRM304 Share) Build New Topic 07 : Given a scenario, collect and process measurement and context relevant IT management and technical data. (BL 3) (IRM304 Share) Given a scenario, make actionable recommendations. (BL 3) (IRM304 Share) Module 09 : Given a scenario, analyze the collected IT data with respect to the defined information needs. (BL 4) (IRM304 Share) : Given a scenario, evaluate the effectiveness of an IT measurement and analysis program. (BL 5)
 in delivering an IT system. (BL 3) Update. Module 04. (Case Study) Given a software system lifecycle approach, evaluate the effectiveness and efficiency of the approach over its lifecycle. (BL 5) Module : Adapt and improve the IT measurement process. (BL 3) (IRM304 Share) Build New. Topic : Given a scenario, collect and process measurement and context relevant IT management and technical data. (BL 3) (IRM304 Share) Given a scenario, make actionable recommendations. (BL 3) (IRM304 Share) Module : Given a scenario, analyze the collected IT data with respect to the defined information needs. (BL 4) (IRM304 Share) : Given a scenario, evaluate the effectiveness of an IT measurement and analysis program. (BL 5)")
5
CDR Primary changes: Other changes: Mod 4: F18 Case Study
6 What is the course transition strategy? TBD * Primary changes: Mod 4: F18 Case Study Mod 7: New Measurement Lesson Mod 9: UUV Case Study Mod 14: GBS Case Study Other changes: Mod 2: Software Acquisition Initiatives Mod 6: EFV Case Study Mod 5, 9, 10, 11, 13: Review and Update Existing Topic Mod 12: TPM Case Study

6
Transition strategy for targeted updates
Monday Pre-Assignment Change welcome message 01-Introduction 02- Topic: Software Acquisition Challenges Combine old mods 2&3/Update Lunch 03-Topic: Critical Thinking and Problem Solving Learning Team Discussion (F18) 04-Case: F18 Software Release Plan Update/Cleanup file Reflection & Reading Assignments Tuesday Daily Startup Learning Team Discussion (UUV) 05- Topic: Human Capital Issues Review/Update topic for currency 06-Case: EFV Training Clean up case study file 07-Topic SW Program Success Build new lesson *Red indicates primary changes affected by new ELOs, Green are secondary changes
 Case: F18 Software. Release Plan Update/Cleanup file Reflection & Reading Assignments. Tuesday Daily Startup Learning Team Discussion (UUV) Topic: Human Capital Issues. Review/Update topic for currency Case: EFV Training. Clean up case study file. 07-Topic SW Program Success. Build new lesson. *Red indicates primary changes affected by new ELOs, Green are secondary changes.")
7
Transition strategy for targeted updates
Wednesday Daily Startup Learning Team Discussion(EFV) 08-Topic: Software Quality Review/Update topic for currency Lunch 09-Case: UUV Metrics Update/Cleanup file 10-Topic: Requirements Management Reflection & Reading Assignments Thursday Learning Team Discussion(TPM) 11-Topic: Software Development 12-Case: TPM Clean up case study file 13-Topic: Technology Advancement Friday Learning Team Discussion(GBS) 14-Case: GBS Lifecycle Update/Cleanup file 15-Topic: Next Steps Graduation *Red indicates primary changes affected by new ELOs, Green are secondary changes
 Topic: Software Quality. Review/Update topic for currency Lunch Case: UUV. Metrics Update/Cleanup file Topic: Requirements Management Reflection & Reading Assignments. Thursday. Learning Team Discussion(TPM) 11-Topic: Software Development. 12-Case: TPM. Clean up case study file. 13-Topic: Technology Advancement. Friday. Learning Team Discussion(GBS) Case: GBS. Lifecycle Update/Cleanup file Topic: Next Steps Graduation. *Red indicates primary changes affected by new ELOs, Green are secondary changes.")
8
CDR 5 Are draft quizzes, tests and associated rubrics complete? Y Rubrics:

9
70 points required to pass
SAM-301 Grading Case Study Analysis (40 points) Questions at end of case study to help guide the analysis Learning Team Participation (30 points) Peer evaluation form (Friday AM) Large Group Participation (30 points) Instructor evaluation 70 points required to pass
 Questions at end of case study to help guide the analysis. Learning Team Participation (30 points) Peer evaluation form (Friday AM) Large Group Participation (30 points) Instructor evaluation. 70 points required to pass.")
10
1-Case Study Analysis (40 points)
How you answer homework questions 1-2 pages submitted at end of learning team discussion + 10 points for completion and submitting on time Case Study Analysis Rubric + 10 points + 20 points + 30 points Weakly applies function knowledge relevant to case making incorrect statements Shows a lack of familiarity with basic facts by making incorrect statements Correctly applies functional knowledge to case parameters Evidences understanding of basic facts and key issues In addition to +20 point requirements… Integrates facts and identifies implications Explicates relationships among issues

11
2-Learning Team Participation(30 points)
Your contribution to Learning Team effort Peer evaluation assessment on Friday AM

12
Learning Team CONFIDENTIAL STUDENT RECONGNITION

13
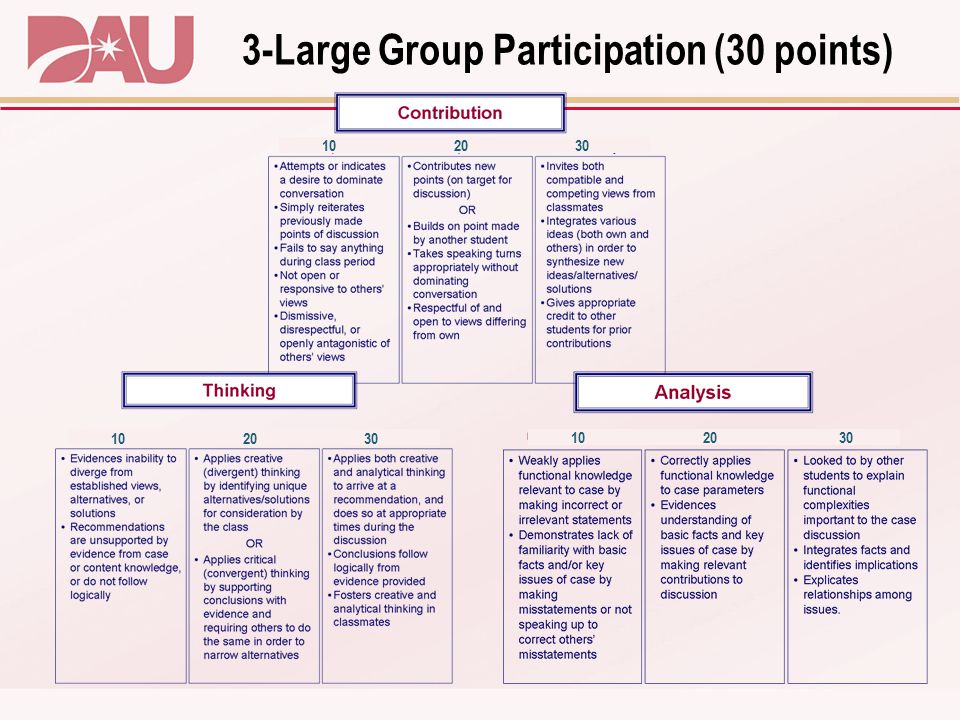
3-Large Group Participation (30 points)
14
Risk Register Item Risk Severity Mitigation 1 SME Availability
Scheduled deliverables 2

15
Action Register 1 Agreement by sponsor on course description
Item Action Due Assigned 1 Agreement by sponsor on course description Cooke/Skertic 2 Projected course throughput Skertic 4 Allocate LO’s to modules Complete Cooke 3 Validate File Structure on Blackboard (stud focus) 10/31 Cooke/Debra 5 Find DBS Case Study 11/31 6 Update Course Intro Message 7 Build Measurement Topic Lesson 11/30 TBD 8 Build SW Acquisition Challenge Topic Lesson
 10/31. Cooke/Debra. 5. Find DBS Case Study. 11/ Update Course Intro Message. 7. Build Measurement Topic Lesson. 11/30. TBD. 8. Build SW Acquisition Challenge Topic Lesson.")
16
Backup

17
Course Description Software Acquisition Management (SAM) 301 is a case-based course for senior managers who acquire, engineer, test, and evaluate DoD software-intensive systems. SAM 301 is also for acquisition professionals interested in obtaining comprehensive insight into the risks and issues associated with developing and implementing complex DoD software systems. Case study analysis, topical area discussion, and subject matter expert presentations are used to cover topics related to the planning, management and sustainment of software systems.
 301 is a case-based course for senior managers who acquire, engineer, test, and evaluate DoD software-intensive systems. SAM 301 is also for acquisition professionals interested in obtaining comprehensive insight into the risks and issues associated with developing and implementing complex DoD software systems. Case study analysis, topical area discussion, and subject matter expert presentations are used to cover topics related to the planning, management and sustainment of software systems.")
18
MAJOR TAKEAWAYS There is rarely a single “correct” release plan
ELO : Given an IT acquisition scenario, modify a software development capability release plan to increase the likelihood of success (on-time, on-schedule and with the required functionality) in delivering an IT system. (BL 3) MAJOR TAKEAWAYS There is rarely a single “correct” release plan Establish time boxed release schedules (fix cost and schedule and push capability to the next release) As more information is gathered on the project your release plan will likely change to meet the needs of technology and / or the customer- this is a good thing.
 in delivering an IT system. (BL 3) MAJOR TAKEAWAYS. There is rarely a single correct release plan. Establish time boxed release schedules (fix cost and schedule and push capability to the next release) As more information is gathered on the project your release plan will likely change to meet the needs of technology and / or the customer- this is a good thing.")
19
ELO : Given a software system lifecycle approach, evaluate the effectiveness and efficiency of the approach over its lifecycle. (BL 5) MT 8. Considerations for recommended changes could include - Software Development Plan (SDP), Post-Deployment Software Support (PDSS),Data Protection and Software Assurance, Software Data Management and Technical Data Rights, Software Reuse, Software Acquisition and Sustainment Costs, Software Safety, the use of Modular Open Systems, and a documented software architecture.
, Post-Deployment Software Support (PDSS),Data Protection and Software Assurance, Software Data Management and Technical Data Rights, Software Reuse, Software Acquisition and Sustainment Costs, Software Safety, the use of Modular Open Systems, and a documented software architecture.")
20
ELO : Given a scenario, collect and process measurement and context relevant IT management and technical data. (BL 3) (IRM304 Share) MAJOR TAKEAWAYS Data must be collected, in accordance with the specified measures, to support measurement analysis based on the established information needs. Usually, data is collected on a periodic basis. Only the data necessary to satisfy the defined information needs should be collected. Both quantitative attribute data, and relevant program/technical context data, is required. The data comes from multiple sources, in multiple formats. It must be evaluated for availability, integrity, and usability. Data must be normalized and aggregated in accordance with the measurement specifications and measurement plan. Data should be stored in an accessible data repository. An Excel workbook is sufficient for many applications. Historical data, plans, and actual data are collected. Attention should be paid to changes in plans over time. Low level data should be collected, to allow localization of problems and detailed analysis.

21
ELO : Given a scenario, analyze the collected IT data with respect to the defined information needs. (BL 4) (IRM304 Share) MAJOR TAKEAWAYS Analysis includes estimation, feasibility analysis, and performance analysis. An indicator is a primary analysis product. It is a measure that provides an estimate or evaluation of specified attributes with respect to an information need. It includes one or more values of base and/or derived measures, along with the decision criteria used to assess the indicator value. Indicators support all three types of analysis. Indicators are systematically generated, analyzed, and reviewed to: produce assessments relative to known information needs identify new information needs (problems, risks, lack of information) Indicators include: 1) pre-defined "recurring” indicators that address identified information needs, and 2) “as required” indicators needed to address new questions or to localize problems. Estimation provides expectations of key project and enterprise performance parameters, allow evaluation of the feasibility of plans, project end-item results based on performance to date, help evaluate risk, and establish enterprise performance baselines. Feasibility Analysis is an evaluation of whether plans are realistic and achievable. It helps to define alternatives and identify risks. Feasibility analysis includes comparisons of project parameters and consistency of assumptions and adjustments. It establishes confidence in the plans. Performance Analysis uses plans and actual data to monitor status and answer questions such as: Is the work tracking to the plan(s)? and is the variance significant? Performance Analysis produces status information and exposes problems and risks. It includes analysis of leading indicators, critical path items, and inconsistent trends. Analysis must take into account the cause and effect relationships between key measurement information categories (integrated analysis).
 Indicators include: 1) pre-defined recurring indicators that address identified information needs, and 2) as required indicators needed to address new questions or to localize problems. Estimation provides expectations of key project and enterprise performance parameters, allow evaluation of the feasibility of plans, project end-item results based on performance to date, help evaluate risk, and establish enterprise performance baselines. Feasibility Analysis is an evaluation of whether plans are realistic and achievable. It helps to define alternatives and identify risks. Feasibility analysis includes comparisons of project parameters and consistency of assumptions and adjustments. It establishes confidence in the plans. Performance Analysis uses plans and actual data to monitor status and answer questions such as: Is the work tracking to the plan(s) and is the variance significant Performance Analysis produces status information and exposes problems and risks. It includes analysis of leading indicators, critical path items, and inconsistent trends. Analysis must take into account the cause and effect relationships between key measurement information categories (integrated analysis).")
22
ELO 19. 2. 2. 3: Given a scenario, make actionable recommendations
ELO : Given a scenario, make actionable recommendations. (BL 3) (IRM304 Share) MAJOR TAKEAWAYS Insight into issues and objectives is generally improved by reviewing multiple related indicators together. The measurement results must be clearly presented to the decision makers in an understandable format. The measures and analysis results should be communicated to the stakeholder team. The measurement results must be interpreted within the context of the program - the objectives, assumptions, and constraints. The actions dictated by the measurement results may not be possible: recommendations may have to optimize within project or enterprise constraints.
 (IRM304 Share) MAJOR TAKEAWAYS. Insight into issues and objectives is generally improved by reviewing multiple related indicators together. The measurement results must be clearly presented to the decision makers in an understandable format. The measures and analysis results should be communicated to the stakeholder team. The measurement results must be interpreted within the context of the program - the objectives, assumptions, and constraints. The actions dictated by the measurement results may not be possible: recommendations may have to optimize within project or enterprise constraints.")
23
ELO 19. 2. 2. 4: Adapt and improve the IT measurement process
ELO : Adapt and improve the IT measurement process. (BL 3) (IRM304 Share) MAJOR TAKEAWAYS Both the measures and the measurement process must be regularly evaluated and updated. Measures and indicators must be evaluated to see if they provide usable decision information, and are being used. The measurement process should also be evaluated for effectiveness and efficiency, and to see if the defined process is sufficient and being followed. Artifacts and observations from the measurement process should be shared. Lessons learned may be used to change the process or as a basis for additional training. Lessons learned may be implemented as improvements to the current project or enterprise’s measurement implementation or for future projects.
 (IRM304 Share) MAJOR TAKEAWAYS. Both the measures and the measurement process must be regularly evaluated and updated. Measures and indicators must be evaluated to see if they provide usable decision information, and are being used. The measurement process should also be evaluated for effectiveness and efficiency, and to see if the defined process is sufficient and being followed. Artifacts and observations from the measurement process should be shared. Lessons learned may be used to change the process or as a basis for additional training. Lessons learned may be implemented as improvements to the current project or enterprise’s measurement implementation or for future projects.")
24
ELO 19.1.2.5 Given a scenario, evaluate the effectiveness of an IT measurement and analysis program.
MT 26: Measurement analysis focuses on taking the measured IT parameter results and transforming them, through the use of various constructs, into information products that relate directly to one or more information needs all information products are based on the measurement of key program/system attributes at a low level - base measures base measures are systematically combined, using consistently defined relationships, to quantify an IT activity or product. The measurement result is then compared against established decision criteria, and presented as a measurement indicator the measurement indicator conveys the measurement results to the decision maker - it usually compares the measured results to pre-established thresholds that determine the need for action integrated analysis combines multiple indicators and focuses on the cause and effect relationships inherent between IT performance parameters - integrated analysis helps to identify and correct performance factor inconsistencies MT 27: Measurement derived information must be coupled with program context information to interpret the numbers correctly. measurement information products need to be understood and “usable” by both program and enterprise decision makers. decision makers must understand the measures presented to them and the associated data and analysis. They have to be able to evaluate the limitations of the measurement results. most program decisions are supported by multiple measures (tightly coupled attributes) and different types of information - there is no single measure that indicates IT program performance - there is no single number that indicates “good” or “bad”. MT 28: The decision maker may not always be able to make “fact-based” decisions - there are inherent limitations with every program environment.
 and different types of information - there is no single measure that indicates IT program performance - there is no single number that indicates good or bad . MT 28: The decision maker may not always be able to make fact-based decisions - there are inherent limitations with every program environment.")
25
Assessment Strategy Student homework graded for quality of analysis
Students evaluated by instructors for participation and quality of input during case study large group discussions Students evaluated by peers for quality of participation during small group discussions and presentations Students evaluation by instructors during daily reflection for guest speaker and discussion takeaways and application to their job

Similar presentations


 Application Lifecycle Management.>")


 Pty Ltd Hill, Hill, Perlitz, Professional Training & Assessment, 1e C HAPTER 8 TAEASS502B Design.>")


 Dick Burk Chief Architect and Director of Federal Enterprise Architecture Program, OMB.>")

 – Ver 1.2 Staged Representation Conducted by: QAI India SM - CMMI is a service.>")
